
INTRODUCTION
Pulmonary neuroendocrine (NE) tumors constitute a histologic spectrum of lung tumors with varying degrees of clinical aggressiveness. Pathologic subtypes include typical carcinoid (TC), atypical carcinoid (AC), large cell neuroendocrine carcinoma (LCNEC), and small cell lung carcinoma (SCLC). TC and AC differ in cellular atypia and quantity of mitotic figures but are both considered well-differentiated and less aggressive. LCNEC and SCLC have more malignant pathologic features and are quite aggressive in terms of clinical outcome. They account for 15% to 20% of deaths from lung cancer [1]. Standard therapy for SCLC typically involves chemotherapy alone or in combination with radiation depending on the stage of the disease. While many patients will experience a good initial response, the vast majority of patients will ultimately become refractory to therapy and die of their disease. Median survival for patients diagnosed with extensive stage of SCLC is less than 1 year [2, 3].
In an attempt to identify new targets of therapy that will improve the outcome for SCLC, preclinical and clinical studies have been conducted to assess for molecular and genetic drivers of neuroendocrine tumors especially, SCLC. Loss of tumor suppressor genes p53 and RB1, developmental pathway gene, NOTCH and activation of oncogenes c-kit and MYC have been identified to be frequently altered and considered to play key roles in disease initiation and progression [4-6]. The anti-apoptotic protein Bcl-2 is one of the earliest described molecular alterations in SCLC leading to recent attempts at therapeutic strategy targeting this pathway. Bcl-2 and its family members constitute a dynamic family of pro and antiapoptotic molecules involved in cancer cell development, progression and resistance to treatment [21]. However, the prognostic impact and predictive value of Bcl-2 expression in SCLC remains controversial [7-12]. While overexpression of Bcl-2 is frequently observed in SCLC, the prognostic implication has been difficult to establish. Some studies indicated a poor prognostic outcome while others have identified a correlation of total Bcl-2 expression with poor prognosis in SCLC [1, 7-11]. Moreover, clinical trials looking at anti-Bcl2 targeted agents failed to achieve meaningful clinical benefit [13-15].
Phosphorylation of Bcl-2 (pBcl-2) is a regulatory step that controls its biological activity, which has not been well-studied in SCLC [16]. We hypothesize that pBcl-2 is a more relevant biomarker for prognostic assessment and for guiding patient selection for therapeutic intervention. Moreover, other components of the Bcl-2 family of proteins including Mcl-1, NR-13, A1, Bcl-w, Bcl-xL, Bcl-2, Bax, Bak and Bad have complementary and antagonistic activity. Mcl-1 has a predominant antiapoptotic activity and has been shown to better predict resistance to anti Bcl-2 therapy in preclinical models [17, 18]. To better elucidate the role of Bcl-2 dysfunction in pulmonary NE neoplasms, we assessed the biologically relevant form of Bcl-2 and the predominant prosurvival family member, Mcl-1, and compared expression pattern across different histologic subtypes of pulmonary neuroendocrine (NE) tumors. Understanding the role of Bcl-2 and Mcl-1, particularly the biologically active phosphorylated forms, will help guide the development of targeted therapeutic agents for pulmonary NE tumors, especially SCLC.
RESULTS
Subjects and tumor types
We identified 77 eligible cases of pulmonary neuroendocrine tumors that underwent surgical resection for inclusion in this study. Due to the requirement for surgical resection, the vast majority of patients had relatively early stage of disease. Majority of the cases was female (60%) and of Caucasian race (82%). Breakdown by histology showed 16 cases of carcinoid, 41 cases of SCLC and 20 cases of LCNEC. The detailed demographics and clinical characteristics are presented in Table 1.
Table 1: Patient and tumor characteristics
Characteristics |
N=77 |
|---|---|
Age, Mean (± SD) |
61.45 (± 12.08) |
Tumor Histology, N (%) |
|
Carcinoid |
16 (20.78) |
SCLC |
41 (53.25) |
LCNEC |
20 (25.97) |
Ethnicity, N (%) |
|
Caucasian |
58 (75.32) |
Others * |
19 (24.68) |
Gender, N (%) |
|
Male |
31 (40.26) |
Female |
46 (59.74) |
Smoking status, N (%) |
|
Smokers |
58 (75.32) |
Non-smokers |
13 (16.88) |
Unknown |
6 (7.79) |
Stage at presentation, N (%) ** |
|
I |
21 (27.27) |
II |
6 (7.79) |
III |
7 (9.09) |
IV |
16 (20.78) |
Limited |
21 (27.27) |
Unknown |
6 (7.79) |
Tissue sample source, N (%) |
|
Excisional Biopsy |
17 (22.08) |
Wedge Resection |
7 (9.09) |
Segmentectomy |
3 (3.90) |
Lobectomy |
15 (19.48) |
Pneumonectomy |
2 (2.60) |
Unknown |
33 (42.86) |
Note: SCLC=small cell lung cancer; LCNEC=large cell neuroendocrine carcinoma; Carcinoid includes atypical and typical carcinoid.
*Includes Black, Asian, or unknown
**Staging consisted of TNM staging system or two-stage criteria (limited disease versus extensive disease).
Protein expression and tumor histologies
Pairwise comparison showed no significant correlation between Mcl-1 and Bcl-2 expression and only a weak correlation observed between pBcl-2 and pMcl-1 (Table 2) both in terms of intensity of cytoplasmic expression (CC: 0.213; p=0.067) and immunoscore (CC: 0.259; p=0.025). Assessment of cytoplasmic and nuclear expression (Bcl-2, pBcl-2, Mcl-1, and pMcl-1) for total and phosphorylated forms of Bcl-2 and Mcl-1 showed significant differences in expression by histology (Figure 1; Table 3). Bcl-2 showed highest expression in LCNEC, followed by SCLC and lowest expression in carcinoid while pBcl-2 showed highest expression in SCLC, followed by LCNEC and lowest expression in carcinoid (Figure 1). There was no significant difference in the expression of Mcl-1 or pMcl-1 across different tumor histologies (Figure 2; Table 3). A consistent pattern of increased expression of Bcl-2 and pBcl-2 but not Mcl-1 or its activated form, pMcl-1, was observed when the comparison was defined by benign (carcinoid) and malignant (SCLC and LCNEC) pulmonary neuroendocrine tumor histologies (Table 4).
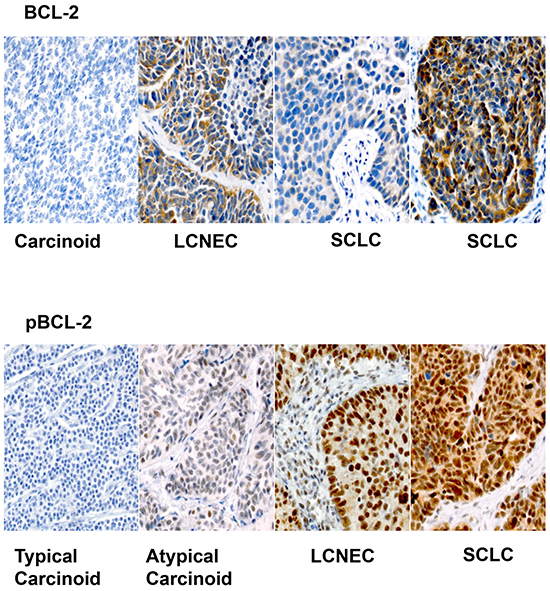
Figure 1: Representative sections (X200) showing variable expression of Bcl-2 across different histologic types of pulmonary neuroendocrine tumors. Note the more predictable pattern of expression of pBcl-2 with higher expression in LCNEC and SCLC compared to carcinoid tumors.
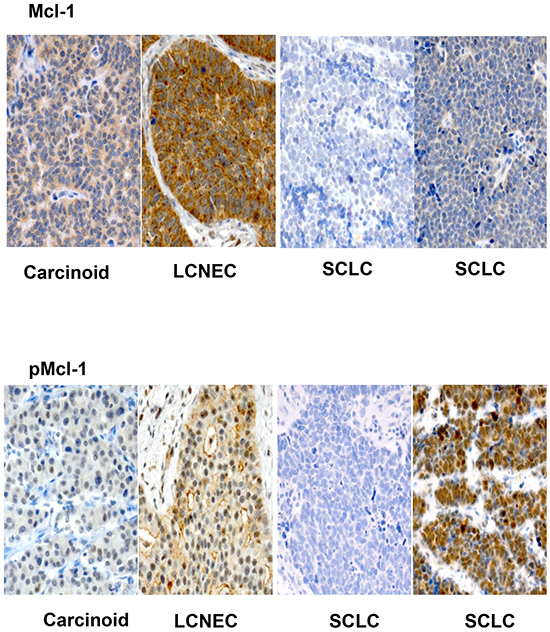
Figure 2: Representative sections (X200) showing variable expression of Mcl-1 and pMcl-1 across various histologic subtypes of pulmonary neuroendocrine tumors. Note the higher expression of pMcl-1 in LCNEC and SCLC compared to carcinoid but greater variability in expression compared to pBcl-2.
Table 2: Pairwise associations between protein expressions
Bcl-2 |
Mcl-1 |
CC |
P-value |
|---|---|---|---|
Bcl-2 Cytoplasm Intensity |
Mcl-1 Cytoplasm Intensity |
0.125 |
0.280 |
Bcl-2 Cytoplasm Score |
Mcl-1 Cytoplasm Score |
0.15 |
0.197 |
P-Bcl-2 Cytoplasm Intensity |
P-Mcl-1 Cytoplasm Intensity |
0.213 |
0.067 |
P-Bcl-2 Cytoplasm Score |
P-Mcl-1 Cytoplasm Score |
0.259 |
0.025 |
P-Bcl-2 Nuclear Intensity |
P-Mcl-1 Nuclear Intensity |
-0.139 |
0.233 |
P-Bcl-2 Nuclear Score |
P-Mcl-1 Nuclear Score |
-0.108 |
0.358 |
Note: CC, correlation coefficient; Bcl-2 Nuclear Intensity, Bcl-2 Nuclear Score, Mcl-1 Nuclear Intensity, and Mcl-1 Nuclear Score were all zeros.
P-value is calculated by Spearman rank correlation.
Table 3: Differences in protein expression comparing carcinoid, SCLC and LCNEC
Protein |
All patients |
Tumor Histology |
P-value |
||
|---|---|---|---|---|---|
Carcinoid |
SCLC |
LCNEC |
|||
Bcl-2 Cytoplasm Intensity |
1.25 (0 - 3) |
0 (0 - 40) |
42.5 (0 - 100) |
52.5 (0 - 100) |
<.001 |
Bcl-2 Cytoplasm Score |
40 (0 - 300) |
0 (0 - 100) |
90 (0 - 300) |
105 (0 - 300) |
<.001 |
Mcl-1 Cytoplasm Intensity |
2.5 (0 - 3) |
2.5 (1 - 3) |
2.5 (0 - 3) |
2.5 (1 - 3) |
0.737 |
Mcl-1 Cytoplasm Score |
250 (0 - 300) |
243.75 (60 - 300) |
250 (0 - 300) |
250 (75 - 300) |
0.637 |
P-Bcl-2 Nuclear Intensity |
2 (0 - 3) |
0.75 (0 - 3) |
2 (0 - 3) |
2 (0 - 3) |
0.044 |
P-Bcl-2 Nuclear Score |
142.5 (0 - 300) |
12.5 (0 - 255) |
200 (0 - 300) |
141.25 (0 - 300) |
<.001 |
P-Bcl-2 Cytoplasm Intensity |
1 (0 - 3) |
1 (0 - 2.5) |
2 (0 - 2.5) |
1 (0 - 3) |
0.012 |
P-Bcl-2 Cytoplasm Score |
90 (0 - 300) |
25 (0 - 200) |
180 (0 - 250) |
62.5 (0 - 300) |
<.001 |
P-Mcl1 Nuclear Intensity |
0 (0 - 3) |
0 (0 - 2) |
0 (0 - 3) |
0 (0 - 2) |
0.932 |
P-Mcl1 Nuclear Score |
0 (0 - 297) |
0 (0 - 20) |
0 (0 - 297) |
0 (0 - 60) |
0.901 |
P-Mcl1 Cytoplasm Intensity |
2 (0 - 3) |
2 (1 - 3) |
2 (0 - 3) |
2 (1 - 3) |
0.455 |
P-Mcl1 Cytoplasm Score |
190 (0 - 300) |
110 (20 - 237.5) |
200 (0 - 300) |
180 (30 - 300) |
0.147 |
Data are presented as median (range).
Note: SCLC=small cell lung cancer; LCNEC=large cell neuroendocrine carcinoma; Carcinoid includes atypical and typical carcinoid; Bcl-2 Nuclear Intensity, Bcl-2 Nuclear Score, Mcl-1 Nuclear Intensity, and Mcl-1 Nuclear Score were all zeros.
P-value is calculated by Kruskal-Wallis test.
Table 4: Differences in protein expression comparing benign (carcinoid) and malignant (SCLC and LCNEC) pulmonary neuroendocrine tumors
Protein |
Tumor Histology |
P-value |
|
|---|---|---|---|
Carcinoid |
SCLC/LCNEC |
||
Bcl-2 Cytoplasm Intensity |
0 (0 - 40) |
45 (0 - 100) |
<.001 |
Bcl-2 Cytoplasm Score |
0 (0 - 100) |
90 (0 - 300) |
<.001 |
Mcl-1 Cytoplasm Intensity |
2.5 (1 - 3) |
2.5 (0 - 3) |
0.628 |
Mcl-1 Cytoplasm Score |
243.75 (60 - 300) |
250 (0 - 300) |
0.453 |
P-Bcl-2 Nuclear Intensity |
0.75 (0 - 3) |
2 (0 - 3) |
0.020 |
P-Bcl-2 Nuclear Score |
12.5 (0 - 255) |
190 (0 - 300) |
<.001 |
P-Bcl-2 Cytoplasm Intensity |
1 (0 - 2.5) |
1 (0 - 3) |
0.021 |
P-Bcl-2 Cytoplasm Score |
25 (0 - 200) |
95 (0 - 300) |
0.003 |
P-Mcl1 Nuclear Intensity |
0 (0 - 2) |
0 (0 - 3) |
0.762 |
P-Mcl1 Nuclear Score |
0 (0 - 20) |
0 (0 - 297) |
0.731 |
P-Mcl1 Cytoplasm Intensity |
2 (1 - 3) |
2 (0 - 3) |
0.479 |
P-Mcl1 Cytoplasm Score |
110 (20 - 237.5) |
190 (0 - 300) |
0.093 |
Data are presented as median (range).
Note: SCLC=small cell lung cancer; LCNEC=large cell neuroendocrine carcinoma; Carcinoid includes atypical and typical carcinoid; Bcl-2 Nuclear Intensity, Bcl-2 Nuclear Score, Mcl-1 Nuclear Intensity, and Mcl-1 Nuclear Score were all zeros.
P-value is calculated by Wilcoxon rank-sum test.
Protein expression and clinical characteristics
There was a significant association of smoking (Figure 3) with higher cytoplasmic (p=0.001) and nuclear expression (p=0.005) of Bcl-2. A similar pattern was observed with pBcl-2 based on cytoplasmic (p=0.008) and nuclear (p=0.006) localization of the staining. There was no significant association between Mcl-1 or pMcl-1 expression and smoking status but cytoplasmic expression of Mcl-1 was associated with male gender (by intensity; p=0.007 and immunoscore; p=0.009). There was no consistent association between protein expression and other clinical variables such as age or race or the patients.
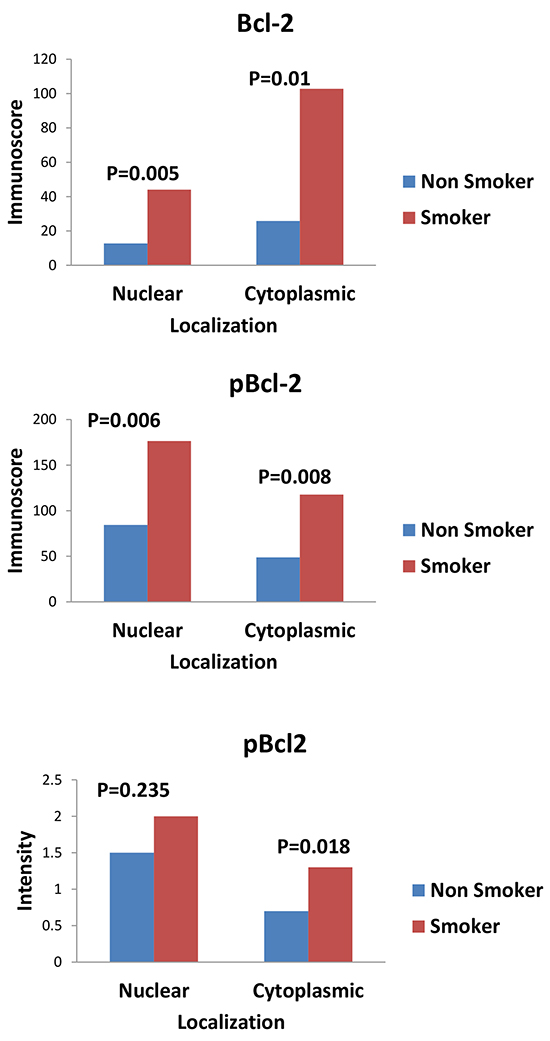
Figure 3: Graphs showing the comparison of expression of Bcl-2 and pBcl-2 between smokers and non smokers. There was higher expression of both total Bcl-2 and pBcl-2 in smokers versus non smokers.
Protein expression and survival
Univariate analyses showed that the expression of total Bcl-2 and pBcl-2 was significantly associated with patient outcome whereby the risk of progression and or death was higher in patients with higher levels of expression of Bcl2 and pBcl-2. The observed association was stronger with pBcl2. The intensity of staining both in the cytoplasm and in the nucleus showed a stronger association with PFS and OS than immunoscore (Tables 5 and 6). On multivariate analysis with adjustment for known prognostic factors such as race, smoking status and stage at presentation, higher level of pBcl-2 expression measured as nuclear staining intensity was still associated with a higher risk of progression (HR: 1.54; 95% CI: 1.08-2.20; p-value=0.016, Table 7). Higher pMcl-1 score in cytoplasm was associated with a higher risk of progression HR: 1.31; 95% CI: 1.02-1.68; p-value=0.046, Table 5) while there was no significant association with OS (Table 6).
Table 5: Univariate analysis of progression free survival
Variable |
N |
Hazard Ratio (95% CI) |
P-value |
|---|---|---|---|
Tumor Histology * |
|||
Carcinoid |
16 |
0.28 (0.13-0.63) |
0.002 |
SCLC |
40 |
1.76 (1.02-3.02) |
0.042 |
LCNEC |
20 |
1 (Ref) |
|
Ethnicity |
|||
Caucasian |
57 |
0.66 (0.39-1.12) |
0.126 |
Others |
19 |
1 (Ref) |
|
Gender |
|||
Male |
31 |
1.02 (0.64-1.63) |
0.945 |
Female |
45 |
1 (Ref) |
|
Smoking status |
|||
Smokers |
57 |
2.39 (1.26-4.54) |
0.008 |
Non-smokers |
13 |
1 (Ref) |
|
Stage at presentation |
|||
I |
21 |
0.02 (0.01-0.08) |
<.001 |
II |
6 |
0.03 (0.01-0.14) |
<.001 |
III |
7 |
0.06 (0.01-0.24) |
<.001 |
IV |
15 |
1 (Ref) |
|
Bcl-2 Cytoplasm Intensity |
75 |
1.30 (1.03-1.63) |
0.026 |
Bcl-2 Cytoplasm Score |
75 |
1.24 (0.99-1.56) |
0.056 |
Mcl-1 Cytoplasm Intensity |
75 |
1.12 (0.88-1.42) |
0.353 |
Mcl-1 Cytoplasm Score |
75 |
1.14 (0.91-1.44) |
0.258 |
P-Bcl-2 Nuclear Intensity |
76 |
1.41 (1.10-1.81) |
0.007 |
P-Bcl-2 Nuclear Score |
76 |
1.45 (1.13-1.85) |
0.004 |
P-Bcl-2 Cytoplasm Intensity |
76 |
1.30 (1.01-1.67) |
0.038 |
P-Bcl-2 Cytoplasm Score |
76 |
1.32 (1.03-1.68) |
0.027 |
P-Mcl1 Nuclear Intensity |
74 |
1.07 (0.84-1.38) |
0.575 |
P-Mcl1 Nuclear Score |
74 |
1.10 (0.87-1.38) |
0.433 |
P-Mcl1 Cytoplasm Intensity |
74 |
1.08 (0.84-1.39) |
0.560 |
P-Mcl1 Cytoplasm Score |
74 |
1.31 (1.02-1.68) |
0.036 |
* Overall p-value < .001.
Table 6: Univariate analysis of overall survival
Variable |
N |
Hazard Ratio (95% CI) |
P-value |
|---|---|---|---|
Tumor Histology * |
|||
Carcinoid |
16 |
0.44 (0.17-1.14) |
0.090 |
SCLC |
39 |
2.41 (1.22-4.77) |
0.011 |
LCNEC |
20 |
1 (Ref) |
|
Ethnicity |
|||
Caucasian |
56 |
1.04 (0.49-2.22) |
0.925 |
Others |
13 |
1 (Ref) |
|
Gender |
|||
Male |
31 |
1.00 (0.58-1.72) |
0.994 |
Female |
44 |
1 (Ref) |
|
Smoking status |
|||
Smokers |
56 |
2.38 (1.06-5.37) |
0.036 |
Non-smokers |
13 |
1 (Ref) |
|
Stage at presentation |
|||
I |
21 |
0.03 (0.01-0.12) |
<.001 |
II |
6 |
0.05 (0.01-0.21) |
<.001 |
III |
7 |
0.08 (0.02-0.31) |
<.001 |
IV |
14 |
1 (Ref) |
|
Bcl-2 Cytoplasm Intensity |
74 |
1.22 (0.94-1.59) |
0.131 |
Bcl-2 Cytoplasm Score |
74 |
1.24 (0.97-1.60) |
0.089 |
Mcl-1 Cytoplasm Intensity |
74 |
1.07 (0.82-1.40) |
0.613 |
Mcl-1 Cytoplasm Score |
74 |
1.08 (0.83-1.41) |
0.564 |
P-Bcl-2 Nuclear Intensity |
75 |
1.26 (0.95-1.68) |
0.108 |
P-Bcl-2 Nuclear Score |
75 |
1.32 (0.99-1.75) |
0.054 |
P-Bcl-2 Cytoplasm Intensity |
75 |
1.43 (1.07-1.92) |
0.016 |
P-Bcl-2 Cytoplasm Score |
75 |
1.38 (1.04-1.82) |
0.026 |
P-Mcl1 Nuclear Intensity |
73 |
1.16 (0.87-1.54) |
0.316 |
P-Mcl1 Nuclear Score |
73 |
1.38 (0.75-2.55) |
0.296 |
P-Mcl1 Cytoplasm Intensity |
73 |
0.97 (0.73-1.29) |
0.846 |
P-Mcl1 Cytoplasm Score |
73 |
1.06 (0.8-1.4) |
0.704 |
* Overall p-value < .001.
Table 7A: Multivariable analysis of progression free survival with P-Bcl-2 Nuclear Intensity
Variable |
Hazard Ratio (95% CI) |
P-value |
|---|---|---|
P-Bcl-2 Nuclear Intensity |
1.54 (1.08-2.20) |
0.016 |
Ethnicity |
||
Caucasian |
0.37 (0.14-0.96) |
0.041 |
Others |
1 (Ref) |
|
Smoking status |
||
Smokers |
2.21 (0.94-5.22) |
0.069 |
Non-smokers |
1 (Ref) |
|
Stage at presentation * |
||
I |
0.02 (0.01-0.09) |
<.001 |
II |
0.03 (0.01-0.14) |
<.001 |
III |
0.05 (0.01-0.21) |
<.001 |
IV |
1 (Ref) |
|
* Overall p-value < .001.
Table 7B: Multivariable analysis of progression free survival with P-Bcl-2 Nuclear Score
Variable |
Hazard Ratio (95% CI) |
P-value |
|---|---|---|
P-Bcl-2 Nuclear Score |
1.41 (0.99-2.02) |
0.058 |
Stage at presentation * |
||
I |
0.03 (0.01-0.10) |
<.001 |
II |
0.03 (0.01-0.15) |
<.001 |
III |
0.06 (0.01-0.23) |
<.001 |
IV |
1 (Ref) |
|
* Overall p-value < .001.
DISCUSSION
We characterized the expression and prognostic impact of the Bcl-2 family of prosurvival proteins in neuroendocrine lung neoplasms. We observed differential expression of Bcl-2 and pBcl-2 but not Mcl-1 in the cases under study. More importantly, we observed that the phosphorylated activated form of Bcl-2 showed stronger association with patient outcome whereby higher expression correlated with increased risk of disease progression and death. Some prior works showed that Bcl-2 is frequently overexpressed in SCLC leading to attempts to target this protein as a therapeutic strategy [7-12]. However, results of clinical trials targeting Bcl-2 have seen modest efficacy and challenged the relevance of Bcl-2 in SCLC biology [13-15]. Similar attempts are currently afoot targeting Mcl-1, another antiapoptotic member of the Bcl-2 family of proteins [19]. A better understanding of the role of Bcl-2 family of proteins, especially, elucidation of how best to select patients and which family member to target for optimal clinical efficacy will be critical to further clinical development of the therapeutic strategy targeting the Bcl-2 family of proteins in SCLC.
The biologically active phosphorylated form of the Bcl-2 family of proteins is important for normal physiologic role and for the cancer promoting pathologic activity of these proteins [16]. Furthermore, the overall impact of aberrant function depends on the cooperative and antagonistic interaction between different family members [16]. However, there has not been any systematic attempt to characterize the active and biologically relevant forms of Bcl-2 and the other prosurvival member of the family, Mcl-1 in SCLC to date. We therefore employed the full spectrum of benign and malignant pulmonary neuroendocrine tumors to evaluate potential differences in expression of activated Bcl2 and Mcl-1. Consistent with previously published works, we observed increased expression of Bcl-2 in malignant neuroendocrine tumors of the lung compared to the more benign histologies of TC and AC. More importantly, however, we noted that the pBcl-2 showed a stronger association with survival. Contrarily, Mcl-1 and its phosphorylated form, pMcl-1 showed no significant difference in their levels of expression across the spectrum of benign and malignant neuroendocrine tumors. Furthermore, there was no prognostic impact of Mcl-1 or pMcl-1 on PFS or OS. Although there is significant association of pBcl2 with PFS and stage, this did not translate into significant differences in OS. This discordance may be explained partly by the fact that pBcl2 is only of many biological and clinical factors impacting patient’s outcome. Our findings are consistent with other studies looking at Bcl2 expression in pulmonary neuroendocrine tumors where Bcl2 expression is higher in malignant subtypes of neuroendocrine tumors [12, 20, 21]. Moreover, advanced tumors that overexpress pBcl2 are also more likely to harbor other molecular alterations such that pBcl2 expression alone becomes less of a dominant driver of overall survival or tumor progression [22-25]. Thusly, the altered tumor biology induced by increased expression of pBcl2 in association with advanced tumor stage and smoking may be obscured by other clinical characteristics and therapeutic interventions, which we are unable to control for in a retrospective study of this type. While findings from a small retrospective study such as ours are mostly hypothesis generating, taken together, however, our findings support a biologically meaningful role for Bcl-2 in SCLC. In particular, the activated pBcl-2 expression may serve as a better tool for future prospective studies interrogating Bcl-2 role in tumor behavior and response to treatment.
The high expression of pBcl-2 was associated with other indicators of poor prognosis such as positive history of tobacco use and later stage at diagnosis, worsened PFS and poor OS. Identifying the biologic relevance of pBcl-2 expression in SCLC can help guide the development of a more targeted therapy. Similarly, there was higher pBcl2 expression in the more malignant subtypes compared to the relatively benign carcinoid. This observation is consistent with prior works showing increased rate of proliferation marker Ki-67 in small and large cell neuroendocrine carcinoma and atypical carcinoid compared to typical carcinoid [12, 20]. While benign carcinoids are genetically inert, there is increased genomic instability with the more malignant neuroendocrine tumors leading to a high frequency of mutations in TP53, deletions of 3p and 17p [21-25]. We hypothesize that this genomic perturbation probably drives the increased expression of pBcl2, which mediates the prosurvival adaptation that frequently accompanies and balances the increased proliferation noted with malignant transformation. The intriguing observation that pBcl-2 but not pMcl1showed significant correlation with smoking status may be explained by the fact that NNK, a key component of tobacco smoke, specifically promotes Bcl2 phosphorylation (PMID: 15210690; 11768610) and its interaction with other oncogenes like c-Myc and is one of the mechanisms underlying tobacco-induced carcinogenesis [26, 27].
Several weaknesses inherent in our study limit the potential impact of our findings. These include the retrospective nature of the study, which can confound our ability to verify the clinical and outcome data retrieved from the patient’s electronic record. Secondly, phosphorylated epitopes of proteins are known to be labile and susceptible to degrade following prolonged storage. Future studies using frozen samples will strengthen our results and enable further generalization of our results. In conclusion, we observed increased expression of pBcl2 but not pMcl-1 in SCLC. Our findings provide further evidence for altered Bcl-2 signaling pathway as a biologically relevant alteration in SCLC. These findings support currently ongoing strategy to identify the optimal approach to effectively target Bcl-2 as a therapeutic intervention in SCLC.
MATERIALS AND METHODS
Patients and tumor samples
Archival tissue samples of pulmonary carcinoid (both AC and TC), SCLC and LCNEC were employed for this analysis. Tissue samples obtained from lung excisional biopsy, wedge resection, segmentectomy, and partial or complete lobectomy performed between 1989 and 2010 at Emory University Hospital were retrieved from the pathology archives. The study was conducted under an IRB approved protocol and a waiver of informed consent was granted due to the retrospective nature of the study. Of note, some of the samples came from patients who previously consented to future use of their tissue samples for research as part of our standard tissue banking procedure. There was no direct patient contact during this study since the tissue samples used were archival.
Demographic data (age, ethnicity, gender, smoking status, stage at diagnosis, and survival) were retrieved from electronic medical records and online death registry. Date of death was obtained using electronic medical records and United States Social Security Death Index database.
Immunohistochemistry
Nuclear and cytoplasmic protein content was determined by immunohistochemistry (IHC) using monoclonal antibodies specific for total Bcl-2, Mcl-1, phosphorylated Bcl-2 (pBcl-2), and phosphorylated Mcl-1 (pMcl-1). IHC was performed to assess expression of proteins of interest using previously published protocols and manufacturers’ recommendations for antigen retrieval and antibody dilution along with positive and negative controls. Briefly, 5 micron thick sections were employed for IHC staining. Antigen retrieval steps proceeded in a Decloaking Chamber™ (Biocare Medical; Concord, CA 94520 USA) using DAKO Target Retrieval Solution pH6 for Mcl-1 and Bcl-2 or Trilogy™ EDTA (Cell Marque; Rocklin, CA, USA) at pH 8 for p-Mcl1 and pBcl-2. Primary antibodies were incubated for 40 minutes (Mcl-1, Bcl-2, pBcl-2) to 45 minutes (pMcl1). The following primary antibodies were employed: Mcl-1 (S-19) rabbit polyclonal antibody (Santa Cruz Biotechnology, Inc. Dallas, TX U.S.A.Cat#SC-819) at 1:100 dilution; Phospho-Mcl-1 (Ser159/Thr163) rabbit monoclonal antibody (Cell Signaling, Danvers MA Cat#4579) at 1:100 dilution; Bcl-2 (N-19) polyclonal antibody (Santa Cruz Biotechnology, Inc. Dallas, TX U.S.A.Cat#SC-492) at 1:150 dilution; phospho-Bcl-2 (Ser70) (5H2) rabbit monoclonal antibody (Cell Signaling, Danvers MA Cat#2827) at 1:100 dilution. Slides were exposed to secondary antibody for 30minutes using EnVisionTM+ Dual Link System-HRP (Dako North America, Inc. Carpinteria, CA 93013, USA). Two investigators assessed protein expression jointly by light microscopy. The degree of expression of each protein of interest was assessed by location (nuclear and cytoplasmic), intensity (0 ~, 1+, 2+, 3+) and percentage of cell staining in line with published algorithm.(24) A derivative score (immunoscore) ranging between 0 and 300 was calculated as the product of intensity and percent cell staining.
Statistics
Data are presented as frequency (percentage, %) for categorical variables and mean (± standard deviation, SD) or median (range) for continuous variables. The primary outcomes were progression-free survival (PFS) defined as the time from diagnosis to date of progression or death and overall survival (OS) defined as the time from diagnosis to date of death. Patients who did not experience events were censored on February 1, 2012. Univariate associations between variables were examined with Wilcoxon rank-sum test, Kruskal-Wallis test or Spearman rank correlation, where appropriate. A Cox proportional hazards regression model [28] was employed in univariate and multivariable analyses to identify variables that predict PFS and OS. Multivariable analysis was carried out by entering biomarker expression, as measured by the intensity and immunoscore, tumor histology, ethnicity, gender, smoking status, stage at presentation and age in the model and using a backward variable selection method with an alpha=0.1 removal criteria. The proportional hazards assumption was evaluated with Schoenfeld residuals [29] and a Kolmogorov-type supremum test. Hazard ratios (HRs) were expressed per 1-SD increment in continuous variables. Analyses were performed using SAS 9.3 (SAS Institute, Inc., Cary, North Carolina) with two-sided tests and a significant level of 0.05.
FUNDING
Supported in part by NIH/NCI 5K23CA164015 grant award (PI: TK Owonikoko) and award number NIH/NCI P30CA138292 (PI: WJ Curran, Jr.) in support of the Biostatistics and Bioinformatics Shared resource of Winship Cancer Institute of Emory University. The content is solely the responsibility of the authors and does not necessarily represent the official views of the National Institutes of Health.
CONFLICTS OF INTEREST
No relevant conflict of interest to disclose
REFERENCES
1. Shoemaker AR, Mitten MJ, Adickes J, Ackler S, Refici M, Ferguson D, Oleksijew A, O’Connor JM, Wang B, Frost DJ, Bauch J, Marsh K, Tahir SK, Yang X, Tse C, Fesik SW, et al. Activity of the Bcl-2 family inhibitor ABT-263 in a panel of small cell lung cancer xenograft models. Clinical cancer research. 2008; 14:3268-3277.
2. Christodoulou C and Skarlos DV. Treatment of small cell lung cancer. Semin Respir Crit Care Med. 2005; 26:333-341.
3. Pillai RN and Owonikoko TK. Small cell lung cancer: therapies and targets. Seminars in oncology. 2014; 41:133-142.
4. Rudin CM, Durinck S, Stawiski EW, Poirier JT, Modrusan Z, Shames DS, Bergbower EA, Guan Y, Shin J, Guillory J, Rivers CS, Foo CK, Bhatt D, Stinson J, Gnad F, Haverty PM, et al. Comprehensive genomic analysis identifies SOX2 as a frequently amplified gene in small-cell lung cancer. Nature genetics. 2012; 44:1111-1116.
5. Peifer M, Fernandez-Cuesta L, Sos ML, George J, Seidel D, Kasper LH, Plenker D, Leenders F, Sun R, Zander T, Menon R, Koker M, Dahmen I, Muller C, Di Cerbo V, Schildhaus HU, et al. Integrative genome analyses identify key somatic driver mutations of small-cell lung cancer. Nature genetics. 2012; 44:1104-1110.
6. George J, Lim JS, Jang SJ, Cun Y, Ozretic L, Kong G, Leenders F, Lu X, Fernandez-Cuesta L, Bosco G, Muller C, Dahmen I, Jahchan NS, Park KS, Yang D, Karnezis AN, et al. Comprehensive genomic profiles of small cell lung cancer. Nature. 2015; 524:47-53.
7. Paik KH, Park YH, Ryoo BY, Yang SH, Lee JC, Kim CH, Ki SS, Kim JM, Park MJ, Ahn HJ, Choi W and Chung JH. Prognostic value of immunohistochemical staining of p53, bcl-2, and Ki-67 in small cell lung cancer. J Korean Med Sci. 2006; 21:35-39.
8. Ilievska Poposka B, Smickova S, Jovanovska Crvenkovska S, Zafirovska Ivanovska B, Stefanovski T and Petrusevska G. Bcl-2 as a prognostic factor for survival in small-cell lung cancer. Prilozi. 2008; 29:281-293.
9. Jiang SX, Kameya T, Sato Y, Yanase N, Yoshimura H and Kodama T. Bcl-2 protein expression in lung cancer and close correlation with neuroendocrine differentiation. Am J Pathol. 1996; 148:837-846.
10. Pal’tsev MA, Demura SA, Kogan EA, Jaques G and Zende B. Role of Bcl-2, Bax, and Bak in spontaneous apoptosis and proliferation in neuroendocrine lung tumors: immunohistochemical study. Bull Exp Biol Med. 2000; 130:697-700.
11. Jiang SX, Sato Y, Kuwao S and Kameya T. Expression of bcl-2 oncogene protein is prevalent in small cell lung carcinomas. The Journal of pathology. 1995; 177:135-138.
12. Brambilla E, Negoescu A, Gazzeri S, Lantuejoul S, Moro D, Brambilla C and Coll JL. Apoptosis-related factors p53, Bcl2, and Bax in neuroendocrine lung tumors. Am J Pathol. 1996; 149:1941-1952.
13. Rudin CM, Hann CL, Garon EB, Ribeiro de Oliveira M, Bonomi PD, Camidge DR, Chu Q, Giaccone G, Khaira D, Ramalingam SS, Ranson MR, Dive C, McKeegan EM, Chyla BJ, Dowell BL, Chakravartty A, et al. Phase II study of single-agent navitoclax (ABT-263) and biomarker correlates in patients with relapsed small cell lung cancer. Clinical cancer research. 2012; 18:3163-3169.
14. Gandhi L, Camidge DR, Ribeiro de Oliveira M, Bonomi P, Gandara D, Khaira D, Hann CL, McKeegan EM, Litvinovich E, Hemken PM, Dive C, Enschede SH, Nolan C, Chiu YL, Busman T, Xiong H, et al. Phase I study of Navitoclax (ABT-263), a novel Bcl-2 family inhibitor, in patients with small-cell lung cancer and other solid tumors. J Clin Oncol. 2011; 29:909-916.
15. Dean EJ, Cummings J, Roulston A, Berger M, Ranson M, Blackhall F and Dive C. Optimization of circulating biomarkers of obatoclax-induced cell death in patients with small cell lung cancer. Neoplasia. 2011; 13:339-347.
16. Gajewski TF and Thompson CB. Apoptosis meets signal transduction: elimination of a BAD influence. Cell. 1996; 87:589-592.
17. Yecies D, Carlson NE, Deng J and Letai A. Acquired resistance to ABT-737 in lymphoma cells that up-regulate MCL-1 and BFL-1. Blood. 2010; 115:3304-3313.
18. Tahir SK, Yang X, Anderson MG, Morgan-Lappe SE, Sarthy AV, Chen J, Warner RB, Ng SC, Fesik SW, Elmore SW, Rosenberg SH and Tse C. Influence of Bcl-2 family members on the cellular response of small-cell lung cancer cell lines to ABT-737. Cancer research. 2007; 67:1176-1183.
19. Leverson JD, Zhang H, Chen J, Tahir SK, Phillips DC, Xue J, Nimmer P, Jin S, Smith M, Xiao Y, Kovar P, Tanaka A, Bruncko M, Sheppard GS, Wang L, Gierke S, et al. Potent and selective small-molecule MCL-1 inhibitors demonstrate on-target cancer cell killing activity as single agents and in combination with ABT-263 (navitoclax). Cell Death Dis. 2015; 6:e1590.
20. Laitinen KL, Soini Y, Mattila J and Paakko P. Atypical bronchopulmonary carcinoids show a tendency toward increased apoptotic and proliferative activity. Cancer. 2000; 88:1590-1598.
21. Naranjo Gomez JM, Bernal JF, Arranz PG, Fernandez SL and Roman JJ. Alterations in the expression of p53, KLF4, and p21 in neuroendocrine lung tumors. Arch Pathol Lab Med. 2014; 138:936-942.
22. Swarts DR, Ramaekers FC and Speel EJ. Molecular and cellular biology of neuroendocrine lung tumors: evidence for separate biological entities. Biochim Biophys Acta. 2012; 1826:255-271.
23. Vollbrecht C, Werner R, Walter RF, Christoph DC, Heukamp LC, Peifer M, Hirsch B, Burbat L, Mairinger T, Kurt Werner S, Wohlschlaeger J and Mairinger FD. Mutational analysis of pulmonary tumours with neuroendocrine features using targeted massive parallel sequencing: a comparison of a neglected tumour group. British journal of cancer. 2015; 113:1704-1711.
24. Onuki N, Wistuba, II, Travis WD, Virmani AK, Yashima K, Brambilla E, Hasleton P and Gazdar AF. Genetic changes in the spectrum of neuroendocrine lung tumors. Cancer. 1999; 85:600-607.
25. Wistuba, II, Gazdar AF and Minna JD. Molecular genetics of small cell lung carcinoma. Seminars in oncology. 2001; 28:3-13.
26. Jin Z, Gao F, Flagg T and Deng X. Tobacco-specific nitrosamine 4-(methylnitrosamino)-1-(3-pyridyl)-1-butanone promotes functional cooperation of Bcl2 and c-Myc through phosphorylation in regulating cell survival and proliferation. The Journal of biological chemistry. 2004; 279:40209-40219.
27. Jull BA, Plummer HK, 3rd and Schuller HM. Nicotinic receptor-mediated activation by the tobacco-specific nitrosamine NNK of a Raf-1/MAP kinase pathway, resulting in phosphorylation of c-myc in human small cell lung carcinoma cells and pulmonary neuroendocrine cells. Journal of cancer research and clinical oncology. 2001; 127:707-717.
28. Cox DR. Regression Models and Life Tables. J Royal Stat Society. 1972; B34: 187-220.
29. Wileyto EP, Li Y, Chen J and Heitjan DF. Assessing the fit of parametric cure models. Biostatistics. 2013; 14:340-350.