
INTRODUCTION
Epithelial ovarian cancer (EOC) is a serious medical problem, with more than 100,000 women dying per year in western countries [1]. The relatively asymptomatic nature of ovarian cancer and the lack of adequate screening tests result in 75% of patients being diagnosed at late FIGO stages (III and IV). Standard treatment involves cytoreductive surgery followed by chemotherapy. Taxol and platinum compounds are the standard adjuvant therapy in EOC and have greatly improved overall survival (OS) with 70% of patients achieving complete remission after first-line platinum-based therapy. Unfortunately, almost all patients relapse with a resistant disease. Tumors are clinically classified as responsive or not to a platinum (DDP)-based therapy depending on the time to relapse from the end of adjuvant therapy. Specifically, they are classified as refractory if progressing during treatment, resistant if relapsing within twelve months, and sensitive if relapsing after twelve months [2]. This classification is important as it dictates the subsequent chemotherapy. Understanding the molecular mechanisms of the sensitivity or resistance to DDP will help in tailoring ovarian cancer treatment, and possibly to improve the prognosis. The molecular mechanisms of resistance to a DDP-based therapy are multifactorial, and include mechanisms interfering with drug transport, with the repair of the DDP-induced DNA damage, with DDP-induced signalling to the apoptotic machinery, up- and down-regulated expression of miRNAs, and others [3]. Both the activation of the epithelial-mesenchymal transition (EMT) pathway and the existence of cancer stem cells (CSCs) have been advocated as possible mechanisms of relapse in different tumor types, including ovarian carcinomas [4–5]. However, most of these data come from cell cultures assays, and few studies are based on paired primary and recurrent epithelial ovarian cancer samples [4–10]. More appropriate in vivo models are needed to recapitulate the primary and secondary/acquired DDP resistance in ovarian cancer patients.
We recently characterized a panel of patient-derived xenografts (PDXs) from fresh ovarian tumor samples transplanted in nude mice [11]. These PDXs well reproduce the biological behaviour of the disease, including the heterogeneous response to a platinum-based therapy. Here we describe an experimental setting in which ovarian PDX-bearing mice were treated with one cycle of cisplatinum (cDDP), consisting of the drug given once a week for three weeks. Then, the regrowing tumors were re-challenged with a second cycle of treatment. These experiments clearly demonstrate not only that cDDP has a wide range of efficacy, as already reported, but that tumors regrowing after one cDDP treatment are less sensitive to a second cycle. In this experimental setting, we investigated the role of genes involved in EMT and stemness pathways in the response to cDDP.
RESULTS
Response of serous/endometrioid ovarian carcinoma xenografts to cDDP
We selected seven high grade serous/endometrioid ovarian PDXs (Table 1) of our recently established ovarian xenobank [11]. The characteristics of the patients from whom the xenografts were derived are summarized in Supplementary Table 1. We focused on these two high grade tumor histotypes as they represent the majority of ovarian carcinomas, and have similar clinical courses and responses to therapy. Of note, the two endometrioid PDXs were obtained from relapsing patients, likely with a more aggressive phenotype. These xenografts were challenged for the response to cDDP. A first cycle of cDDP was given by intravenous injection once a week for three weeks at the dose of 5 mg/kg. As depicted in Table 1 and Figure 1 different responses to cDDP treatment were observed. Xenografts #212 and #230 were extremely sensitive to cDDP treatment (T/C% values of 0.9% and 1.2%, respectively), showing not only tumor regressions, but also cures with 6 out of 9, and 6 out of 8 mice cured, respectively. These PDXs were classified as Very Responsive (VR) (Table 1). Xenografts #124, #218 and #239 were classified as Responsive (R) to cDDP with T/C% values of 3.8%, 10.3%, and 14.2%. In particular, these tumors underwent regressions after the first cycle of cDDP, but eventually they all re-start to grow. Xenografts #154 and #258 were less responsive to cDDP, with T/C% of 38.5% and 36.5%, with no sign of regression following cDDP treatment. They were classified as Low Responsive (LR). The different responses to cDDP did not seem to be dependent on tumor growth, as VR and LR xenografts had similar growth rates (Supplementary Figure 1).
Table 1: cDDP activity in ovarian PDXs
|
cDDP Response |
||
|---|---|---|---|
ID |
Histotype |
T/C% (day) |
Xenograft classification |
#212 |
serous/endometrioid |
0.9 (108) |
VR |
#230 |
endometrioid |
1.2 (105) |
VR |
#124 |
serous/endometrioid |
3.8 (51) |
R |
#218 |
endometrioid |
10.3 (53) |
R |
#239 |
serous |
14.2 (49) |
R |
#154 |
endometrioid |
38.5 (67) |
LR |
#258 |
serous |
36.5 (133) |
LR |
VR: Very Responsive; R: Responsive; LR: Low Responsive.
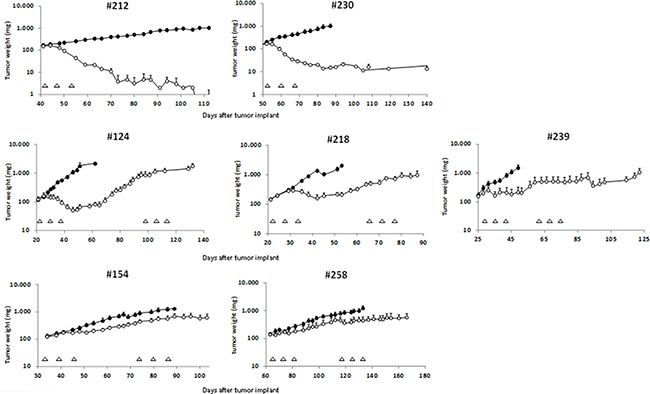
Figure 1: Tumor growth inhibition after cDDP treatment in ovarian PDXs. The different xenografts were subcutaneously transplanted in nude mice and when tumor masses reached the weight of 120 mg, mice were randomized to receive vehicle or cDDP as specified on Materials and Methods. Graphs represent the tumor growth curves of each ovarian PDX treated (-◦-) or not (-●-) with cDDP. Data are the mean ± standard error of the tumor weight (mg) of each experimental group at different time points after tumor transplant. Each triangle indicates a cDDP treatment (one cycle consisting of three weekly treatment), and each group consisted of 8–10 mice.
When a second cycle of cDDP was given to the tumors regrowing after the first cycle, the antitumor activity was lower, especially in R xenografts. In order to evaluate the response to the second cDDP treatment, the slopes of the interpolation lines of the tumor growth curves were considered. Indeed, the calculation of the T/C% was not possible as most of the mice belonging to the control group was already dead by the time of the second cDDP cycle. Figure 2 reports the values of the different slopes obtained in untreated and cDDP-treated tumors (after the first and the second cycle). In particular, after the first cycle VR and R tumors (#212, #230, #124, #218, and #239) showed regressions, as suggested by the negative values of tumor growth slopes. On the other hand, positive slopes were observed in R xenografts #124, #218, and #239 after the second cDDP cycle, indicating a lower drug response. In LR xenografts (#154, #258) slopes were no statistically different in control-untreated and treated with one or two cDDP cycles.
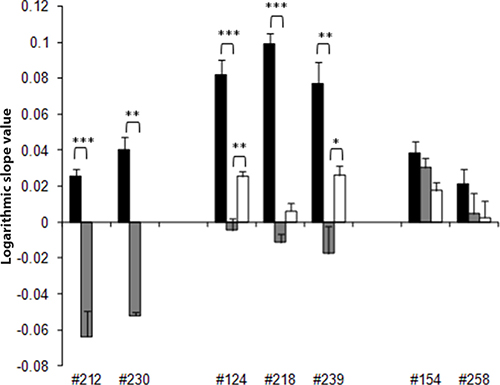
Figure 2: Quantification of cDDP antitumor effect in the different ovarian cancer PDXs. The calculation of T/C% to quantify the effect of the second cycle of cDDP was not possible, as untreated control mice were already sacrificed, and we calculated the slopes of the interpolation line in all the different experimental groups as specified in Materials and Methods. The histograms represent the mean ± standard error of the slope of the interpolation lines in untreated/control and cDDP-treated groups (■-CTR, ■-1st cDDP cycle, and □-2nd cDDP cycle) in ovarian cancer xenografts (MNHOC212, MNHOC230, MNHOC124, MNHOC218, MNHOC239, MNHOC154 and MNHOC258). *p < 0.05, **p < 0.005, ***p < 0.0005.
EMT and CSCs gene expression and response to cDDP
The experimental setting described above, and the different cDDP responses observed in the PDXs prompted us to investigate the role of EMT and CSCs-related genes in the responses to cDDP. The expression of these genes was investigated using high-throughput 384-well plates pre-filled with primers for EMT/CSCs genes in untreated and relapsing cDDP treated-tumors of VR (#212, #230), R (#124, #218, #239) and LR (#154, #258) xenografts. This approach has already been used successfully [12, 13]. All the regrowing-treated tumors were collected after a mean of 33 days after the last cDDP treatment (range 14–45 days), so any short-term effect of drug treatment can be reasonably excluded.
To assess the predictive role of genes involved in these pathways, the LR tumor group was enriched with samples from cDDP-treated relapsing xenografts, as they all were less sensitive to the drug (Figure 2). Five EMT related genes were expressed at higher levels in LR xenografts (Figure 3, panel A). In particular, TCF3 (Transcription Factor 3, p = 0.006) showed an increasing gene expression from VR to LR xenografts, while CAMK2N1 (Calcium/calmodulin-Dependent Protein Kinase II Inhibitor 1, p = 0.03), EGFR (Epithelial Growth Factor, p = 0.0004), IGFBP4 (Insulin-like Growth Factor Binding Protein 4, p = 0.002) and MMP9 (Matrix-Metalloproteinase 9, p = 0.00013) had a lower expression in VR than R and LR tumors. The analysis on CSCs genes showed that 17 genes were differently expressed in LR, R and VR xenografts (data not shown). The genes differentially expressed among VR, R and LR that present the lowest p values were the following: SMO (Smoothened-Frizzled class receptor, p = 8.41E-05), STAT3 (Signal Transducer and Activator of Transcription 3, p = 0.0011), DLL1 (Delta-Like 1, p = 0.0035), and ITGA6 (Integrin, alpha 6, p = 0.0037) (Figure 3, panel B). The expression of these genes was higher in R/LR than in VR. The increased expression of all these genes, except MMP9 (p = 0.2526) was validated using ad hoc-designed primers (Figure 3, panels C and D).
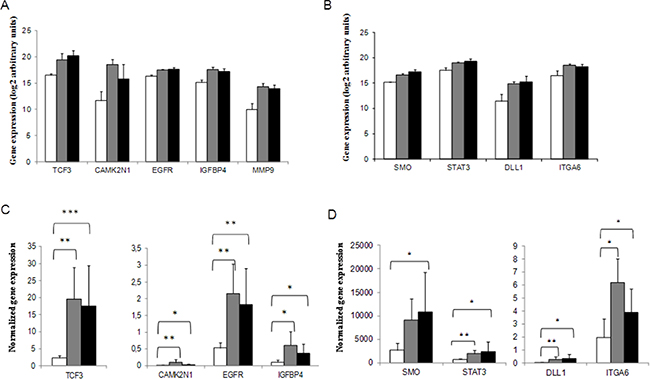
Figure 3: EMT and CSCs related genes differentially expressed in Very Responsive, Responsive and Low Responsive PDXs. EMT (panel A) and CSC-related genes (panel B) found to be predictive of cDDP response. Real-time PCR data were pre-processed using the geometric mean of the available and appropriate housekeeping genes as endogenous control (ACTB, B2M and HPRT1 for EMT plates; ACTB, B2M, GAPDH, HPRT1 and RPLP0 for CSCs plates). Data were expressed as arbitrary base-2 logarithmic units (2-deltaCt) in Very Responsive (□, VR), Responsive (■, R) and Low Responsive (■, LR) xenografts. EMT (panel C) and CSCs genes (panel D) validations by real-time PCR using custom-designed primers. Data are expressed as gene expression values normalized by the expression of housekeeping genes as specified in Materials and Methods. *p < 0.05, **p < 0.005, ***p < 0.0005.
Prognostic value of genes found to be predictive of cDDP response in ovarian cancer patients
Having found that some genes involved in EMT and CSCs pathways were predictive of cDDP response in our experimental system, we looked for correlations between their expression and survival in patients. Data of genome-wide gene expression and survival of high grade ovarian cancer patients were downloaded from the TCGA database. In particular, 261 patients were available for survival analysis. After a median follow-up of 57.6 months (IQR: 21.2–115.9 months), 147 (56.3%) deaths were registered. As reported in Table 2 and showed in Supplementary Figure 2, STAT3 was strongly associated with OS (HR = 13.68; p = 0.013), with higher levels being associated with a lower survival. In addition, the analysis demonstrated that the HR was dependent on time (time interaction p = 0.014). Specifically, the increase of the expression of STAT3 significantly correlated with an increased HR up to the 12 months considered (χ2 = 10.049, p = 0.002 for six months, and χ2 = 9.797, p = 0.002 up to 12 months; Supplementary Table 2). This association was lost when considering the maximum observation period (60 months; χ2 = 1.254, p = 0.263; Supplementary Table 2).
Table 2: Correlation between survival and gene expression in patients from the TCGA dataset
Gene |
Predictor variable |
Term of the Cox model |
HR |
95% CI |
p-value |
|
|---|---|---|---|---|---|---|
STAT3 |
gene |
linear |
13.68 |
1.754 |
106.790 |
0.013 |
gene*log10(time) |
interaction |
0.41 |
0.203 |
0.837 |
0.014 |
|
IGFBP4 |
gene |
linear |
1.16 |
0.98 |
1.38 |
0.085 |
Note: interaction p-value = 0.418 |
||||||
TCF3 |
gene |
linear |
1.05 |
0.82 |
1.35 |
0.692 |
Note: interaction p-value = 0.466 |
||||||
SMO |
gene |
linear |
1.07 |
0.91 |
1.26 |
0.424 |
Note: interaction p-value = 0.511 |
||||||
EGFR |
gene |
linear |
1.04 |
0.90 |
1.21 |
0.580 |
Note: interaction p-value = 0.082 |
||||||
ITGA6 |
gene |
linear |
0.86 |
0.71 |
1.05 |
0.137 |
Note: interaction p-value = 0.990 |
||||||
DLL1 |
gene |
linear |
0.99 |
0.90 |
1.10 |
0.919 |
Note: interaction p-value = 0.967 |
||||||
HR: Hazard Ratio; CI: Confidence Interval.
Expression of EMT and CSCs genes in cDDP-treated/regrowing versus untreated tumors
The expression of EMT and CSCs genes was investigated in cDDP-treated regrowing and in the corresponding untreated xenografts in a comparative pair-wise analysis. The analysis was done only in R xenografts (#124, #218, and #239), as all these models were sensitive to the first cDDP challenge, and after regrowing were much less sensitive to the second one (Figure 2). Figure 4 shows the levels of the differently expressed EMT (MMP9) and CSCs genes (CD44 antigen; DLL4- Delta like 4; FOXP1- Forkhead box P1; MERTK-C mer protocogene tyrosine kinase; PTPRC- Protein tyrosine phosphatase receptor type C, and LIN28B- Lin28 homolog B) (p < 0.05) and the corresponding relative delta values (log2). All the genes, except LIN28B that showed a downregulation, were upregulated in the cDDP-treated relapsing relative to untreated xenografts.
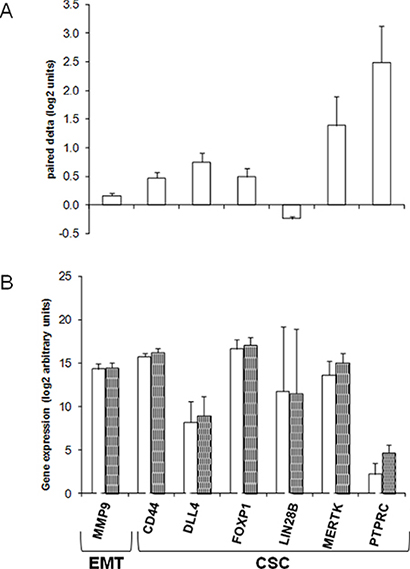
Figure 4: Differently expressed EMT and CSCs genes in cDDP-treated regrowing and control untreated Responsive ovarian cancer PDXs. mRNA was extracted from control and treated tumor xenografts as described in Materials and Methods. (Panel A). Mean ± standard deviation of delta values (log2 units) of gene expression in paired cDDP-treated versus control/untreated xenografts. (Panel B). Mean ± standard deviation of the expression (log2 arbitrary units) in control (CTR, □) and in cDDP-treated (cDDP, ■) tumor xenografts of the genes found to be differentially expressed (paired t-test, p < 0.05) between the two experimental groups. Each group consisted of at least six replicates. All the real-time PCR data were pre-processed using the geometric mean of the available and appropriate housekeeping genes as endogenous control (ACTB, B2M and HPRT1 for EMT plates; ACTB, B2M, GAPDH, HPRT1 and RPLP0 for CSC plates). Data were expressed as arbitrary base-2 logarithmic units (2-deltaCt).
DISCUSSION
Epithelial ovarian cancer is highly responsive to a DDP-based front-line therapy, but in most cases patients relapse with a resistant disease. This work describes a new experimental in vivo setting of high grade serous/endometrioid ovarian PDXs to study the molecular determinants of platinum sensitivity and the development of its resistance. The data herein reported can be summarized as follows: 1) the high grade serous/endometrioid ovarian carcinoma xenografts showed different sensitivity to cDDP, allowing their classification as VR, R and LR; interestingly enough, R xenografts regrowing after one cDDP cycle were much less responsive to a second treatment. Both the different cDDP responses of PDXs and the fact that cDDP-treated regrowing tumors are less responsive to a second cDDP cycle mirror the clinical setting; 2) among the EMT and CSCs-related genes found to be associated to the response to cDDP, STAT3 could be validated in a cohort of ovarian patients; 3) in cDDP-treated regrowing tumors the levels of several genes involved in EMT and stemness were increased; 4) these results were obtained in both high grade serous and endometrioid histotypes suggesting a possible role of EMT and CSCs also in this latter type of tumor.
This experimental setting relies on PDXs recently stabilized in our laboratory [11], and shows how the cDDP activity can be monitored in a longitudinal way within the same cohort of mice bearing ovarian PDXs for a long time (up to 150 days). These models were exploited to better understand the molecular mechanisms of cDDP resistance. Indeed, cDDP responsive PDXs are much less sensitive to a second cDDP cycle, mirroring the clinical setting [2], reinforcing the value of these PDXs for in vivo studies on cDDP resistance. Most data on DDP resistance are based on in vitro cell lines, and very few in vivo results exist on gene modulation in representative ovarian xenografts models [14–16]. Considering that both the EMT and stemness pathways have been variably associated with DDP-resistant relapses in ovarian carcinomas [17, 18], we wondered whether the genes involved in these pathways could help predicting the platinum response in our experimental setting. Unlike other studies whose observation time was short [15], we focused on the expression of these genes in tumors regrowing after two cDDP cycles, a situation that mirrors tumor ovarian relapses in the clinic much better.
Four EMT related genes, TCF3, CAMK2N1, EGFR, and IGFBP4, were significantly more expressed in LR than in R and VR xenografts. The greater expression of TCF3(E2A) and CAMK2N1 might underlie the activation of the Wnt pathway by both the canonical/β-catenin dependent way and the non-canonical one [19]. The over-expression of EGFR was reported to be involved in EMT activation via the Akt/Erk1/2 pathways, inducing Vimentin expression and dowregulation of E-cadherin favoring invasiveness in ovarian cancer cells [20]. On the other hand, the recently suggested role of EGFR in the repair of DNA damage induced by IR and cDDP suggests an increased repair in LR xenografts [21]. IGFBP4 is an important senescence-inducing factor in mesenchymal-stem cells (MCS), reducing cell growth and is associated with a lower DNA-damage response and less nuclear phospho/activated-ERK in senescent than young MSCs [22]. IGFBPs, by recruiting IFG proteins, inhibit their ability to activate their receptor IGFR, and downstream regulators such as PI3K and ERK [23]. We might speculate that the overexpression of IGFBP4 in R and LR xenografts by inducing senescence or breaking the cell cycle in tumor cells might enable them to counteract cDDP activity.
Among the genes involved in stemness whose upregulation inversely correlated with the cDDP response in the xenografts tested, we found those engaged in Hedgehog (i.e. SMO), and Notch (DLL1) pathways. These pathways are also involved in the regulation of the EMT and are reported to be associated with drug resistance in different tumors, including ovarian tumors [24, 25]. Selective inhibition or knockdown of SMO and other Hedgehog downstream effectors (e.g. Gli1) increased cDDP sensitivity in ovarian cancer cell cultures and xenografts [26].
The role of STAT3 in cancer development and drug response has been recently reviewed [27]. Its inhibition has been shown to have antitumor activity, and to reverse the sensitivity to therapy in different cancer types [28–30], including ovarian cancer [31, 32]. Recently, a STAT3 role in DDP resistance and acquisition of stem-like features by STAT3 activation has also been described [33]. We found that STAT3 expression was inversely correlated with cDDP response, and that its low levels predicted an increased overall survival in DDP treated ovarian cancer patients up to 12 months from diagnosis. The predictive value of STAT3 was lost over time, but patients with high STAT3 tumor level might have an higher risk of early relapse and could be treated more extensively.
The role of Notch signaling in the development of platinum and paclitaxel resistance has been reported in ovarian cancer [34, 35]. Despite the negative results of a phase II study of RO4929097, a gamma-secretase inhibitor, as single agent in recurrent-platinum resistant ovarian cancer [36], further studies are warranted to test Notch inhibitors in combination with chemotherapy. The increased expression of ITGA6 we found predictive of cDDP response is in line with the literature as well. ITGA6 expression levels were indeed associated with the presence of cancer stem-like cells [37, 38], as well as with an invasive phenotype, with drug resistance and poor prognosis [39] in a metastatic xenograft model [40]. Scant data exist on its role in predicting DDP response in ovarian cancer [41].
When we looked for genes upregulated in regrowing than “primary” tumors in a comparative pair-wise analysis, we found genes belonging to the extracellular matrix components (i.e. MMP9), to CSCs self-renewal maintenance (i.e. FOXP1), CSCs markers (i.e. CD44, PTPRC), and gene involved in MER-TK signaling pathway; the only downregulated gene was LIN28B. MMP9 mRNA expression was found enhanced in the ascites of chemoresistant ovarian cancer patients [42], and a recent meta-analysis indicated its positive association with poor prognosis in ovarian cancer [43]. FOXP1 expression was an independent risk factor associated with chemotherapy resistance and the prognosis of patients with ovarian cancer [44]. Among the CSC-related genes, to our knowledge no data are available on the role of MERTK in ovarian cancer. However, its over-expression has been associated with tumor progression and therapy response in lung cancer and leukemia [45–47]. We detected increased CD44 expression in treated regrowing xenografts, corroborating its recently reported higher expression in recurrent and metastatic ovarian samples than their primary counterparts [48]. However, even CD44+ cell enrichment has been reported in the majority of ovarian cancer samples after neoadjuvant therapy, no significant association with chemoresistance was reported and a decrease in CD44 expression was associated with shorter survival [49].
The present findings corroborate the utility of ovarian PDXs for studying the molecular determinants of cDDP response. In this experimental setting, mice bearing ovarian PDXs were treated with different rounds of cDDP, and followed in a longitudinal way, mirroring the clinical situation. We found that the expression of some genes is associated with the response to cDDP in both high grade serous and endometrioid tumors, opening the way to test specific target inhibitors to increase cDDP activity in these tumor histotypes. The enrichment of genes involved in the EMT and CSC pathways underscore their importance in cDDP-treated re-growing tumors, although the specific molecular mechanisms at their basis (selection or induction) have still to be defined. The PDXs models we have set up will be instrumental for addressing specific trials of combination therapy to counteract resistance to cDDP based therapy with the final aim of improving the prognosis of ovarian cancer patients.
MATERIALS AND METHODS
Animals
Female NCr-nu/nu mice obtained from ENVIGO RMS srl (Correzzana, Italy) were used when 6–8 weeks old. They were maintained under specific pathogen-free conditions, housed in isolated vented cages, and handled using aseptic procedures. The IRCCS-Istituto di Ricerche Farmacologiche Mario Negri adheres to the principles set out in the following laws, regulations, and policies governing the care and use of laboratory animals: Italian Governing Law (D. lg 26/2014; Authorization n.19/2008-A issued March 6, 2008 by Ministry of Health); Mario Negri Institutional Regulations and Policies providing internal authorization for persons conducting animal experiments (Quality Management System Certificate-UNI EN ISO 9001:2008 – Reg, No.6121); the NIH Guide for the Care and Use of Laboratory Animals (2011 edition) and EU directives and guidelines (EEC Council Direcrive 2010/63/UE). The Statement of Compliance (Assurance) with the Public Health Service (PHS) Policy on Human Care and Use of Laboratory Animals was recently reviewed (9/9/2014) and will expire on September 30, 2019 (Animal Welfare Assurance #A5023-01).
Xenograft models
We have recently characterized and stabilized a xenobank of ovarian carcinoma from fresh tumor samples. As reported, these PDX models recapitulate the tumor from which they derived and maintained these characteristics for multiple passages [11]. From this xenobank we selected seven PDXs: MNHOC124, MNHOC154, MNHOC218, MNHOC212, MNHOC230, MNHOC239, and MNHOC258 (referred to as #124, #154, #218, #212, #230, #239, and #258), whose main characteristics are reported in Supplementary Table 1. Viable tumor fragments (2 × 2 mm) were subcutaneously (s.c.) implanted through trocar needles and mice were randomized when the average tumor size was about 120 mg (8–10 per group, on the basis of pragmatic considerations). Cisplatinum (cDDP, Sigma-Aldrich) was given i.v. at the dose of 5 mg/kg once a week for three times (q7d × 3). The second cDDP cycle treatment was generally given when tumors started to re-growth (when tumor weights were ≥ 3 fold those at randomization), and were in the range of 400–1000 mg. Tumor growth was measured twice a week with a Vernier caliper, and tumor weights (mg = mm3) were calculated as follows: (length [mm] * width [mm]2)/2. The efficacy of the treatment was expressed as best tumor growth inhibition [%T/C = (tumor weight mean of treated tumors/tumor weight mean of control tumors) * 100]. Drug activity was defined as follows: low responsive (LR) with T/C% ≥ 30% and no regression, responsive (R) with 10% < T/C% < 30% with observed regressions followed by tumor re-growth, and very responsive (VR) with T/C% ≤ 10% and with regressions but no tumor re-growth.
The cDDP effect was also quantified extrapolating the slope of the growth curves of the control/untreated and cDDP-treated tumors. The tumor growth curves for each mouse were plotted on a logarithmic scale, and the slope of the interpolation line was calculated; the mean ± standard error of the slopes for each group (control, first cycle and second cycle-treated; these latter slopes were calculated considering the re-growing phase of the tumours after the first cDDP cycle treatment) was calculated and plotted as histograms. Statistical analysis was done by one-way ANOVA test, with GraphPad Prism 3.01 software.
High-throughput gene expression real time assay
Total mRNA was extracted from snap-frozen tissues by using Maxwell 16 LEV SimplyRNA (Promega), according to manufacturer protocols. Control/no treated (CTR) and cDDP-treated re-growing tumors (after the second cDDP cycle) were snap-frozen at the time of sacrifice, when tumor weights were about 400–1000 mg. The RT2 Profiler PCR Arrays (Qiagen) are designed to analyze a panel of genes related to EMT and CSCs. Each array contains a panel of 4X96 primer sets for a thoroughly researched set of 84 genes, plus five housekeeping genes, three mRNA retrotranscription and three PCR quality controls. For each plate two control/no-treated and two cDDP-treated samples of the same xenograft were included, except for MNHOC212 and MNHOC230 for which only control no-treated samples were analyzed. The assay includes a specific step of mRNA retro-transcription, using the RT2 First Strand Kit. The plate was filled by an EP Motion 5075 robot (Eppendorf), so an excess of volume was used. Reactions were done on a 7900HT Sequence Detection System (Applied Biosystems).
Data analysis and validation
Real-time PCR data were pre-processed with DataAssist software (v.2, Life Technologies), using the geometric mean of the available and appropriate housekeeping genes as endogenous control (ACTB, B2M and HPRT1 for EMT plates; ACTB, B2M, GAPDH, HPRT1 and RPLP0 for CSC plates). Data were expressed as arbitrary base-2 logarithmic units (2-deltaCt). Statistical analysis was done with the tMEV suite (http://www.tm4.org [50]) using one-way ANOVA for the genes associated with responsiveness, and a paired t-test for the long-term effects of cDDP on the responsive xenografts. Validation assays were done by real-time PCR with ad-hoc designed primers (Primer3, http://primer3.ut.ee/) only for the analysis of the predictive value of genes, as the different samples run on different plates. Gene expression data were quantified through a calibration curve, and were normalized by gene expression of an housekeeping gene (HPRT1). Statistical analysis was done by t-test, using GraphPad Prism 3.01 software.
Survival analysis
Gene expression (IlluminaHISeq UNC platform) and survival data were collected from The Cancer Genome Atlas (TCGA, http://cancergenome.nih.gov/) in May 2015. Overall Survival (OS) was defined as the time from diagnosis to the time of death from any cause; data was right-censored if a patient was alive at the last follow-up. The hazard ratio (HR) was used as summary statistics correlating gene expression with OS. A linear log10 time-by-gene interaction term was introduced into the Cox regression model to detect a time varying HR. In case of curvature over time of the relative hazard function, the restricted mean to time t * was used as summary statistic correlating gene expression with OS; t * was considered as 6 months (patients relapsing by 6 months are classified as resistant to therapy), 12 months (patients relapsing between 6 and 12 months are classified as responsive to therapy), and 60 months (slightly below the maximum collected follow-up time). Tertiles of gene expression levels were used to plot and describe survival.
ACKNOWLEDGMENTS
Part of the results published here are based on data generated by the TCGA Research Network (http://cancergenome.nih.gov/). We are grateful for the generous contributions of the Italian Association for Cancer Research (IG14536 to G.D.).
FINANCIAL SUPPORT
AIRC (Italian Association for Cancer Research, IG14536 to G. Damia).
F. Ricci is a recipient of a fellowship from the Italian Foundation for Cancer Research (FIRC).
CONFLICTS OF INTEREST
There are no conflicts of interest to disclose.
REFERENCES
1. Siegel R, Naishadham D, Jemal A. Cancer statistics, 2013. CA Cancer J Clin. 2013; 63:11–30.
2. Friedlander M, Trimble E, Tinker A, Alberts D, Avall-Lundqvist E, Brady M, Harter P, Pignata S, Pujade-Lauraine E, Sehouli J, Vergote I, Beale P, Bekkers R, et al. Gynecologic Cancer, Clinical trials in recurrent ovarian cancer. Int J Gynecol Cancer. 2011; 21:771–775.
3. Galluzzi L, Vitale I, Michels J, Brenner C, Szabadkai G, Harel-Bellan A, Castedo M, Kroemer G. Systems biology of cisplatin resistance: past, present and future. Cell Death Dis. 2014; 5:e1257.
4. Buonato JM, Lazzara MJ. ERK1/2 blockade prevents epithelial-mesenchymal transition in lung cancer cells and promotes their sensitivity to EGFR inhibition. Cancer Res. 2014; 74:309–319.
5. Davidson B, Holth A, Hellesylt E, Tan TZ, Huang RY, Trope C, Nesland JM, Thiery JP. The clinical role of epithelial-mesenchymal transition and stem cell markers in advanced-stage ovarian serous carcinoma effusions. Hum Pathol. 2015; 46:1–8.
6. Brabletz T, Jung A, Spaderna S, Hlubek F, Kirchner T. Opinion: migrating cancer stem cells - an integrated concept of malignant tumour progression. Nat Rev Cancer. 2005; 5:744–749.
7. Mani SA, Guo W, Liao MJ, Eaton EN, Ayyanan A, Zhou AY, Brooks M, Reinhard F, Zhang CC, Shipitsin M, Campbell LL, Polyak K, Brisken C, et al. The epithelial-mesenchymal transition generates cells with properties of stem cells. Cell. 2008; 133:704–715.
8. Nuti SV, Mor G, Li P, Yin G. TWIST and ovarian cancer stem cells: implications for chemoresistance and metastasis, Oncotarget. 2014; 5:7260–7271. doi: 10.18632/oncotarget.2428.
9. Ricci F, Bernasconi S, Perego P, Ganzinelli M, Russo G, Bono F, Mangioni C, Fruscio R, Signorelli M, Broggini M, Damia G. Ovarian carcinoma tumor-initiating cells have a mesenchymal phenotype. Cell Cycle. 2012; 11:1966–1976.
10. Tan TZ, Miow QH, Miki Y, Noda T, Mori S, Huang RY, Thiery JP. Epithelial-mesenchymal transition spectrum quantification and its efficacy in deciphering survival and drug responses of cancer patients. EMBO Mol Med. 2014; 6:1279–1293.
11. Ricci F, Bizzaro F, Cesca M, Guffanti F, Ganzinelli M, Decio A, Ghilardi C, Perego P, Fruscio R, Buda A, Milani R, Ostano P, Chiorino G, et al. Patient-derived ovarian tumor xenografts recapitulate human clinicopathology and genetic alterations. Cancer Res. 2014; 74:6980–6990.
12. Yang S, Liu L, Xu P, Yang Z. MKL1 inhibits cell cycle progression through p21 in podocytes. BMC Mol Biol. 2015; 16:1.
13. Zhi X, Lamperska K, Golusinski P, Schork NJ, Luczewski L, Kolenda T, Golusinski W, Masternak MM. Gene expression analysis of head and neck squamous cell carcinoma survival and recurrence. Oncotarget. 2015; 6:547–555. doi: 10.18632/oncotarget.2772.
14. Dobbin ZC, Katre AA, Steg AD, Erickson BK, Shah MM, Alvarez RD, Conner MG, Schneider D, Chen D, Landen CN. Using heterogeneity of the patient-derived xenograft model to identify the chemoresistant population in ovarian cancer. Oncotarget. 2014; 5:8750–8764. doi: 10.18632/oncotarget.2373.
15. Koussounadis A, Langdon SP, Harrison DJ, Smith VA. Chemotherapy-induced dynamic gene expression changes in vivo are prognostic in ovarian cancer. Br J Cancer. 2014; 110:2975–2984.
16. Miow QH, Tan TZ, Ye J, Lau JA, Yokomizo T, Thiery JP, Mori S. Epithelial-mesenchymal status renders differential responses to cisplatin in ovarian cancer. Oncogene. 2015; 34:1899–1907.
17. Marchini S, Fruscio R, Clivio L, Beltrame L, Porcu L, Fuso Nerini I, Cavalieri D, Chiorino G, Cattoretti G, Mangioni C, Milani R, Torri V, Romualdi C, et al. Resistance to platinum-based chemotherapy is associated with epithelial to mesenchymal transition in epithelial ovarian cancer. Eur J Cancer. 2013; 49:520–530.
18. Takai M, Terai Y, Kawaguchi H, Ashihara K, Fujiwara S, Tanaka T, Tsunetoh S, Tanaka Y, Sasaki H, Kanemura M, Tanabe A, Ohmichi M. The EMT (epithelial-mesenchymal-transition)-related protein expression indicates the metastatic status and prognosis in patients with ovarian cancer. J Ovarian Res. 2014; 7:76.
19. Arend RC, Londono-Joshi AI, Straughn JM Jr, Buchsbaum DJ. The Wnt/beta-catenin pathway in ovarian cancer: a review. Gynecol Oncol. 2013; 131:772–779.
20. Zhou X, Hu Y, Dai L, Wang Y, Zhou J, Wang W, Di W, Qiu L. MicroRNA-7 inhibits tumor metastasis and reverses epithelial-mesenchymal transition through AKT/ERK1/2 inactivation by targeting EGFR in epithelial ovarian cancer. PLoS One. 2014; 9:e96718.
21. Liccardi G, Hartley JA, Hochhauser D. EGFR nuclear translocation modulates DNA repair following cisplatin and ionizing radiation treatment. Cancer Res. 2011; 71:1103–1114.
22. Severino V, Alessio N, Farina A, Sandomenico A, Cipollaro M, Peluso G, Galderisi U, Chambery A. Insulin-like growth factor binding proteins 4 and 7 released by senescent cells promote premature senescence in mesenchymal stem cells. Cell Death Dis. 2013; 4:e911.
23. Kuilman T, Peeper DS. Senescence-messaging secretome: SMS-ing cellular stress. Nat Rev Cancer. 2009; 9:81–94.
24. McAuliffe SM, Morgan SL, Wyant GA, Tran LT, Muto KW, Chen YS, Chin KT, Partridge JC, Poole BB, Cheng KH, Daggett J Jr, Cullen K, Kantoff E, et al. a key pathway for ovarian cancer stem cells, sensitizes tumors to platinum therapy. Proc Natl Acad Sci U S A. 2012; 109:E2939–2948.
25. McCann CK, Growdon WB, Kulkarni-Datar K, Curley MD, Friel AM, Proctor JL, Sheikh H, Deyneko I, Ferguson JA, Vathipadiekal V, Birrer MJ, Borger DR, Mohapatra G, et al. Inhibition of Hedgehog signaling antagonizes serous ovarian cancer growth in a primary xenograft model. PLoS One. 2011; 6:e28077.
26. Steg AD, Katre AA, Bevis KS, Ziebarth A, Dobbin ZC, Shah MM, Alvarez RD, Landen CN. Smoothened antagonists reverse taxane resistance in ovarian cancer. Mol Cancer Ther. 2012; 11:1587–1597.
27. Tan FH, Putoczki TL, Stylli SS, Luwor RB. The role of STAT3 signaling in mediating tumor resistance to cancer therapy. Curr Drug Targets. 2014; 15:1341–1353.
28. Eiring AM, Page BD, Kraft IL, Mason CC, Vellore NA, Resetca D, Zabriskie MS, Zhang TY, Khorashad JS, Engar AJ, Reynolds KR, Anderson DJ, Senina A, et al. Combined STAT3 and BCR-ABL1 inhibition induces synthetic lethality in therapy-resistant chronic myeloid leukemia. Leukemia. 2015; 29:586–597.
29. Kleppe M, Kwak M, Koppikar P, Riester M, Keller M, Bastian L, Hricik T, Bhagwat N, McKenney AS, Papalexi E, Abdel-Wahab O, Rampal R, Marubayashi S, et al. JAK-STAT pathway activation in malignant and nonmalignant cells contributes to MPN pathogenesis and therapeutic response. Cancer Discov. 2015; 5:316–331.
30. Lee HJ, Zhuang G, Cao Y, Du P, Kim HJ, Settleman J. Drug resistance via feedback activation of Stat3 in oncogene-addicted cancer cells. Cancer Cell. 2014; 26:207–221.
31. Ji T, Gong D, Han Z, Wei X, Yan Y, Ye F, Ding W, Wang J, Xia X, Li F, Hu W, Lu Y, Wang S, et al. Abrogation of constitutive Stat3 activity circumvents cisplatin resistant ovarian cancer. Cancer Lett. 2013; 341:231–239.
32. Tang YJ, Sun ZL, Wu WG, Xing J, He YF, Xin DM, Han P. Inhibitor of signal transducer and activator of transcription 3 (STAT3) suppresses ovarian cancer growth, migration and invasion and enhances the effect of cisplatin in vitro. Genet Mol Res. 2015; 14:2450–2460.
33. Liu WH, Chen MT, Wang ML, Lee YY, Chiou GY, Chien CS, Huang PI, Chen YW, Huang MC, Chiou SH, Shih YH, Ma HI. Cisplatin-selected resistance is associated with increased motility and stem-like properties via activation of STAT3/Snail axis in atypical teratoid/rhabdoid tumor cells. Oncotarget. 2015; 6:1750–1768. doi: 10.18632/oncotarget.2737.
34. Kumar S, Kumar A, Shah PP, Rai SN, Panguluri SK, Kakar SS. MicroRNA signature of cis-platin resistant vs. cis-platin sensitive ovarian cancer cell lines. J Ovarian Res. 2011; 4:17.
35. Rose SL, Kunnimalaiyaan M, Drenzek J, Seiler N. Notch 1 signaling is active in ovarian cancer. Gynecol Oncol. 2010; 117:130–133.
36. Diaz-Padilla I, Wilson MK, Clarke BA, Hirte HW, Welch SA, Mackay HJ, Biagi JJ, Reedijk M, Weberpals JI, Fleming GF, Wang L, Liu G, Zhou C, et al. A phase II study of single-agent RO4929097, a gamma-secretase inhibitor of Notch signaling, in patients with recurrent platinum-resistant epithelial ovarian cancer: A study of the Princess Margaret, Chicago and California phase II consortia. Gynecol Oncol. 2015; 137:216–222.
37. Cariati M, Naderi A, Brown JP, Smalley MJ, Pinder SE, Caldas C, Purushotham AD. Alpha-6 integrin is necessary for the tumourigenicity of a stem cell-like subpopulation within the MCF7 breast cancer cell line. Int J Cancer. 2008; 122:298–304.
38. Corsini NS, Martin-Villalba A. Integrin alpha 6: anchors away for glioma stem cells. Cell Stem Cell. 2010; 6:403–404.
39. Yamakawa N, Kaneda K, Saito Y, Ichihara E, Morishita K. The increased expression of integrin alpha6 (ITGA6) enhances drug resistance in EVI1(high) leukemia. PLoS One. 2012; 7:e30706.
40. Landowski TH, Gard J, Pond E, Pond GD, Nagle RB, Geffre CP, Cress AE. Targeting integrin alpha6 stimulates curative-type bone metastasis lesions in a xenograft model. Mol Cancer Ther. 2014; 13:1558–1566.
41. Aggarwal S, He T, Fitzhugh W, Rosenthal K, Feild B, Heidbrink J, Mesmer D, Ruben SM, Moore PA. Immune modulator CD70 as a potential cisplatin resistance predictive marker in ovarian cancer. Gynecol Oncol. 2009; 115:430–437.
42. Latifi A, Luwor RB, Bilandzic M, Nazaretian S, Stenvers K, Pyman J, Zhu H, Thompson EW, Quinn MA, Findlay JK, Ahmed N. Isolation and characterization of tumor cells from the ascites of ovarian cancer patients: molecular phenotype of chemoresistant ovarian tumors. PLoS One. 2012; 7:e46858.
43. Li LN, Zhou X, Gu Y, Yan J. Prognostic value of MMP-9 in ovarian cancer: a meta-analysis. Asian Pac J Cancer Prev. 2013; 14:4107–4113.
44. Hu Z, Zhu L, Gao J, Cai M, Tan M, Liu J, Lin B. Expression of FOXP1 in epithelial ovarian cancer (EOC) and its correlation with chemotherapy resistance and prognosis. Tumour Biol. 2015; 36:7269–75. doi: 10.1007/s13277-015-3383-5.
45. Cummings CT, Linger RM, Cohen RA, Sather S, Kirkpatrick GD, Davies KD, DeRyckere D, Earp HS, Graham DK. Mer590, a novel monoclonal antibody targeting MER receptor tyrosine kinase, decreases colony formation and increases chemosensitivity in non-small cell lung cancer. Oncotarget. 2014; 5:10434–10445. doi: 10.18632/oncotarget.2142.
46. Linger RM, Lee-Sherick AB, DeRyckere D, Cohen RA, Jacobsen KM, McGranahan A, Brandao LN, Winges A, Sawczyn KK, Liang X, Keating AK, Tan AC, Earp HS, et al. Mer receptor tyrosine kinase is a therapeutic target in pre-B-cell acute lymphoblastic leukemia. Blood. 2013; 122:1599–1609.
47. Xie S, Li Y, Li X, Wang L, Yang N, Wang Y, Wei H. Mer receptor tyrosine kinase is frequently overexpressed in human non-small cell lung cancer, confirming resistance to erlotinib. Oncotarget. 2015; 6:9206–9219. doi: 10.18632/oncotarget.3280.
48. Gao Y, Foster R, Yang X, Feng Y, Shen JK, Mankin HJ, Hornicek FJ, Amiji MM, Duan Z. Up-regulation of CD44 in the development of metastasis, recurrence and drug resistance of ovarian cancer. Oncotarget. 2015; 6:9313–9326. doi: 10.18632/oncotarget.3220.
49. Bonneau C, Rouzier R, Geyl C, Cortez A, Castela M, Lis R, Darai E, Touboul C. Predictive markers of chemoresistance in advanced stages epithelial ovarian carcinoma. Gynecol Oncol. 2015; 136:112–120.
50. Saeed AI, Sharov V, White J, Li J, Liang W, Bhagabati N, Braisted J, Klapa M, Currier T, Thiagarajan M, Sturn A, Snuffin M, Rezantsev A, et al. TM4: a free, open-source system for microarray data management and analysis. Biotechniques. 2003; 34:374–378.