
INTRODUCTION
Hepatocellular carcinoma (HCC), the most common primary liver cancer, is increasing in incidence. It currently represents the fifth most common malignancy worldwide and the third leading cause of cancer-related death [1]. The introduction of sorafenib has positively changed the clinical landscape of the disease despite its limited efficacy and moderate toxicity in a substantial percentage of patients [2-7].
Hypertension (HTN) is frequently associated with the use of angiogenesis inhibitors targeting the vascular endothelial growth factor (VEGF) pathway and appears to be a generalized effect of this class of agent [8-14]. Physiologically, HTN develops when VEGF stimulates the production of nitric oxide and prostacyclins in vascular endothelial cells [15-17], inhibiting vasodilatory mechanisms, increasing peripheral vascular resistance and leading to higher blood pressure (BP). Moreover, vasoconstriction determines a decrease in the glomerular filtration rate and an increase in sodium and water retention by the kidneys, as occurs in pre-eclampsia which has been linked to placental-derived soluble antiangiogenic factors including VEGF [18,19].
The inhibition of VEGFR-2 by sorafenib leads to a decrease in phosphoinositide 3-kinase (PI3K), Akt, endothelium-derived nitric oxide synthase (eNOS) expression and the production of the potent vasodilator nitric oxide [20-22].
Based on these observations, we performed a retrospective analysis to evaluate whether the development of HTN and changes in serum electrolytes in patients with metastatic HCC receiving sorafenib are associated with the antitumor efficacy of the drug.
RESULTS
Patient characteristics
From 1 July 2011 to 25 March 2015, 61 consecutive patients with Child-Pugh A HCC receiving sorafenib were available for our analysis. Fifty-one (84.3%) were males and 10 (15.7%) females, with a median age at diagnosis of 72 years (range 28-87). Median follow-up was 34 months (range 1-45). Seven patients had BCLC-B and 54 had BCLC-C. Twenty (32%) patients had previously undergone transarterial chemo-embolisation (TACE). The most common liver disease etiologies were hepatitis C (50.8%), alcoholic liver disease (10.2%), fatty liver disease (15%) and hepatitis B (15.2%) (Table 1). The dose of sorafenib was reduced in 32 (52%) patients, 9 of whom had grade 3 HTN, 6 grade 3 HTN and grade 2 skin toxicity, 7 grade 2-3 skin toxicity, 5 grade 2-3 asthenia, and 5 grade 2-3 diarrhea. Median PFS was 2.8 months (95% CI 2.5-3.7) and median OS was 8.7 months (95% CI 5.7-13.9).
Table 1: Patient characteristics (n=61)
Variable |
No. (%) |
|---|---|
Median age, years (range) |
72 (28-87) |
Gender |
|
Male |
51 (83.6) |
Female |
10 (16.4) |
ECOG PS |
|
0 |
37 (60.7) |
1 |
24 (39.3) |
Etiology |
|
Hepatitis C |
30 (50.8) |
Hepatitis B |
9 (15.2) |
Alcoholic liver disease |
6 (10.2) |
Metabolic syndrome |
10 (16.9) |
Other |
4 (6.8) |
Missing |
2 |
BCLC Staging |
|
B |
7 (11.5) |
C |
54 (88.5) |
Vascular invasion |
|
No |
14 (40.0) |
Si |
21 (60.0) |
Missing |
26 |
Pretreatment blood pressure |
|
Mean systolic value (SD) |
118.44 (11.82) |
Mean diastolic value (SD) |
76.15 (9.24) |
BCLC, Barcelona Clinic Liver Cancer; SD, standard deviation
Hypertension and clinical outcome
Patients who developed HTN after 15 days of treatment had a median PFS of 6 months (95% CI 3.2-10.1) compared to 2.5 months (95% CI 1.9-2.6) for those who did not (HR=0.24, 95% CI 0.13-0.46, p<0.0001) (Figure 1A). HTN patients had a median OS of 14.6 months (95% CI 9.7-19.0) compared to 3.9 months (95% CI 3.1-8.7) for those in the non HTN group (HR=0.41, 95% CI 0.23-0.74, p=0.003) (Figure 1B). DCR in HTN patients was 63.4% compared to 17.2% in those without HTN (p=0.001) (Table 2).
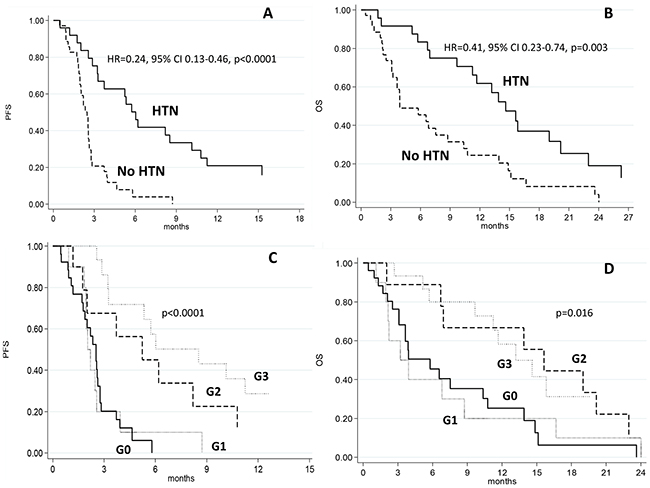
Figure 1: Progression-free and overall survival in patients with or without hypertension (HTN) A, C. and according to the grade of hypertension B, D.
Table 2: Best objective response to sorafenib
All patients (n=61) No. (%) |
No HTN (n=35) No. (%) |
HTN (n=26) No. (%) |
p |
|
|---|---|---|---|---|
CR |
1 (2.0) |
0 |
1 (4.5) |
|
PR |
3 (5.9) |
0 |
3 (13.6) |
|
SD |
15 (29.4) |
5 (17.2) |
10 (45.5) |
|
PD |
32 (62.7) |
24 (82.8) |
8 (36.4) |
|
Missing/NE |
10 |
6 |
4 |
|
DCR (CR+PR+SD) |
19 (37.3) |
5 (17.2) |
14 (63.4) |
0.001 |
HTN, hypertension; CR, complete response; PR, partial response; SD, stable disease; PD, progressive disease; NE, not evaluable; DCR, disease control rate
Figure 2 shows the mean values of SBP and DBP at baseline and on day 15 of the first cycle of sorafenib with respect to objective response. SBP increased significantly from baseline to day 15 of the first cycle of sorafenib, with a mean increase of 31 mm Hg in patients showing an objective response (p=0.003), 22.2 mm Hg in those with SD (p=0.004), and 6.6 mm Hg in PD patients (p=0.022).
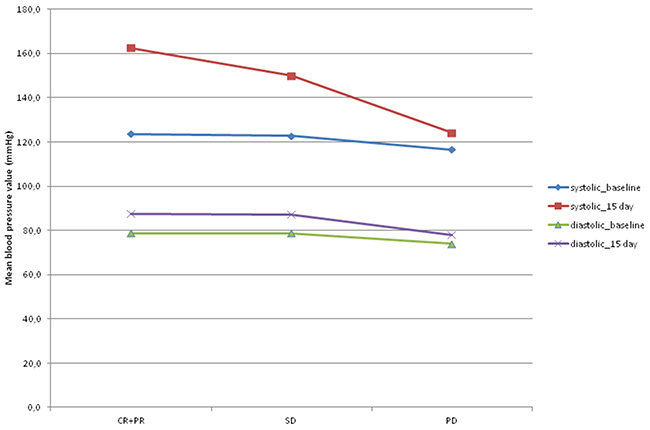
Figure 2: Mean values of systolic and diastolic blood pressure at baseline and on day 15 of the first cycle of sorafenib according to objective response. CR+ PR: complete response plus partial response; SD: stationary disease; PD: progressive disease.
DBP did not change significantly from baseline to day 15 of the first cycle of sorafenib in any group, regardless of objective response. Median PFS was 2.1 months (95% CI 0.9-2.6) in patients with grade 1 HTN, 5.2 months (95% CI 1.2-10.8) in those with grade 2 HTN, and 8.5 months (95% CI 3.2-15.3) (p<0.0001) in the grade 3 HTN group (Table 3 and Figure 1C). Median OS was 3.6 months (95% CI 1.1-8.7) in grade 1 HTN patients, 15.6 months (95% CI 2.0-23.0) in those with grade 2 HTN, and 13.2 months (95% CI 5.7-34.2) (p<0.011) in the grade 3 HTN group (Table 3 and Figure 1D). Comorbidities that could potentially influence BP were similar in the two cohorts.
Table 3: Progression-free and overall survival evaluated according to the hypertension toxicity (grade)
Grade |
No. patients |
No. events |
Median PFS (months) (95% CI) |
p |
HR (95% CI) |
p |
|---|---|---|---|---|---|---|
0 |
26 |
24 |
2.5 (1.8-2.8) |
1.00 |
||
1 |
10 |
10 |
2.1 (0.9-2.6) |
0.88 (0.41-1.87) |
||
2 |
10 |
9 |
5.2 (1.2-10.8) |
0.30 (0.13-0.71) |
||
3 |
15 |
12 |
8.5 (3.2-15.3) |
<0.0001 |
0.16 (0.07-0.37) |
<0.0001 |
Grade |
No. patients |
No. events |
Median OS (months) (95% CI) |
p |
HR (95% CI) |
p |
0 |
26 |
21 |
5.8 (3.1-10.4) |
1.00 |
||
1 |
10 |
10 |
3.6 (1.1-8.7) |
0.96 (0.45-2.08) |
||
2 |
10 |
9 |
15.6 (2.0-23.0) |
0.45 (0.20-1.01) |
||
3 |
15 |
11 |
13.2 (5.7-34.2) |
0.011 |
0.32 (0.14-0.71) |
0.016 |
HZ, hazard ratio
After adjusting for clinical covariates (age, gender, etiology, BCLC stage, ECOG performance status, toxicity, treatment duration and previous TACE), HTN remained an independent prognostic factor for both PFS (HR=0.21, 95% CI 0.09-0.48, p= 0.0002) and OS (HR=0.41, 95% CI 0.17-0.96, p=0.041).
Hypertension and electrolyte changes
Comparing electrolyte values at baseline and on day 15 (Table 4), we observed a reduction in potassium levels (mean 5.7%) and an increase in sodium levels (average 1.6%) that were more marked in DCR patients (defined as responders) than in those with PD. Considering the trend of average electrolyte values of the 2 blood tests, the t-test for paired data showed that the absolute values of sodium on day 15 were generally higher than those at baseline (+2.38, p<0.0001) in DCR patients (+4.95, p<0.0001) compared to the PD group (+0.28, p=0.607). Potassium showed the same trend, with generally lower average values on day 15 than at baseline (-0.30, p=0.0008) in the DCR group (-0.58, p=0.003) than in PD patients (-0.06, p=0.500).
Table 4: Variation in sodium and potassium levels as a function of best objective response to sorafenib
No. patients |
Percentage variation after 15 days |
||
|---|---|---|---|
Median value (IQR) |
Median value (SD) |
||
Sodium |
|||
Overall |
61 |
0 (-3 to 12.3) |
1.6 (2.8) |
DCR |
19 |
3 (0 to 8.2) |
3.3 (2.5) |
PD |
32 |
0 (-3 to 5.1) |
0.25 (1.8) |
p (between DCR and PD) |
<0.00011 |
||
Potassium |
|||
Overall |
61 |
-2 (-41 to 38.13) |
-5.7 (13.4) |
DCR |
19 |
-16 (-37 to 38.20) |
-11.1 (16.0) |
PD |
32 |
0.50 (-41 to 14. 7) |
-1.06 (10.2) |
p (between DCR and PD) |
0.00071 |
||
IQR, interquartile range; DCR, disease control rate; PD, progressive disease; SD, standard deviation
1 Wilcoxon median test
DISCUSSION
In this retrospective study, a correlation emerged between the development of HTN during treatment with sorafenib and survival of advanced HCC patients. Patients with HTN also had a better DCR than those without HTN. Furthermore, we noticed that the higher the BP, especially systolic, the better the response to treatment with sorafenib. Figure 3 shows the hypothetic effect of VEGFR on blood vessel tone in patients (A) without sorafenib-induced HTN and (B) with sorafenib-induced HTN. The activation of VEGFR-2 via phosphoinositide 3-kinase (PI3K) and its downstream serine protein kinase Akt stimulates endothelium-derived nitric oxide synthase (eNOS), produce nitric oxide (NO), a potent vasodilatator. NO also exerts an inhibitory effect on the vasoconstrictor endothelin-1 (ET-1) (panel A). In patients treated with sorafenib, the inhibition of VEGFR-2 is thought to reduce the bioavailability of NO, resulting in vasoconstriction and consequent HTN [24-27].
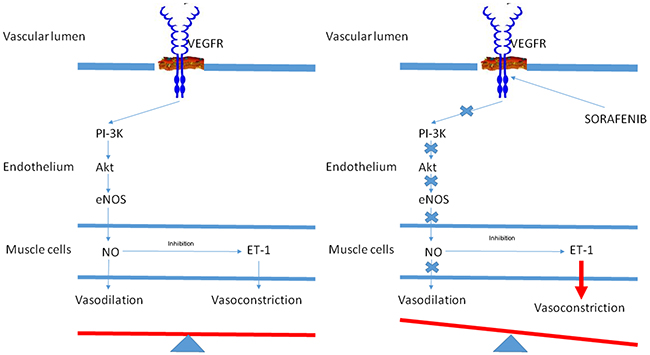
Figure 3: Hypothetic effect of vascular endothelial growth factor receptor (VEGFR) on blood vessel tone in patients A. without sorafenib-induced hypertension and B. with sorafenib-induced hypertension.
Although a correlation between HTN and response to sorafenib in HCC patients has already been reported in some studies [28, 29], it was established on the basis of grade of toxicity alone by assessing HTN one or 2 months after the start sorafenib. Conversely, we evaluated SBP and DBP separately after only 15 days of treatment and not only in terms of grade of toxicity.
Our data revealed a correlation between the change in electrolyte values and sorafenib-related HTN. It can be hypothesized that sorafenib blocks the VEGF receptor, inducing vasoconstriction in the kidneys, activating the renin-angiotensin-aldosterone system and increasing the production of renin. Renin converts angiotensin I into angiotensin II, leading to water retention, hypernatremia and hypokalemia [30] (Figure 4). Our data suggest that HTN in HCC patients undergoing treatment with sorafenib could be treated with ACE inhibitors.
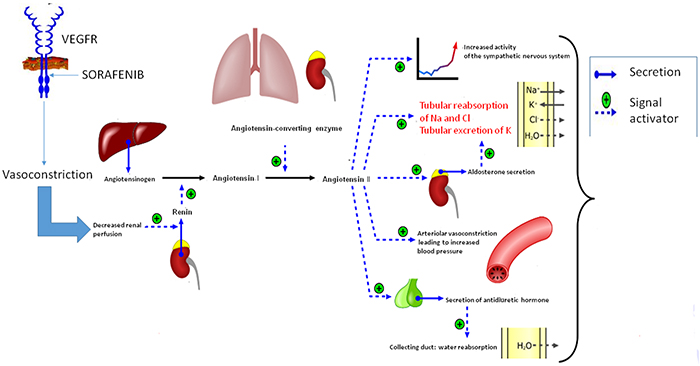
Figure 4: Hypothetic activation of the renin-angiotensin system in patients who develop HTN during treatment with sorafenib.
One strength of our study lies in the detailed information it provides on patient characteristics and follow up. However, the study also has some limitations. Despite being a retrospective evaluation, cases were selected consecutively to minimize bias. Secondly, as there was no control arm (patients not receiving sorafenib), a clear distinction between the prognostic and predictive role of HTN in terms of survival could not be made. Although multivariable analysis indicated that HTN was an independent variable, it cannot be ruled out that results were biased by the relatively small sample number.
In conclusion, sorafenib-related HTN is potentially predictive factor associated with significantly longer OS and PFS in patients with advanced HCC.
PATIENTS AND METHODS
This retrospective cohort study included all the patients treated for HCC between 1st July 2013 and 25th March 2015 at our institute (IRST IRCCS) in Meldola, Italy. Seventy-eight patients with advanced or intermediate stage HCC that was refractory or no longer amenable to locoregional therapies (according to American Association for the Study of Liver Diseases guidelines) were eligible for our analysis. All patients received a standard sorafenib regimen (400 mg bid continuously), dose reductions being made if deemed clinically necessary. Follow-up consisted of CT/MRI scanning every 8 weeks or as clinically indicated. Tumor response was evaluated by modified Response Evaluation Criteria in Solid Tumors (mRECIST) [23]. Treatment with sorafenib was continued until disease progression, unacceptable toxicity or death. Sorafenib was suspended in patients experiencing grade 4 treatment-related HTN (according to Common Terminology Criteria for Adverse Events, CTCAE, v4.03), while a dose reduction was recommended for patients with grades 1 to 3 HTN when blood pressure was difficult to control.
Patients were monitored as follows: days 1, 15, 28 and 60 of cycle 1, and every 2 months thereafter. Disease progression was assessed using mRECIST. Electrolytes were measured on days 1 and 15 of treatment. HCC patients without cirrhosis were excluded from the study. BP was measured on days 1 and 15 of treatment. Patients who had uncontrolled blood pressure at baseline (systolic BP >140 mm Hg and diastolic BP >90 mm Hg) were excluded from the study. HTN was defined as either a maximum or mean systolic BP (SBP) of at least 140 mm Hg or diastolic BP (DBP) of at least 90 mm Hg. HTN grade was defined according to the Common Terminology Criteria for Adverse Events (CTCAE) of the National Cancer Institute, version 4.03 of 14th June 2010.
This study was approved by the local Ethics Committee and informed consent was obtained from all patients.
Efficacy and safety assessments
The primary objective of this study was to compare progression-free survival (PFS) between patients who developed HTN and those who showed no signs of HTN during the first 15 days of treatment with sorafenib. Our second objective was to evaluate changes in blood electrolytes (sodium and potassium) in patients with HTN compared to those without HTN during the same period. We also planned to compare overall survival (OS) and disease control rate (DCR) between the 2 groups.
Statistical methods
Appropriate descriptive statistics were used for demographic and tumor characteristics. Mean, median, standard deviation and minimum and maximum values were reported for continuous variables, while count and proportion were reported for non-continuous variables. PFS was defined as the time from the start of sorafenib therapy until disease progression or death from any cause or last follow-up visit. OS was defined as the time-interval between the start of sorafenib therapy and death from any cause or last follow-up visit. PFS, OS and their two-sided 95% confidence intervals (95% CI) were estimated by the Kaplan-Meier method and curves were compared by the log-rank test (at a significance level of 5%). DCR was defined as the proportion of patients to achieve complete response (CR), partial response (PR), stable disease (SD) or progressive disease (PD) according to mRECIST.
Estimated hazard ratios (HRs) and their two-sided 95% CI were calculated using the Cox proportional-hazard model. After univariate analysis, a multivariable Cox regression model (including age, gender, etiology, BCLC stage, ECOG performance status, toxicity, treatment duration and previous TACE) was used to adjust for these potential confounding factors. We investigated the potential association between HTN/blood electrolyte levels and disease progression, in particular using nonparametric tests to examine the relationship between changes in raw data and disease status of the 2 sequential blood tests.
All p values were based on two-sided testing and statistical analyses were performed using SAS statistical software version 9.3 (SAS Inc., Cary, NC, USA).
ACKNOWLEDGMENTS
The authors would like to thank Ursula Elbling for editorial assistance.
GRANT SUPPORT
No grant support
CONFLICTS OF INTEREST
There are no conflicts of interest to declare. The manuscript has not been published previously, and is not under consideration, in whole or in part, for publication elsewhere.
Author contributions
ACG conceived and designed the experiments. ES, MV, GM, GFF, GD, EG, MB, JC, LF, MS, NS, AG, GLB, LV, ST, SC and GLF collected and assembled the data. ACG and ES conceived the analysis and interpretation of data. ACG and ES wrote the manuscript. All authors gave the final approval of manuscript.
REFERENCES
1. Faloppi L, Scartozzi M, Maccaroni E, Di Pietro Paolo M, Berardi R, Del Prete M, Cascinu S. Evolving strategies for the treatment of hepatocellular carcinoma: From clinical-guided to molecularly-tailored therapeutic options. Cancer Treat Rev. 2011; 37: 169-177.
2. Kane RC, Farrell AT, Madabushi R, Booth B, Chattopadhyay S, Sridhara R, Justice R, Pazdur R. Sorafenib for the treatment of unresectable hepatocellular carcinoma. Oncologist. 2009; 14: 95-100.
3. Llovet JM, Ricci S, Mazzaferro V, Hilgard P, Gane E, Blanc JF, de Oliveira AC, Santoro A, Raoul JL, Forner A, Schwartz M, Porta C, Zeuzem S, et al. Sorafenib in advanced hepatocellular carcinoma. N Engl J Med. 2008; 359: 378-390.
4. Cheng AL, Kang YK, Chen Z, Tsao CJ, Qin S, Kim JS, Luo R, Feng J, Ye S, Yang TS, Xu J, Sun Y, Liang H, et al. Efficacy and safety of sorafenib in patients in the asia-pacific region with advanced hepatocellular carcinoma: A phase III randomised, double-blind, placebo-controlled trial. Lancet Oncol. 2009; 10: 25-34.
5. Shao YY, Hsu CH, Cheng AL. Predictive biomarkers of antiangiogenic therapy for advanced hepatocellular carcinoma: Where are we? Liver Cancer. 2013; 2: 93-107.
6. Llovet JM, Peña CE, Lathia CD, Shan M, Meinhardt G, Bruix J; SHARP Investigators Study Group. Plasma biomarkers as predictors of outcome in patients with advanced hepatocellular carcinoma. Clin Cancer Res. 2012; 18: 2290-2300.
7. Casadei Gardini A, Marisi G, Scarpi E, Scartozzi M, Faloppi L, Silvestris N, Masi G, Vivaldi C, Tamberi S, Foschi FG, Tamburini E, Tenti E, Ricca S, et al. Effects of metformin on clinical outcome in diabetic patients with advanced HCC receiving sorafenib. Expert Opin Pharmacother 2015; 16: 2719-2725.
8. Launay-Vacher V, Deray G. Hypertension and proteinuria: a class-effect of antiangiogenic therapies. Anticancer Drugs. 2009; 20: 81-82.
9. Chowdhury S, Spicer J, Harper P. Hypertension and targeted therapy: part 1. Bevacizumab. Targ Oncol. 2006; 1: 104-108.
10. Chowdhury S, Spicer J, Harper P. Hypertension and targeted therapy: part 2. Small molecule inhibitors of VEGF. Targ Oncol. 2006; 1: 172-178.
11. Roodhart JM, Langenberg MH, Witteveen E, Voest EE. The molecular basis of class side effects due to treatment with inhibitors of the VEGF/VEGFR pathway. Curr Clin Pharmacol. 2008; 3: 132-143.
12. Humphreys BD, Atkins MB. Rapid development of hypertension by sorafenib: toxicity or target? Clin Cancer Res. 2009; 15: 5947-5949.
13. Rixe O, Billemont B, Izzedine H. Hypertension as a predictive factor of sunitinib activity. Ann Oncol. 2007; 18: 1117.
14. Scartozzi M, Galizia E, Chiorrini S, Giampieri R, Berardi R, Pierantoni C, Cascinu S. Arterial hypertension correlates with clinical outcome in colorectal cancer patients treated with first-line bevacizumab. Ann Oncol. 2009; 20: 227-230.
15. Yang R, Thomas GR, Bunting S, Ko A, Ferrara N, Keyt B, Ross J, Jin H. Effects of vascular endothelial growth factor on hemodynamics and cardiac performance. J Cardiovasc Pharmacol. 1996; 27: 838-844.
16. Wei W, Jin H, Chen ZW, Zioncheck TF, Yim AP, He GW. Vascular endothelial growth factorinduced nitric oxide- and PGI2-dependent relaxation in human internal mammary arteries: a comparative study with KDR and Flt-1 selective mutants. J Cardiovasc Pharmacol. 2004; 44: 615-621.
17. Chu JS, Ge FJ, Zhang B, Wang Y, Silvestris N, Liu LJ, Zhao CH, Lin L, Brunetti AE, Fu YL, Wang J, Paradiso A, Xu JM. Expression and prognostic value of VEGFR-2, PDGFR-β, and c-Met in advanced hepatocellular carcinoma. J Exp Clin Cancer Res. 2013; 32: 16.
18. Steeghs N, Gelderblom H, Roodt JO, Christensen O, Rajagopalan P, Hovens M, Putter H, Rabelink TJ, de Koning E. Hypertension and rarefaction during treatment with telatinib, a small molecule angiogenesis inhibitor. Clin Cancer Res. 2008; 14: 3470-3476.
19. Dechend R, Luft FC. Angiogenesis factors and preeclampsia. Nature Med. 2008; 14: 1187-1188.
20. Wilhelm SM, Adnane L, Newell P, Villanueva A, Llovet JM, Lynch M. Preclinical overview of sorafenib, a multikinase inhibitor that targets both raf and VEGF and PDGF receptor tyrosine kinase signaling. Mol Cancer Ther. 2008; 7: 3129-3140.
21. Fulton D, Gratton JP, McCabe TJ, Fontana J, Fujio Y, Walsh K, Franke TF, Papapetropoulos A, Sessa WC. Regulation of endothelium-derived nitric oxide production by the protein kinase akt. Nature. 1999; 399: 597-601.
22. Govers R, Rabelink TJ. Cellular regulation of endothelial nitric oxide synthase. Am J Physiol Renal Physiol. 2001; 280: F193-206.
23. Lencioni R, Llovet JM. Modified RECIST (mRECIST) assessment for hepatocellular carcinoma. Semin Liver Dis. 2010; 30: 52-60.
24. Merkus D, Sorop O, Houweling B, Boomsma F, van den Meiracker AH, Duncker DJ. NO and prostanoids blunt endothelin-mediated coronary vasoconstrictor influence in exercising swine. Am J Physiol Heart Circ Physiol. 2006; 291: H2075-H2081.
25. Wiley KE, Davenport AP. Physiological antagonism of endothelin-1 in human conductance and resistance coronary artery. Br J Pharmacol. 2001; 133: 568-574.
26. Kappers MH, van Esch JH, Sluiter W, Sleijfer S, Danser AH, van den Meiracker AH. Hypertension induced by the tyrosine kinase inhibitor sunitinib is associated with increased circulating endothelin-1 levels. Hypertension. 2010; 56: 675-681.
27. Kappers MH, Smedts FM, Horn T, van Esch JH, Sleijfer S, Leijten F, Wesseling S, Strevens H, Jan Danser AH, van den Meiracker AH. The vascular endothelial growth factor receptor inhibitor sunitinib causes a preeclampsia-like syndrome with activation of the endothelin system. Hypertension. 2011; 58: 295-302.
28. Estfan B, Byrne M, Kim R. Sorafenib in advanced hepatocellular carcinoma: hypertension as a potential surrogate marker for efficacy. Am J Clin Oncol. 2013; 36: 319-324.
29. Akutsu N, Sasaki S, Takagi H, Motoya M, Shitani M, Igarashi M, Hirayama D, Wakasugi H, Yamamoto H, Kaneto H, Yonezawa K, Yawata A, Adachi T, et al. Development of hypertension within 2 weeks of initiation of sorafenib for advanced hepatocellular carcinoma is a predictor of efficacy. Int J ClinOncol. 2015; 20: 105-110.
30. Ferrão FM, Lara LS, Lowe J. Renin-angiotensin system in the kidney: What is new? World J Nephrol. 2014; 3: 64-76.