
INTRODUCTION
Discovery of programmed death-ligand 1 (PD-L1) expression in tumors has encouraged research toward more efficient immunologic methods of conquering cancer [1]. Cancer cells have developed various strategies for evading host anti-cancer immunologic attacks, including the up-regulation of PD-L1, which induces T cell anergy and apoptosis by interacting with programmed death-1 (PD-1) receptors [2, 3]. The development of immune checkpoint inhibitors that block PD-1/PD-L1 interaction has been clinically successful, with a long response time noted [4, 5]. However, more than half of patients evaluated were insensitive to these agents, highlighting the importance of distinguishing between those who may be sensitive or resistant to such inhibitors. Various biomarker candidates may predict responses to anti-PD-1/PD-L1 blocking agents, with PD-L1 expression in tumors a leading prospect [6–8].
Viruses and epithelial-mesenchymal transition (EMT) are associated with high PD-L1 expression [9]. PD-L1 up-regulation is observed in Epstein-Barr virus (EBV)-associated malignancies such as lymphoma, nasopharyngeal and stomach cancer. PD-L1 up-regulation also occurs in cancers associated with human papillomavirus (HPV) such as uterine, cervical, head and neck cancers [10–15]. PD-L1 up-regulation may occur in response to the constitutional up-regulation of CD274 gene amplification at 9p24.1, which encodes PD-L1 [10]. Another possible mechanism is PD-L1 induction by interferon-gamma secreted from tumor-infiltrating immune cells via the JAK/STAT pathway [12–16]. PD-L1 expression is also associated with the mesenchymal signature of tumors. For example, more than half of sarcoma patients showed high PD-L1 expression levels, irrespective of tumor type [17]. Moreover, PD-L1 was highly expressed in 69.2% of sarcomatoid lung carcinomas [18]. EMT changes, manifested by E-cadherin (encoded by CDH1) down-regulation and vimentin (encoded by VIM) up-regulation, also correlated with PD-L1 induction [19]. However, a comprehensive analysis of the association of PD-L1 with viruses and EMT has not yet been reported.
Head and neck squamous cell carcinoma (HNSCC) is a suitable model to investigate the clinicopathologic features associated with PD-L1 up-regulation. Recent advances in genomics have shown that mutational HPV-positive and -negative tumor profiles, which have retained and lost p16 expression, respectively, clearly differ [20–22]. Although HPV/p16-positive tumors showed high PD-L1 expression compared to HPV/p16-negative tumors [14, 23, 24], the statistical significance between PD-L1 and HPV was not strong. In addition, a significant proportion of HPV/p16-negative tumors also showed high PD-L1 expression. Interestingly, 19.2% to 37.4% of HNSCC cases exhibited inflamed/mesenchymal features; however, this cluster was not definitively correlated with HPV/p16 positivity [25]. Therefore, PD-L1 expression associated with HPV/p16 and EMT is of interest.
In the current study, we analyzed 1) PD-L1 expression according to the EMT and p16 statuses of patients with HNSCC, and 2) their clinical implications. A gene expression signature associated with EMT was obtained from the publicly available database, GEO4824 [26]. This signature was then applied to The Cancer Genome Atlas (TCGA) database [20] and the Cancer Cell Line Encyclopedia (CCLE) [27] to validate the significance of the correlation between PD-L1 and EMT in independent cohorts.
RESULTS
PD-L1 expression correlated with EMT
Representative images of PD-L1-negative and -positive, p16-positive and high E-cadherin expressing tumor tissues are shown in Supplementary Figure 1. Of the 50 patients included in this study (training cohort), 32 and 18 patients, respectively, exhibited PD-L1-positive and –negative tumors. Fifteen patients were p16-positive and 17 were EMT-positive. Interestingly, 15 of the 32 PD-L1-positive tumors (46.9%) were EMT-positive, as assessed by low E-cadherin and high vimentin expression (Figure 1A). PD-L1 positivity was significantly higher in patients with EMT-positive tumors (P = 0.013, Figure 1B). Clinical features, including age, sex, smoking history, and stage, did not differ according to patients’ PD-L1 and EMT statuses (Table 1, left column). The proportion of patients showing oropharyngeal tumors was higher in PD-L1-positive/EMT-negative patients (PD-L1+/EMT-; Table 1, left column). The E-cadherin H-score was lower for PD-L1+/p16- compared with PD-L1-/p16- patients (P = 0.559). The vimentin H-score was significantly higher in PD-L1+/p16- compared with PD-L1-/p16- patients (P = 0.014). However, this trend was not observed in p16+ patients (P = 0.245 and 0.371, respectively; Figure 1C-1D). Taken together, of the 32 PD-L1+ patients, 12 were p16-/EMT+ (37.5%), 9 were p16+/EMT- (28.1%), 8 were p16-/EMT- (25%), and 3 were p16+/EMT+ (9.4%; Figure 1E). Although PD-L1 positivity was not significantly different according to p16 status (P = 0.199; Supplementary Figure 2A), PD-L1 positivity was significantly higher in p16-/EMT+ and p16+/EMT- compared with p16-/EMT- patients (P = 0.002 and 0.026, respectively; Supplementary Figure 2B). Univariate and multivariate logistic regression analyses showed that an oropharyngeal tumor origin and EMT status associated significantly with PD-L1 positivity (P = 0.014 and 0.010, respectively; Table 2, left column).
Table 1: Patient characteristics
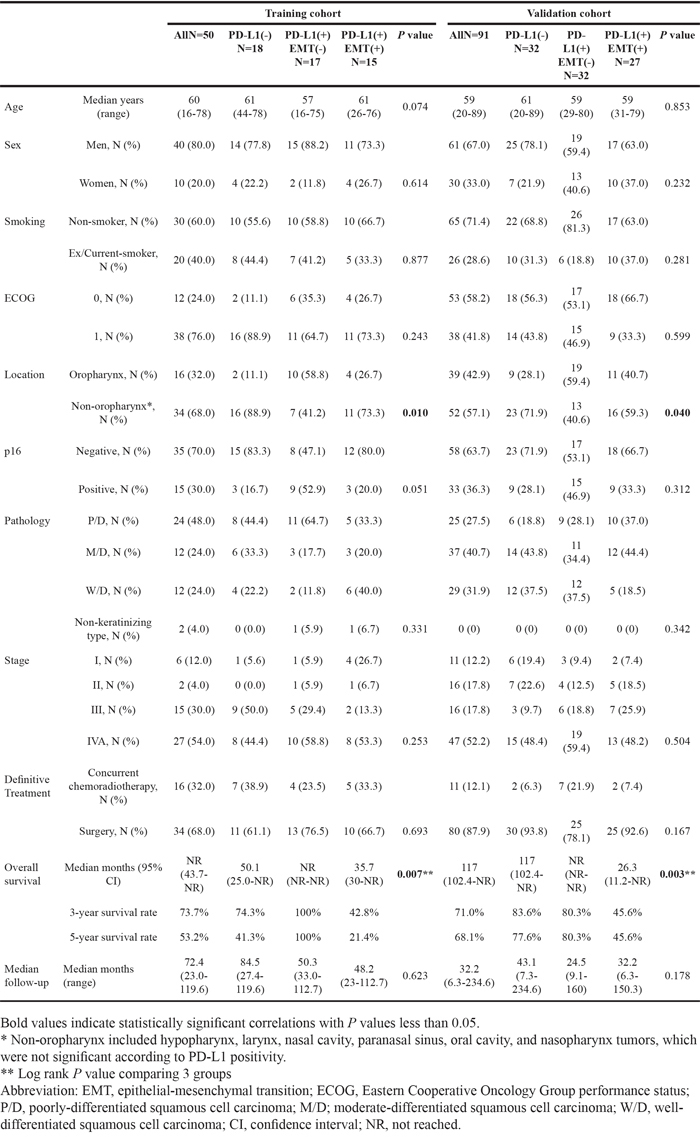
Table 2: Univariate and multivariate logistic analysis of factors affecting PD-L1 expression
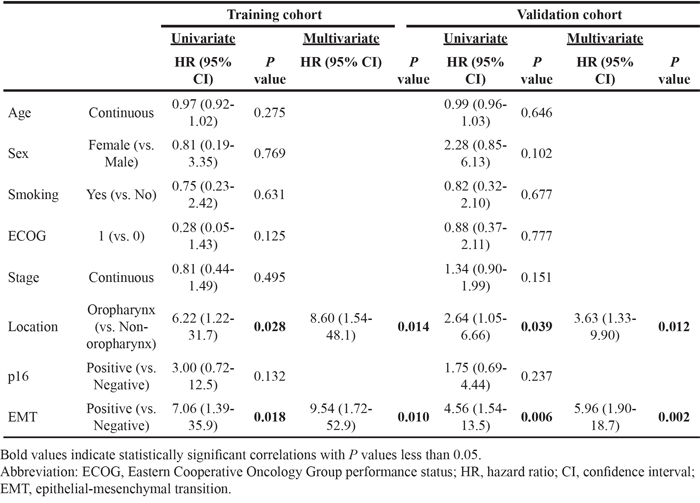
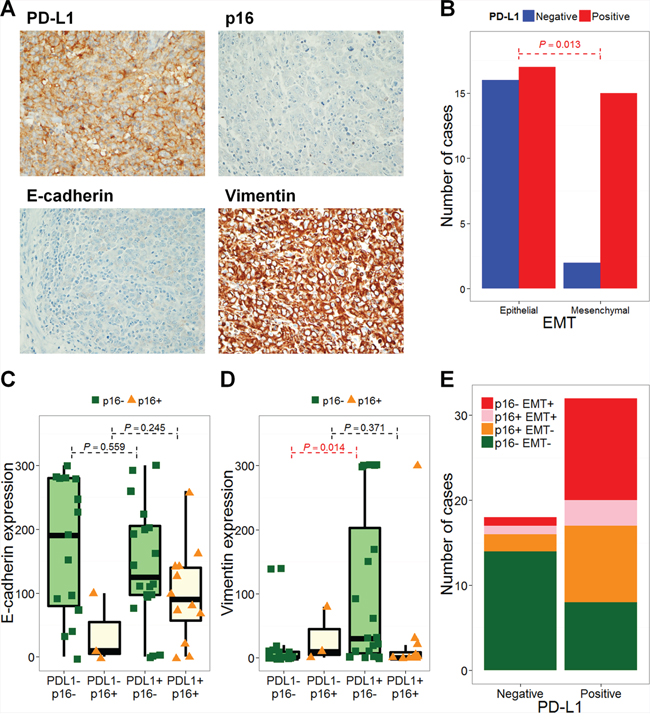
Figure 1: PD-L1 expression is associated with epithelial-mesenchymal transition. Representative images of immunohistochemical staining with anti-PD-L1 (× 200; A. × 400, B.), anti-E-cadherin (× 200, C.), and anti-vimentin (× 200, D.) are shown. PD-L1 expression was positively correlated with vimentin and negatively correlated with E-cadherin. The number of PD-L1-negative (blue bars) and -positive (red bars) cases according to epithelial-mesenchymal transition (EMT) are shown. The P value from Fisher’s exact test is annotated (red). H-scores for E-cadherin (C) and vimentin (D) are plotted according to PD-L1 and p16 statuses. The number of p16- EMT- (green), p16+ EMT- (orange), p16+ EMT+ (pink), and p16- EMT+ (red) cases according to PD-L1 status are shown E.
Training cohort findings were confirmed in the independent validation cohort (N = 91), where PD-L1 positivity was significantly higher in patients with EMT-positive tumors (PD-L1+ in EMT- versus EMT+: 54.2% versus 84.4%; P = 0.003). The number of patients allocated to PD-L1-, PD-L1+/EMT-, and PD-L1+ /EMT+ groups were 32, 32, and 27, respectively (Table 1, right column). Univariate and multivariate logistic regression analyses of the validation cohort also showed that oropharyngeal tumor origin and EMT status were significantly associated with PD-L1 positivity (P = 0.012 and 0.002, respectively; Table 2, right column).
Survival analysis according to PD-L1 and EMT statuses
Survival analysis according to PD-L1 expression in HNSCC has not been clearly defined. In both training and validation cohorts, PD-L1 expression was not significantly associated with overall survival (OS; training cohort, P = 0.137, and validation cohort, P = 0.202) or progression-free survival (PFS; training cohort, P = 0.213, and validation cohort, P = 0.494; Supplementary Figure 3). In regard to the training cohort, interestingly, PD-L1+/EMT+ patients showed significantly poorer OS and PFS rates compared to PD-L1+/EMT- patients (P < 0.001 and 0.005, respectively; Figure 2A-2B). The 3-year OS rate was 42.8% for PD-L1+/EMT+ patients, which differed markedly from 100% for PD-L1+/EMT- patients. Moreover, PD-L1+/EMT+ patients showed significantly poorer OS and PFS rates compared with PD-L1+/p16+/EMT- patients (P = 0.007 and 0.006, respectively; Supplementary Figure 4A-4B). Univariate Cox regression analysis indicated that tumor location and EMT status significantly correlated with the OS rate. However, only the EMT status was significant in multivariate analysis (adjusted hazard ratio 2.82, 95% confidence interval 1.01–7.94; P = 0.049; Table 3, left column). These trends on the prognostic impacts of PD-L1+/EMT+ were also significant in the validation cohort: PD-L1+/EMT+ was associated with worse OS and PFS rates compared with PD-L1+/EMT- (P = 0.009 and 0.023, respectively; Figure 2C-2D) or PD-L1+/p16+/EMT- (P = 0.047 and 0.013, respectively; Supplementary Figure 4C-4D). Multivariate Cox regression analysis for the validation cohort revealed that performance and EMT status both significantly correlated with the OS rate (adjusted P = 0.007 and 0.002, respectively; Table 3, right column; see also Supplementary Table 2 for PFS analysis).
Table 3: Univariate and multivariate Cox regression analysis of factors affecting overall survival
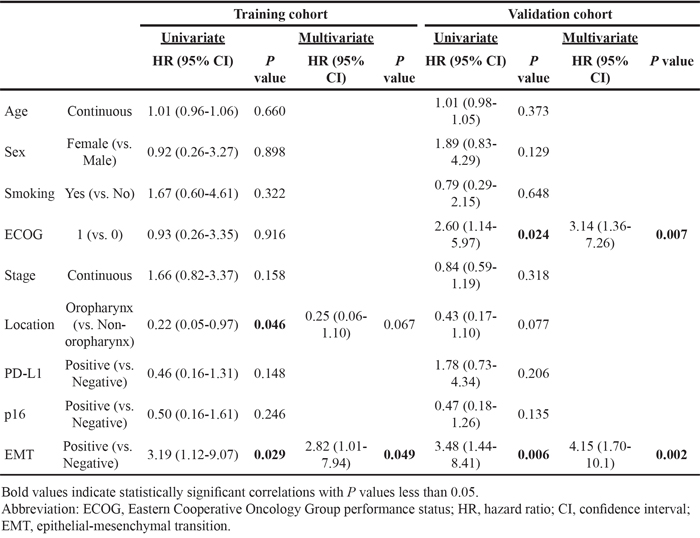
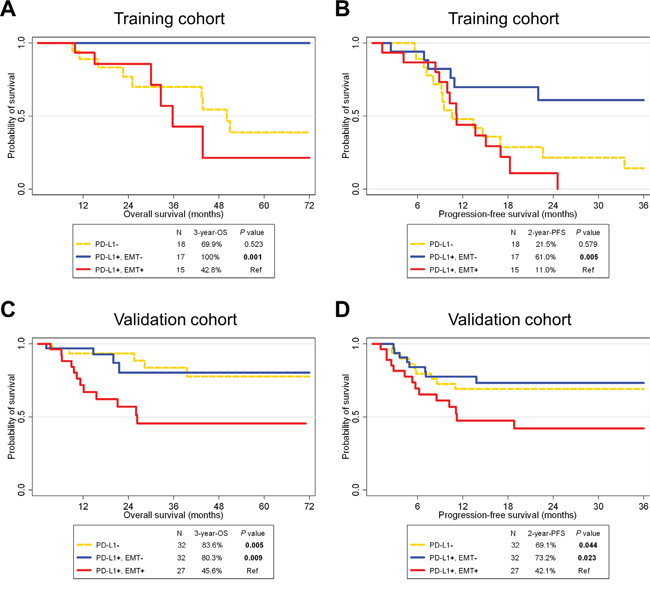
Figure 2: Survival analysis according to PD-L1 and epithelial-mesenchymal transition statuses in HNSCC patients of training (A, B) and validation cohorts (C, D). A Kaplan-Meier plot of overall survival (OS; A, C) and progression-free survival (PFS; B, D) according to PD-L1 and epithelial-mesenchymal transition (EMT) statuses. Abbreviations: HNSCC, head and neck squamous cell carcinoma; Ref, reference.
Correlation of PD-L1 with EMT in TCGA and CCLE
A 75 gene EMT expression signature was obtained from the GSE4824 dataset, which predicted mesenchymal features in lung cancer cell lines, including squamous cell carcinoma [26]. EMT predictions based on the 75 gene signature were conducted for HNSCC samples and cell lines from TCGA and CCLE, respectively [20, 27]. EMT predictions resulted in 119 out of 564 HNSCC samples (21.1%) from TCGA, and 4 out of 32 cell lines (12.5%) from CCLE having mesenchymal features (Figure 3A, 3C). Samples with a high probability of mesenchymal features exhibited a high expression of mesenchymal signatures, such as ZEB1 and VIM that encode vimentin, and low expression of epithelial signatures, such as MUC1 and CDH1 that encode E-cadherin. Interestingly, in both TCGA and CCLE, PD-L1 expression was significantly higher in mesenchymal features compared with epithelial features (P < 0.001; Figure 3B, 3D). The HPV/p16 status was disclosed in 277 cases (221 HPV/p16- and 56 HPV/p16+) from TCGA samples [20]. PD-L1 expression did not differ according to HPV/p16 status (P = 0.651). However, p16-/EMT+ displayed significantly higher PD-L1 expression compared to p16-/EMT- or p16+/EMT- (P < 0.001 and 0.012, respectively; Supplementary Figure 5).
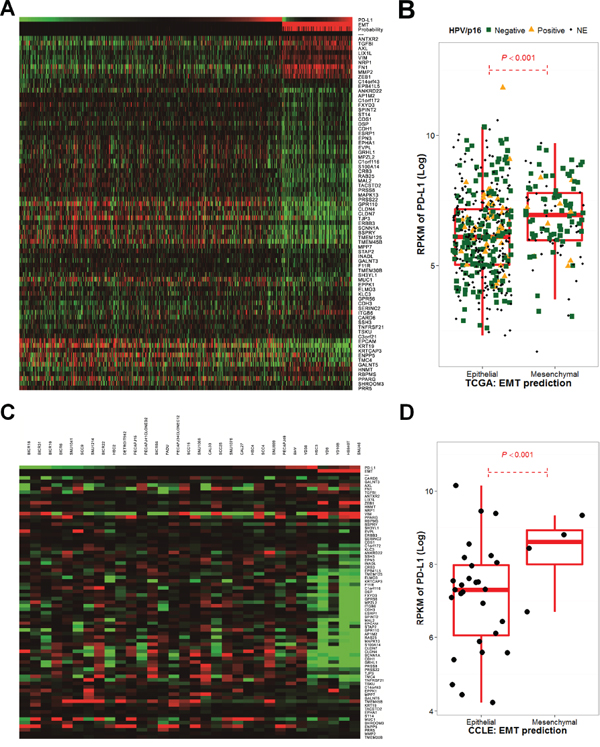
Figure 3: The epithelial-mesenchymal transition gene expression signature correlates with PD-L1 expression in The Cancer Genome Atlas and the Cancer Cell Line Encyclopedia. Significant 75-gene expression signatures, referred from GSE4824 and Bayesian probability to predict EMT changes that favor mesenchymal features in The Cancer Genome Atlas (TCGA) A. and the Cancer Cell Line Encyclopedia (CCLE) cohorts C. as well as PD-L1 expression, are shown as a heatmap. PD-L1 expression was calculated by the log 2 value of its reads per kilobase of transcript per million mapped reads (RPKM) and was compared according to EMT predictions in TCGA B. and CCLE cohorts D.
OS and PFS rates for PD-L1+/EMT+ patients were significantly worse compared to those for PD-L1- patients from TCGA (P = 0.017 and 0.009, respectively; Figure 4). PFS rates were significantly different between PD-L1+/EMT+ and PD-L1+/EMT- patients (P = 0.040). However, OS rates were not significantly different, although the 3-year OS rate differed between PD-L1+/EMT+ (40.2%) and PD-L1+/EMT- (61.8%; P = 0.109).
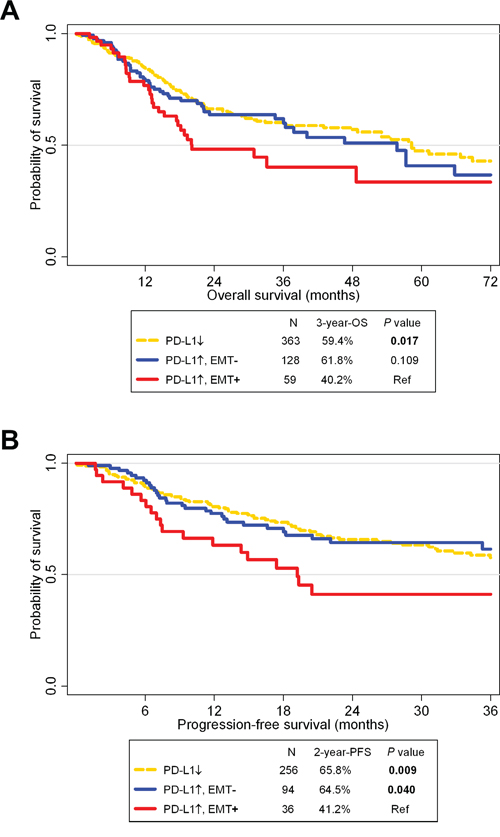
Figure 4: Survival analysis according to PD-L1 and epithelial-mesenchymal statuses in The Cancer Genome Atlas cohort. A Kaplan-Meier plot of overall survival (OS; A.) and progression-free survival (PFS; B.) according to PD-L1 expression and epithelial-mesenchymal transition (EMT) status. Abbreviation: Ref, reference.
DISCUSSION
We investigated the clinical significance of EMT and p16 on PD-L1 expression in HNSCC. PD-L1 expression is independently associated with mesenchymal features. Correlations between PD-L1 and EMT were also validated in an independent validation cohort as well as in public TCGA and CCLE databases using an EMT gene expression signature. Patients who were PD-L1+/EMT+ showed a significantly poorer prognosis than those who were PD-L1+/EMT-. This finding suggests that PD-L1 positivity can be divided into two categories by EMT markers in HNSCC.
Together with the mutational burden of tumors [28] and an abundance of tumor-infiltrating lymphocytes (TILs) [29], PD-L1 expression in tumor tissues or niches strongly correlates with response rates to anti-PD-1/PD-L1 inhibitors [6, 7]. However, the specific clinicopathologic factors associated with PD-L1 expression in cancer are unclear. This is because multi-factorial influences on PD-L1 expression exist including viruses, EMT changes, and sub-lethal damage induced by cytotoxic chemotherapy via MAPK or JAK/STAT pathways [9, 15, 19, 30, 31]. Although an association between HPV and PD-L1 expression has been reported [14], a major proportion of HNSCC cases exhibit an inflamed/mesenchymal signature that is independent of HPV status [21]. In the current study, PD-L1 expression significantly correlated with EMT rather than HPV/p16 status. In addition to an association between PD-L1 and EMT in a rodent model [19] and a strong PD-L1 association with cancers of mesenchymal origin [17, 18], this is the first report to show a correlation between PD-L1 and EMT in cancers that originate from epithelial tissue. This correlation was significant both in clinical samples from a cohort of Korean patients and in an independent cohort that primarily consisted of Western patients in TCGA [20] and a comprehensive cancer cell line database, CCLE [27].
A statistical significance regarding PD-L1 associating with HPV/p16 status was not observed in clinical or TCGA samples. However, HPV/p16 could also partially contribute to PD-L1 expression given that oropharyngeal tumors, with their high prevalence of HPV infection, also correlated with PD-L1 positivity. HPV-positive HNSCC and other virus-associated cancers, such as HPV-positive uterine cervical cancer and EBV-positive gastric cancer, show increased immunogenic features such as an abundance of TIL or CD8-positive cytotoxic T cell signatures [32, 33]. Because the correlation between PD-L1 and EMT is increased in HPV/p16-negative patients, HPV/p16-positivity and EMT features could contribute to PD-L1 expression in a mutually exclusive manner.
Overall prognosis according to PD-L1 status is controversial due to various factors. PD-L1 expression is considered a poor prognostic factor in cancers such as non-small cell lung cancer, renal cell carcinoma, and melanoma [34–36]. In contrast, PD-L1 status is a good prognostic factor in colorectal cancer [37]. However, in regard to HNSCC, the lack of information in the literature concerning its prognosis according to PD-L1 expression could be due to a bias that PD-L1 is not important in this disease. In the current study, PD-L1 expression did not solely affect significant survival differences. However, the inclusion of factors associated with PD-L1 up-regulation, such as HPV/p16 positivity and EMT features, clearly defined distinct patient groups by survival differences. In PD-L1-positive patients, p16 positivity conferred a much better prognosis than EMT positivity given that viral associations induce immunogenic features in tumors, which confer a good prognosis in HNSCC [38, 39]. Cancers showing EMT are associated with early recurrence and aggressive metastases [40]; therefore, EMT-associated PD-L1-positive cancers have a poor prognosis. This prognostic trend was validated in a TCGA cohort that included diverse ethnicities.
Investigating upstream mechanisms of PD-L1 up-regulation and their clinical impacts is challenging. PD-L1 expression is induced by extrinsic stimuli such as interferon-gamma [1] produced by the inflamed niche surrounding tumors in response to viral associations or neo-antigen processing [9, 41]. However, PD-L1 expression is also induced by the activation of intrinsic oncogenic pathways, such as STAT3, an activating EGFR mutation or ALK translocation [42, 43]; together with EMT, these share similar molecular pathways and EMT-associated genes. Additionally, because the clinical implications of PD-L1 up-regulation differ depending on intrinsic and extrinsic induction mechanisms, their predictive values with anti-PD-1/PD-L1 inhibitors should be investigated, particularly the predictive values of PD-L1+/EMT+ and PD-L1+/EMT- statuses.
The retrospective design and relatively small number of samples with a heterogeneous clinical status used in the current study could have biased results. Since we aimed to find an association between PD-L1 and EMT in a clinical setting, patients with nasopharyngeal cancer (N = 1) and paranasal sinus cancer (N = 2) were included; of these, two patients showed a non-keratinizing type pathology. Therefore, caution is needed in the direct application of the current results to further clinical studies. However, significant statistical results were obtained for the independent validation cohort, as well as for TCGA and the CCLE open databases. The clinical outcomes of anti-PD-1/PD-L1 inhibitor therapy is lacking in this study, although overall prognosis according to PD-L1 expression and its up-stream mechanism should be understood before researching clinical outcomes of the target agent. Although the prognostic impact of PD-L1 expression was not reported, we clearly showed PD-L1 up-regulation according to two distinct up-stream pathways, EMT and HPV/p16, influenced the overall prognosis. The association of EMT with PD-L1 in human cancer is a novel finding in this study.
In conclusion, PD-L1 expression is associated with EMT, an independent up-stream pathway distinct from HPV/p16 association. EMT-associated PD-L1 expression confers a significantly poorer prognosis compared to PD-L1 expression not associated with EMT. Clinical investigations using anti-PD-1/PD-L1 inhibitors in patients with EMT-associated PD-L1 up-regulation are warranted.
MATERIALS AND METHODS
Study population
Medical records were retrospectively reviewed for patients diagnosed with locally advanced HNSCC and treated at Seoul National University Hospital between December 2004 and November 2012. Fifty patients with paraffin-embedded tumor samples were included. Firstly, we analysed the association of PD-L1 and EMT in 50 HNSCC patients (training cohort). To confirm preliminary findings, we enrolled a further 91 HNSCC patients (validation cohort), and performed similar analyses.
Treatment
Treatment decisions were determined by a multidisciplinary team [44, 45]. Patients were treated with definitive concurrent chemoradiotherapy (CCRT) or radical surgery, including primary tumor and regional lymph node dissection. The CCRT regimen consisted of weekly cisplatin. Radiation therapy was provided as a standard fractionated dose of more than 60 Gy for primary tumors and regional lymph nodes, with concurrent cisplatin chemotherapy.
Immunohistochemistry
Representative, formalin-fixed, paraffin-embedded tissue blocks from each case were submitted for immunohistochemistry (IHC) using the following antibodies: mouse anti-p16 (E6H4) monoclonal antibody (mAb; Roche/MTM/Ventana Medical Systems, Tucson, AZ, USA), mouse anti-E-cadherin (36B5) mAb (Novocastra Laboratories, Newcastle upon Tyne, UK), mouse anti-vimentin (V9) mAb (Dako, Ely, UK) and rabbit anti-PD-L1 (E1L3N) XP® mAb (Cell Signaling Technology, Danvers, MA, USA). IHC was performed using the Ventana Benchmark XT system (Ventana Medical Systems). When tissue sections showed diffuse and strong nuclear and cytoplasmic staining in ≥ 70% of tumor cells, this was considered positive for p16 [46]. For E-cadherin and vimentin, staining intensity was scored in four categories: no staining (0), weak (1+), moderate (2+) and strong (3+) staining. The percentage of tumor cells showing the different staining intensities were evaluated by a trained pathologist. An IHC score (H-score) was then calculated using the following formula: 1 × (percentage of cells showing weak staining) + 2 × (percentage of cells showing moderate staining) + 3 × (percentage of cells showing strong staining). E-cadherin and vimentin were used as an epithelial or mesenchymal phenotype marker, respectively. An EMT phenotype was defined as low E-cadherin expression with an H-score < 200 and high vimentin expression with a H-score > 30. PD-L1 IHC was evaluated based on the intensity and proportion of membranous staining, with or without cytoplasmic staining, in tumor cells and was scored as follows: 0, less than 5% of tumor cells; 1, weak in ≥ 5% of tumor cells; 2, moderate in ≥ 5% of tumor cells; and 3, strong in ≥ 5% of tumor cells. Cases showing membranous staining for PD-L1 in ≥ 5% of tumor cells (i.e., including IHC scores 1, 2 or 3) were considered PD-L1-positive.
Statistical analyses of microarray, RNA sequencing, and clinicopathologic data
The BRB-ArrayTools software program (http://linus.nci.nih.gov/BRB-ArrayTools.html) was used in the analysis of gene expression data [47]. A heatmap was generated using Cluster and TreeView software programs [48]. To assess EMT characteristics of tumors from an HNSCC cohort of TCGA study [20] and cell lines from CCLE [27], 75 gene expression signatures associated with EMT from a previous study, GSE4824 [26], and a previously developed approach were used [49, 50]. Briefly, the 75 gene expression data in the training set (GSE35640, Supplementary Table 1) were combined to form a classifier according to a Bayesian compound covariate predictor (BCCP) [51]. The robustness of the classifier was assessed using a misclassification rate determined during leave-one-out cross-validation in the training set. The BCCP classifier estimated the likelihood that an individual patient had either an epithelial or mesenchymal signature according to a Bayesian probability cut-off of 0.5, which was optimized by comparing results with a previously reported proportion of EMT signatures in HNSCC [25]. A comparison of continuous values, such as H-scores for E-cadherin and vimentin, or the log 2 value of reads per kilobase of transcript per million mapped reads (RPKM) of PD-L1, was undertaken using a Wilcoxon rank sum test. A fisher’s exact test was used to determine associations between clinicopathologic parameters. The significance of clinicopathologic factors on PD-L1-positivity was calculated by logistic regression. OS was measured from the diagnosis date until death, or the last follow-up date if censored. Progression-free survival (PFS) was calculated from the first day of definitive treatment up to the date of disease progression, confirmed by imaging, death, or the last follow-up date if censored. Survival analyses were carried out according to the Kaplan-Meier method with log-rank testing to assess differences between groups. A Cox proportional hazard regression model was used for univariate and multivariate survival analyses. The RPKM cut-off for PD-L1 in survival analyses was determined by a median value of PD-L1 RPKM for mesenchymal signatures. All reported P values were two-sided, and considered significant if P < 0.05. A false discovery rate were applied to control type I errors. All statistical analyses and data generation were carried out using R version 3.1.3 (http://www.r-project.org) and STATA version 12 (StataCorp LP, College Station, TX, USA).
ACKNOWLEDGMENTS
We thank the patients and their families who generously donated valuable tissue samples.
CONFLICTS OF INTEREST
All authors have no conflicts of interest to declare.
GRANT SUPPORT
This study was supported by the SNUH Research Fund (grant no. 03-2015-0380), the Korean Cancer Foundation (K2015-01), and the Innovative Research Institute for Cell Therapy, Republic of Korea (A062260).
Ethics
This study was approved by the Institutional Review Board of Seoul National University Hospital (approval number: H-1307-051-504) and was conducted in accordance with the Principles of the Declaration of Helsinki.
REFERENCES
1. Dong H, Strome SE, Salomao DR, Tamura H, Hirano F, Flies DB, Roche PC, Lu J, Zhu G, Tamada K, Lennon VA, Celis E, Chen L. Tumor-associated B7-H1 promotes T-cell apoptosis: a potential mechanism of immune evasion. Nature medicine. 2002; 8:793–800.
2. Dunn GP, Bruce AT, Ikeda H, Old LJ, Schreiber RD. Cancer immunoediting: from immunosurveillance to tumor escape. Nature immunology. 2002; 3:991–998.
3. Schreiber RD, Old LJ, Smyth MJ. Cancer immunoediting: integrating immunity’s roles in cancer suppression and promotion. Science. 2011; 331:1565–1570.
4. Robert C, Schachter J, Long GV, Arance A, Grob JJ, Mortier L, Daud A, Carlino MS, McNeil C, Lotem M, Larkin J, Lorigan P, Neyns B, Blank CU, Hamid O, Mateus C, et al. Pembrolizumab versus Ipilimumab in Advanced Melanoma. The New England journal of medicine. 2015; 372:2521–2532.
5. Topalian SL, Hodi FS, Brahmer JR, Gettinger SN, Smith DC, McDermott DF, Powderly JD, Carvajal RD, Sosman JA, Atkins MB, Leming PD, Spigel DR, Antonia SJ, Horn L, Drake CG, Pardoll DM, et al. Safety, activity, and immune correlates of anti-PD-1 antibody in cancer. The New England journal of medicine. 2012; 366:2443–2454.
6. Garon EB, Rizvi NA, Hui R, Leighl N, Balmanoukian AS, Eder JP, Patnaik A, Aggarwal C, Gubens M, Horn L, Carcereny E, Ahn MJ, Felip E, Lee JS, Hellmann MD, Hamid O, et al. Pembrolizumab for the treatment of non-small-cell lung cancer. The New England journal of medicine. 2015; 372:2018–2028.
7. Herbst RS, Soria JC, Kowanetz M, Fine GD, Hamid O, Gordon MS, Sosman JA, McDermott DF, Powderly JD, Gettinger SN, Kohrt HE, Horn L, Lawrence DP, Rost S, Leabman M, Xiao Y, et al. Predictive correlates of response to the anti-PD-L1 antibody MPDL3280A in cancer patients. Nature. 2014; 515:563–567.
8. Ock CY, Keam B, Kim S, Lee JS, Kim M, Kim TM, Jeon YK, Kim DW, Chung DH, Heo DS. Pan-cancer immunogenomic perspective on the tumor microenvironment based on PD-L1 and CD8 T cell infiltration. Clin Cancer Res. 2016 Jan 27. pii: clincanres.2834.2015.
9. Ritprajak P, Azuma M. Intrinsic and extrinsic control of expression of the immunoregulatory molecule PD-L1 in epithelial cells and squamous cell carcinoma. Oral oncology. 2015; 51:221–228.
10. Green MR, Monti S, Rodig SJ, Juszczynski P, Currie T, O’Donnell E, Chapuy B, Takeyama K, Neuberg D, Golub TR, Kutok JL, Shipp MA. Integrative analysis reveals selective 9p24.1 amplification, increased PD-1 ligand expression, and further induction via JAK2 in nodular sclerosing Hodgkin lymphoma and primary mediastinal large B-cell lymphoma. Blood. 2010; 116:3268–3277.
11. Cancer Genome Atlas Research N. Comprehensive molecular characterization of gastric adenocarcinoma. Nature. 2014; 513:202–209.
12. Chen BJ, Chapuy B, Ouyang J, Sun HH, Roemer MG, Xu ML, Yu H, Fletcher CD, Freeman GJ, Shipp MA, Rodig SJ. PD-L1 expression is characteristic of a subset of aggressive B-cell lymphomas and virus-associated malignancies. Clinical Cancer Research. 2013; 19:3462–3473.
13. Fang W, Zhang J, Hong S, Zhan J, Chen N, Qin T, Tang Y, Zhang Y, Kang S, Zhou T, Wu X, Liang W, Hu Z, et al. EBV-driven LMP1 and IFN-gamma up-regulate PD-L1 in nasopharyngeal carcinoma: Implications for oncotargeted therapy. Oncotarget. 2014; 5:12189–12202. doi: 10.18632/oncotarget.2608.
14. Lyford-Pike S, Peng S, Young GD, Taube JM, Westra WH, Akpeng B, Bruno TC, Richmon JD, Wang H, Bishop JA, Chen L, Drake CG, Topalian SL, Pardoll DM, Pai SI. Evidence for a role of the PD-1:PD-L1 pathway in immune resistance of HPV-associated head and neck squamous cell carcinoma. Cancer research. 2013; 73:1733–1741.
15. Yang W, Song Y, Lu YL, Sun JZ, Wang HW. Increased expression of programmed death (PD)-1 and its ligand PD-L1 correlates with impaired cell-mediated immunity in high-risk human papillomavirus-related cervical intraepithelial neoplasia. Immunology. 2013; 139:513–522.
16. Bellucci R, Martin A, Bommarito D, Wang K, Hansen SH, Freeman GJ, Ritz J. Interferon-gamma-induced activation of JAK1 and JAK2 suppresses tumor cell susceptibility to NK cells through upregulation of PD-L1 expression. Oncoimmunology. 2015; 4:e1008824.
17. Movva S, Wen W, Chen W, Millis SZ, Gatalica Z, Reddy S, von Mehren M, Van Tine BA. Multi-platform profiling of over 2000 sarcomas: identification of biomarkers and novel therapeutic targets. Oncotarget. 2015; 6:12234–12247. doi: 10.18632/oncotarget.3498.
18. Velcheti V, Rimm DL, Schalper KA. Sarcomatoid lung carcinomas show high levels of programmed death ligand-1 (PD-L1). Journal of thoracic oncology. 2013; 8:803–805.
19. Cao Y, Zhang L, Kamimura Y, Ritprajak P, Hashiguchi M, Hirose S and Azuma M. B7-H1 overexpression regulates epithelial-mesenchymal transition and accelerates carcinogenesis in skin. Cancer research. 2011; 71:1235–1243.
20. Cancer Genome Atlas N. Comprehensive genomic characterization of head and neck squamous cell carcinomas. Nature. 2015; 517:576–582.
21. Seiwert TY, Zuo Z, Keck MK, Khattri A, Pedamallu CS, Stricker T, Brown C, Pugh TJ, Stojanov P, Cho J, Lawrence MS, Getz G, Bragelmann J, DeBoer R, Weichselbaum RR, Langerman A, et al. Integrative and Comparative Genomic Analysis of HPV-Positive and HPV-Negative Head and Neck Squamous Cell Carcinomas. Clinical Cancer Research. 2015; 21:632–641.
22. Jordan RC, Lingen MW, Perez-Ordonez B, He X, Pickard R, Koluder M, Jiang B, Wakely P, Xiao W, Gillison ML. Validation of methods for oropharyngeal cancer HPV status determination in US cooperative group trials. The American journal of surgical pathology. 2012; 36:945–954.
23. Badoual C, Hans S, Merillon N, Van Ryswick C, Ravel P, Benhamouda N, Levionnois E, Nizard M, Si-Mohamed A, Besnier N, Gey A, Rotem-Yehudar R, Pere H, Tran T, Guerin CL, Chauvat A, et al. PD-1-expressing tumor-infiltrating T cells are a favorable prognostic biomarker in HPV-associated head and neck cancer. Cancer research. 2013; 73:128–138.
24. Ukpo OC, Thorstad WL, Lewis JS, Jr. B7-H1 expression model for immune evasion in human papillomavirus-related oropharyngeal squamous cell carcinoma. Head and neck pathology. 2013; 7:113–121.
25. Keck MK, Zuo Z, Khattri A, Stricker TP, Brown CD, Imanguli M, Rieke D, Endhardt K, Fang P, Bragelmann J, DeBoer R, El-Dinali M, Aktolga S, Lei Z, Tan P, Rozen SG, et al. Integrative Analysis of Head and Neck Cancer Identifies Two Biologically Distinct HPV and Three Non-HPV Subtypes. Clinical Cancer Research. 2015; 21:870–881.
26. Byers LA, Diao L, Wang J, Saintigny P, Girard L, Peyton M, Shen L, Fan Y, Giri U, Tumula PK, Nilsson MB, Gudikote J, Tran H, Cardnell RJ, Bearss DJ, Warner SL, et al. An epithelial-mesenchymal transition gene signature predicts resistance to EGFR and PI3K inhibitors and identifies Axl as a therapeutic target for overcoming EGFR inhibitor resistance. Clinical Cancer Research. 2013; 19:279–290.
27. Barretina J, Caponigro G, Stransky N, Venkatesan K, Margolin AA, Kim S, Wilson CJ, Lehar J, Kryukov GV, Sonkin D, Reddy A, Liu M, Murray L, Berger MF, Monahan JE, Morais P, et al. The Cancer Cell Line Encyclopedia enables predictive modelling of anticancer drug sensitivity. Nature. 2012; 483:603–607.
28. Rizvi NA, Hellmann MD, Snyder A, Kvistborg P, Makarov V, Havel JJ, Lee W, Yuan J, Wong P, Ho TS, Miller ML, Rekhtman N, Moreira AL, Ibrahim F, Bruggeman C, Gasmi B, et al. Cancer immunology. Mutational landscape determines sensitivity to PD-1 blockade in non-small cell lung cancer. Science. 2015; 348:124–128.
29. Tumeh PC, Harview CL, Yearley JH, Shintaku IP, Taylor EJ, Robert L, Chmielowski B, Spasic M, Henry G, Ciobanu V, West AN, Carmona M, Kivork C, Seja E, Cherry G, Gutierrez AJ, et al. PD-1 blockade induces responses by inhibiting adaptive immune resistance. Nature. 2014; 515:568–571.
30. Jiang X, Zhou J, Giobbie-Hurder A, Wargo J, Hodi FS. The activation of MAPK in melanoma cells resistant to BRAF inhibition promotes PD-L1 expression that is reversible by MEK and PI3K inhibition. Clinical Cancer Research. 2013; 19:598–609.
31. Zhang P, Su DM, Liang M, Fu J. Chemopreventive agents induce programmed death-1-ligand 1 (PD-L1) surface expression in breast cancer cells and promote PD-L1-mediated T cell apoptosis. Molecular immunology. 2008; 45:1470–1476.
32. Ward MJ, Thirdborough SM, Mellows T, Riley C, Harris S, Suchak K, Webb A, Hampton C, Patel NN, Randall CJ, Cox HJ, Jogai S, Primrose J, Piper K, Ottensmeier CH, King EV, et al. Tumour-infiltrating lymphocytes predict for outcome in HPV-positive oropharyngeal cancer. British journal of cancer. 2014; 110:489–500.
33. Rooney MS, Shukla SA, Wu CJ, Getz G, Hacohen N. Molecular and genetic properties of tumors associated with local immune cytolytic activity. Cell. 2015; 160:48–61.
34. Velcheti V, Schalper KA, Carvajal DE, Anagnostou VK, Syrigos KN, Sznol M, Herbst RS, Gettinger SN, Chen L, Rimm DL. Programmed death ligand-1 expression in non-small cell lung cancer. Laboratory investigation. 2014; 94:107–116.
35. Thompson RH, Gillett MD, Cheville JC, Lohse CM, Dong H, Webster WS, Krejci KG, Lobo JR, Sengupta S, Chen L, Zincke H, Blute ML, Strome SE, Leibovich BC, Kwon ED. Costimulatory B7-H1 in renal cell carcinoma patients: Indicator of tumor aggressiveness and potential therapeutic target. Proceedings of the National Academy of Sciences of the United States of America. 2004; 101:17174–17179.
36. Hino R, Kabashima K, Kato Y, Yagi H, Nakamura M, Honjo T, Okazaki T, Tokura Y. Tumor cell expression of programmed cell death-1 ligand 1 is a prognostic factor for malignant melanoma. Cancer. 2010; 116:1757–1766.
37. Droeser RA, Hirt C, Viehl CT, Frey DM, Nebiker C, Huber X, Zlobec I, Eppenberger-Castori S, Tzankov A, Rosso R, Zuber M, Muraro MG, Amicarella F, Cremonesi E, Heberer M, Iezzi G, et al. Clinical impact of programmed cell death ligand 1 expression in colorectal cancer. European journal of cancer. 2013; 49:2233–2242.
38. Ang KK, Harris J, Wheeler R, Weber R, Rosenthal DI, Nguyen-Tan PF, Westra WH, Chung CH, Jordan RC, Lu C, Kim H, Axelrod R, Silverman CC, Redmond KP, Gillison ML. Human papillomavirus and survival of patients with oropharyngeal cancer. The New England journal of medicine. 2010; 363:24–35.
39. Chung CH, Zhang Q, Kong CS, Harris J, Fertig EJ, Harari PM, Wang D, Redmond KP, Shenouda G, Trotti A, Raben D, Gillison ML, Jordan RC, Le QT. p16 Protein Expression and Human Papillomavirus Status As Prognostic Biomarkers of Nonoropharyngeal Head and Neck Squamous Cell Carcinoma. J Clin Oncol. 2014; 32:3930–3938.
40. Yang MH, Chang SY, Chiou SH, Liu CJ, Chi CW, Chen PM, Teng SC, Wu KJ. Overexpression of NBS1 induces epithelial-mesenchymal transition and co-expression of NBS1 and Snail predicts metastasis of head and neck cancer. Oncogene. 2007; 26:1459–1467.
41. Schumacher TN, Schreiber RD. Neoantigens in cancer immunotherapy. Science. 2015; 348:69–74.
42. Azuma K, Ota K, Kawahara A, Hattori S, Iwama E, Harada T, Matsumoto K, Takayama K, Takamori S, Kage M, Hoshino T, Nakanishi Y, Okamoto I. Association of PD-L1 overexpression with activating EGFR mutations in surgically resected nonsmall-cell lung cancer. Annals of oncology. 2014; 25:1935–1940.
43. Ota K, Azuma K, Kawahara A, Hattori S, Iwama E, Tanizaki J, Harada T, Matsumoto K, Takayama K, Takamori S, Kage M, Hoshino T, Nakanishi Y, Okamoto I. Induction of PD-L1 Expression by the EML4-ALK Oncoprotein and Downstream Signaling Pathways in Non-Small Cell Lung Cancer. Clinical Cancer Research. 2015; 21:4014–21. doi: 10.1158/1078-0432. CCR-15-0016.
44. Ock CY, Keam B, Lim Y, Kim TM, Lee SH, Kwon SK, Hah JH, Kwon TK, Kim DW, Wu HG, Sung MW, Heo DS. Effect of induction chemotherapy on survival in locally advanced head and neck squamous cell carcinoma treated with concurrent chemoradiotherapy: Single center experience. Head & neck. 2016; 38:277–284.
45. Lim Y, Keam B, Koh Y, Kim TM, Lee SH, Hah JH, Kwon TK, Kim DW, Wu HG, Sung MW, Heo DS, Kim KH. Clinical outcomes of radiation-based locoregional therapy in locally advanced head and neck squamous cell carcinoma patients not responding to induction chemotherapy. Oral surgery, oral medicine, oral pathology and oral radiology. 2013; 116:55–60.
46. Gronhoj Larsen C, Gyldenlove M, Jensen DH, Therkildsen MH, Kiss K, Norrild B, Konge L, von Buchwald C. Correlation between human papillomavirus and p16 overexpression in oropharyngeal tumours: a systematic review. British journal of cancer. 2014; 110:1587–1594.
47. Simon R, Lam A, Li MC, Ngan M, Menenzes S, Zhao Y. Analysis of gene expression data using BRB-ArrayTools. Cancer informatics. 2007; 3:11–17.
48. Eisen MB, Spellman PT, Brown PO, Botstein D. Cluster analysis and display of genome-wide expression patterns. Proceedings of the National Academy of Sciences of the United States of America. 1998; 95:14863–14868.
49. Lee JS, Chu IS, Mikaelyan A, Calvisi DF, Heo J, Reddy JK, Thorgeirsson SS. Application of comparative functional genomics to identify best-fit mouse models to study human cancer. Nature genetics. 2004; 36:1306–1311.
50. Lee KW, Lee SS, Kim SB, Sohn BH, Lee HS, Jang HJ, Park YY, Kopetz S, Kim SS, Oh SC, Lee JS. Significant association of oncogene YAP1 with poor prognosis and cetuximab resistance in colorectal cancer patients. Clinical Cancer Research. 2015; 21:357–364.
51. Ramaswamy S, Tamayo P, Rifkin R, Mukherjee S, Yeang CH, Angelo M, Ladd C, Reich M, Latulippe E, Mesirov JP, Poggio T, Gerald W, Loda M, Lander ES, Golub TR. Multiclass cancer diagnosis using tumor gene expression signatures. Proceedings of the National Academy of Sciences of the United States of America. 2001; 98:15149–15154.