
Introduction
Non-small cell lung cancer (NSCLC) remains one of the leading causes of cancer death, with a high mortality rate worldwide[1, 2], accounting for over one quarter of cancer deaths in 2014 [1-3]. Recently, many studies have reported promising biomarkers for differential diagnosis of NSCLC [4 -13]. However, accurate biomarkers of NSCLC still remain largely unexplored.
Currently, the discovery of microRNAs (miRNAs), a class of small non-coding RNAs, has opened up a new perspective for cancer prediction and provides a novel approach for the initial screening of cancer, including NSCLC [14][4]. Emerging evidence has reported that miRNAs are remarkably aberrant in tumors [15-17][5-7], and may be involved in initiation and progression of NSCLC [18-20][8-10]; in addition, due to their inherent nature, miRNAs seem to remain highly stable and provide more accurate prediction factors for clinical specimens [21, 22][11, 12]. The above discovery shows that miRNAs are suitable as biomarkers for the diagnosis of NSCLC.
Unfortunately, several conflicting results are still present in independent studies [23, 24][13, 14], which are often explained by different miRNA profiling systems and platforms. Although they separately have promising value for cancer differentiation, a systematic analysis of these collected data may be essential for further exploration of the applicability of miRNAs as biomarkers for the prediction of NSCLC.
Thus, our meta-analysis answers three questions: (1) whether some of the miRNAs could differentiate tissues as NSCLC or control, (2) whether there were relationships between promising miRNAs with target genes in functional annotation and pathways, and (3) whether genes targeted by these miRNAs are associated with NSCLC initiation and progression.
Results
Regulation and predictive value of miRNA expression in lung cancer tissue
To determine whether the expression of miRNAs could be used to identify NSCLC and control cases, our initial search yielded 19 relevant data sets. After removing 3 duplicated data sets and 11 unqualified data sets (Figure 1), three primary data sets(GSE15008, GSE36681, GSE29248) as a training cohort were further examined in this meta-analysis, which was comprised of a total of 263 cancer tissue samples and 236 control tissue samples. We received another two complete sets of miRNA data (GSE51853, GSE19945) as a validation cohort, which was composed of a total of 127 tissue samples. The five lung cancer microarray data sets was used to used to analyze the miRNA expression profiles of NSCLC tissues relative to their normal controls. The characteristics of these samples are shown (Table 2, Table 4). Microarray data sets were normalized by control normalization algorithm using Agilent’s GeneSpring 13.0. After normalization, batch effect was removed (Figure 2).
Table 1: Top 14 Significantly differentiated miRNAs in lung cancer
Gene name |
P-value |
FC(abs) |
FDR |
Regulation |
has-miR-9 |
4.18E-11 |
2.002815 |
2.09E-09 |
up |
has-miR-584 |
2.26E-13 |
1.568074 |
6.78E-12 |
down |
has-miR-708 |
1.27E-10 |
1.553729 |
1.016E-08 |
up |
has-mir-218 |
3.73E-13 |
1.608805 |
7.46E-12 |
down |
has-miR-296-3P |
5.64E-11 |
1.591363 |
1.974E-09 |
up |
has-miR-30b |
1.25E-06 |
1.724754 |
0.00003875 |
down |
has-miR-522 |
1.37E-09 |
1.603749 |
3.699E-08 |
down |
has-miR-486-5P |
9.52E-07 |
1.759159 |
0.000021896 |
down |
has-miR-34C-3P |
1.49E-11 |
1.737232 |
2.831E-10 |
down |
has-miR-892b |
9.28E-13 |
2.103988 |
1.392E-11 |
up |
has-miR-34b |
1.30E-11 |
1.872982 |
1.43E-10 |
down |
has-miR-516b |
1.25E-10 |
1.561706 |
8.75E-10 |
down |
has-mir-140-5p |
1.77E-08 |
2.321465 |
5.31E-08 |
up |
has-mir-592 |
4.98E-12 |
1.635831 |
4.98E-12 |
down |
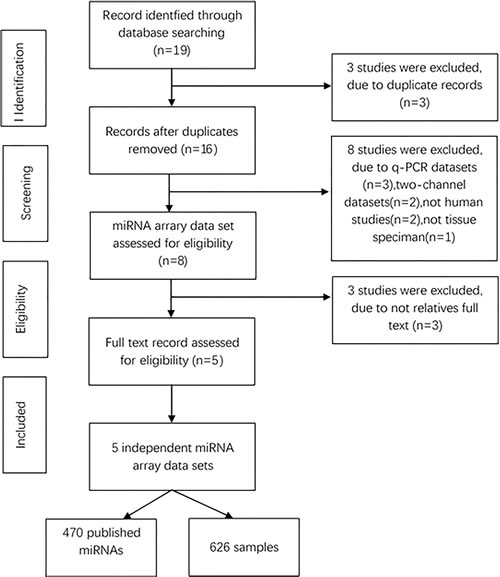
Figure 1: Flowchart of miRNAs studies in this meta-analysis.
470 overlapped miRNAs were differentially regulated by cancer cases with a cut off p-value of 0.05 and fold change of 1.5. Meanwhile we developed an algorithm based on the Weka tool to construct miRNAs predictive models by data mining; subsequently, we selected 14 miRNAs as a new integrated training set to construct a predictive model.
The 14 miRNAs model performed stably in distinguishing between NSCLC and control cases, with a sensitivity of 82.6%, a specificity of 89.9%, a positive predictive value (PPV) of 87.5%, and a negative predictive value (NPV) of 85.8%. The AUC of the training set was 0.913. Up-regulated miRNAs (miR-9, miR-708, miR-296-3p, miR-892b, miR-140-5P) and nine down-regulated (miR-584, miR-218, miR-30b, miR-522, miR486-5P, miR-34c-3p, miR-34b, miR-516b, miR-592) in the 14 top miRNAs were significantly regulated by tumor cases (Table 1). Moreover, in validation, the 14 miRNAs model produced prediction sensitivity that increased continually and significantly: SE=88.14%, SP=91.18%, PPV=89.66%, NPV=89.86%, AUC=0.905
A study [25] reported that the target genes of multiple miRNAs play a crucial role in controlling stimulatory or inhibitory activity in tumorigenesis. Thus, the potential target genes of these miRNAs need to be identified.
Table 2: all samples ' characteristics of microarray data sets used in both training and validation stage |
||||
Training |
Validation |
|||
Cancer (236) |
Healthy (136) |
Cancer (88) |
Healthy (39) |
|
Sex |
||||
Male |
136 |
87 |
57 |
22 |
Female |
100 |
49 |
31 |
17 |
Age, yr |
||||
Median |
67 |
63 |
67 |
58 |
SD |
8.26 |
10.24 |
8.12 |
10.94 |
Range |
46 - 72 |
30 - 70 |
43 - 71 |
38 - 64 |
Smoking history, pack-years |
||||
Median |
32 |
51 |
45 |
33 |
SD |
22.1 |
23.8 |
25.8 |
32.2 |
Range |
3 - 77 |
5 - 56 |
1 - 76 |
5 - 65 |
Tumor subtype |
||||
Adenocarcinoma |
98 |
58 |
||
Squamous |
138 |
30 |
||
Tumor stage |
||||
Stage I |
130 |
49 |
||
Stage II |
106 |
39 |
||
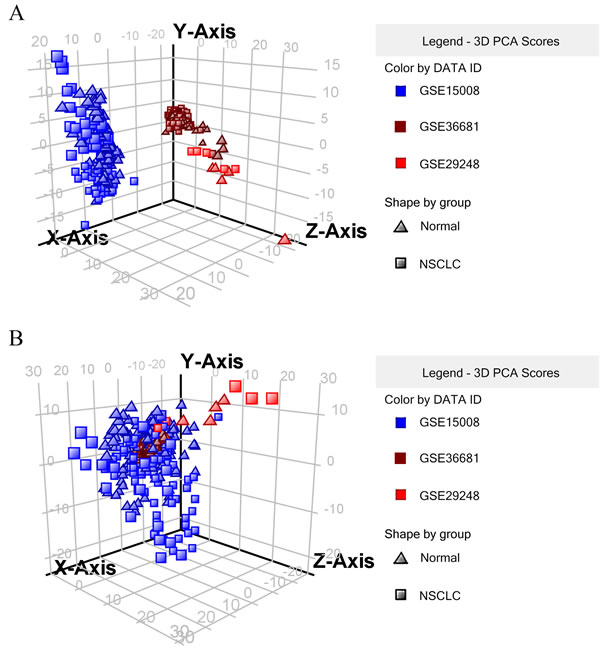
Figure 2: 3D plot of principal components analytic scores (6 = GSE15008, 9 = GSE36681, 10 = GSE29248). A. raw data without normalization, B. with normalization and batch effect removal.
MiRNA target prediction and functional analysis
In order to identify potential miRNA target genes, we first queried the three most popular computational databases MiRBase [26], PicTar [27], and Targetscan [28] to scan target genes on the principle of mutual recognition. 1743 overlapping target genes related to the top 14 miRNAs emerged as a particular group. Then physiological pathways of target genes were analyzed using the Ingenuity Pathway Analysis (IPA) tool.
Interestingly, the top 10 significant pathways which are shown in Figure 3 were enriched by the 1473 genes associated with cancer initiation and progression. Among them, Axonal Guidance Signaling Pathway, Insulin-like growth factor-1(IGF-1) Signaling, Integrin Signaling Pathway, and Ephrin Receptor Signaling Pathway were highly associated with NSCLC initiation and progression. The Axonal Guidance Signaling Pathway involves 77 target genes with NSCLC, the IGF-1 Signaling Pathway involves 22, the Integrin Pathway involves 35, and Ephrin Receptor Signaling Pathway involves 31. In general, these genes were regulated by each other either directly or indirectly. Yet the underlying values for these genes associated with pathways have not been clearly illuminated. Thus, it is necessary to investigate the interaction between target genes and the 14 significant miRNAs.
Table 3: Top 20 Significantly differentiated target Genes in lung cancer
|
Gene name |
Training set |
Testing set |
||||
P-value |
FC |
FDR |
P-value |
FC |
FDR |
|
KIAA1462 |
2.23E-45 |
-3.41 |
1.72E-44 |
1.28E-20 |
-3.26 |
9.84E-20 |
MMD |
2.58E-41 |
-4.46 |
2.17E-40 |
5.85E-16 |
-3.11 |
9.36E-15 |
CBX7 |
2.57E-33 |
-2.11 |
2.34E-32 |
5.42E-23 |
-2.19 |
1.19E-21 |
FAP |
1.23E-27 |
3.07 |
9.47E-27 |
8.36E-15 |
3.01 |
1.08E-13 |
GPM6A |
7.11E-61 |
-7.49 |
5.98E-60 |
2.15E-23 |
-4.40 |
1.66E-22 |
FAM107A |
2.17E-46 |
-6.39 |
1.67E-45 |
2.05E-21 |
-3.16 |
1.87E-20 |
SEMA6A |
3.49E-39 |
-2.98 |
2.69E-38 |
8.42E-04 |
-1.59 |
6.48E-03 |
THBD |
1.91E-38 |
-3.19 |
1.34E-37 |
5.89E-18 |
-2.41 |
5.36E-17 |
COL1A1 |
9.58E-37 |
3.06 |
8.72E-36 |
1.75E-05 |
2.33 |
1.05E-03 |
STK39 |
1.24E-35 |
2.31 |
8.67E-35 |
3.62E-08 |
1.49 |
2.78E-07 |
PDK4 |
8.50E-33 |
-3.72 |
7.74E-32 |
3.36E-11 |
-2.72 |
2.82E-10 |
LIMCH1 |
1.49E-32 |
-2.52 |
1.35E-31 |
8.04E-16 |
-2.47 |
6.76E-15 |
OLFML1 |
2.60E-30 |
-2.60 |
2.18E-29 |
3.55E-18 |
-2.56 |
2.73E-17 |
TOX3 |
3.66E-26 |
3.93 |
3.07E-25 |
2.13E-09 |
3.50 |
1.79E-08 |
GREM1 |
2.28E-24 |
6.76 |
1.75E-23 |
5.18E-05 |
2.06 |
3.99E-04 |
SLC2A1 |
1.19E-23 |
2.56 |
8.32E-23 |
2.19E-06 |
1.76 |
1.61E-05 |
TTK |
1.25E-23 |
3.19 |
9.66E-23 |
2.39E-11 |
2.61 |
2.17E-10 |
OLR1 |
6.33E-20 |
-3.22 |
5.76E-19 |
1.24E-07 |
-2.07 |
1.13E-06 |
SIX1 |
5.12E-18 |
2.46 |
3.59E-17 |
2.74E-08 |
2.03 |
2.11E-07 |
IGF2BP3 |
2.04E-13 |
2.01 |
1.71E-12 |
9.76E-11 |
2.66 |
8.88E-10 |
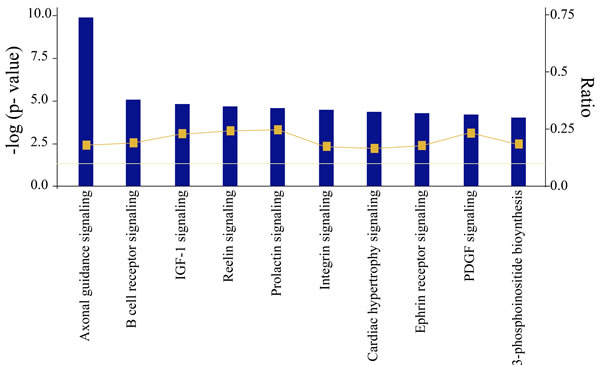
Figure 3: Most significant canonical pathways of putative target genes of lung cancer regulated 14 promising miRNAs. (The threshold lines indicate 5% P-value. The bigger the -log (p-value) of pathway is, the more significantly the pathway is adjusted).
Validate the 14 significant miRNAs using gene microarray data, and explore the correlation with target genes
In this meta-analysis, the predicted performance of miRNAs was further verified by gene expression data sets. After excluding those studies according to the previous including criteria, 6 studies remained. Gene expression data sets (GSE1987, GSE43458, GSE33532 (paired), GSE2514, GSE19804, GSE33532 (unpaired)) with 7254 common genes were extracted from Gene Expression Omnibus, which included 195 NSCLC and 178 normal cases. After normalizing the raw data, controlling sample quality, correcting background, and performing log2 transformation, the miRNAs were filtered according to a t-test p-value cut off of 0.05 and a 1.5 fold change cut off. A Bayesian statistical analysis with 5% false discovery rate (FDR) was selected as one of three criteria for significant variable value.
Statistical analysis identified 1263 differentially expressed genes (p < 0.05, FC > 1.5) in NSCLC versus normal cases. Moreover, we found 900 genes with FDR < 0.05 and FC > 1.5 targeted by 14 miRNAs, in which 100 genes had an FDR < 0.05 and FC > 2.0. Among them 71 genes were down-regulated and 29 genes were up-regulated in NSCLC cases. The 100 gene list of better FDR score were uploaded into the IPA tool. A gene network was computed (Figure 4). Nodes colored in red and green indicate up-regulated and down-regulated gene respectively. We could clearly see the gene interaction between the two regulation directions. The top 20 significant genes are listed in Table 3.
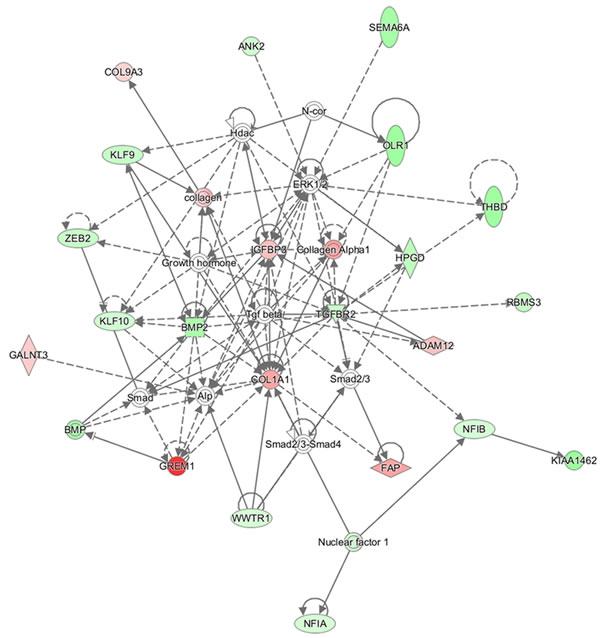
Figure 4: Gene network using target genes from 14 promising miRNAs. The network was produced by IPA. Nodes colored in red or green indicate up-regulated and down-regulated gene, respectively.
To further assess the prediction abilities of gene cross-validation, we divided six data sets which were retrieved from PubMed into two sets (training set, testing set) according to sample size. The training set was composed of 3 paired specimens (GSE19804, GSE33532, GSE43458) containing a total of 230 samples respectively. The remaining 3 data sets for testing were comprised of 3 unpaired specimens (GSE1987, GSE43458, GSE2514) containing a total of 143 samples. The characteristics of these samples are shown in Table 3.
Table 4: Characteristics of the 9 studies in our meta-analysis of diagnosis NSCLC using microarray data sets
Database |
GEO |
Platform |
PMID |
Ethnicity |
No. of miRNA/gene |
NSCLC cases (No) |
Healthy cases(No) |
Analysis miRNA/Gene |
1 |
GSE15008 |
GPL8176 |
21890451 |
China |
1146 |
174 |
201 |
miRNA |
2 |
GSE36681 |
GPL8179 |
22573352 |
USA |
1146 |
56 |
56 |
miRNA |
3 |
GSE29248 |
GPL8179 |
22046296 |
China |
1146 |
6 |
6 |
miRNA |
4 5 6 |
GSE51853 GSE19945 GSE1987 |
GPL7341 GPL9948 GPL91 |
24903339 NA 17258348 |
Japan Japan Israel |
1146 1146 10610 |
80 8 25 |
31 8 9 |
miRNA miRNA GENE (testing) |
7 |
GSE33532 |
GPL570 |
NA |
Germany |
25906 |
20 |
19 |
GENE (testing) |
8 |
GSE2514 |
GPL8300 |
16314486 |
USA |
8943 |
30 |
40 |
GENE (testing) |
9 |
GSE19804 |
GPL570 |
20802022 |
China |
54656 |
60 |
60 |
GENE (training) |
10 |
GSE33532 |
GPL570 |
NA |
Germany |
25906 |
20 |
20 |
GENE (training) |
11 |
GSE43458 |
GPL6244 |
23659968 |
USA |
33251 |
40 |
30 |
GENE (training) |
Meanwhile we developed an algorithm based on the Weka tool to construct gene predictive models by data mining; subsequently, we selected 4 core genes as a new integrated training set to construct a predictive model. The 4 gene model performed stably in distinguishing between NSCLC and control cases, with a sensitivity of 96.7%, a specificity of 88.1%, a positive predictive value (PPV) of 89.9%, and a negative predictive value (NPV) of 96.0%. The AUC of the training set was 0.984. Moreover, in validation, the 4 genes model produced prediction sensitivity that increased continually and significantly: SE = 98.7%, SP = 82.4%, PPV = 86.1%, NPV = 98.3%, AUC = 0.933 (Table 5). In addition, hierarchical cluster analysis showed that the samples of training set and testing set were also clearly separated into 2 main classes (Figure 5). This shows that these core genes can discriminate between NSCLC cases and normal cases.
Table 5: Significantly differentiated target genes in lung cancer
Group(gene name) |
SE |
SP |
PPV |
NPV |
AUC |
Training set (MMD,CBX7, FAP,KIAA1462) |
0.967 |
0.881 |
0.899 |
0.96 |
0.984 |
Testing set (MMD,CBX7, FAP,KIAA1462) |
0.987 |
0.824 |
0.861 |
0.983 |
0.933 |
SE: sensitivity SP: specificity PPV: positive predictive value NPV: negative predictive value AUC: area under the curve
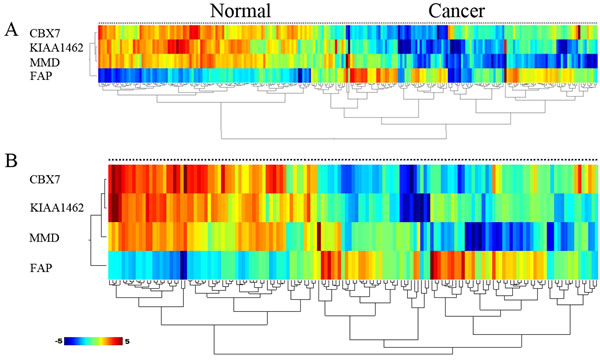
Figure 5: Hierarchical clustering analysis of two sets based on 4 core genes was performed using samples from (A) training set and (B) testing set. The relative level of gene expression is indicted by the color scale at the bottom word “c” on the each clustering plot represent cancer sample. Word “n” on each clustering plot represent control sample.
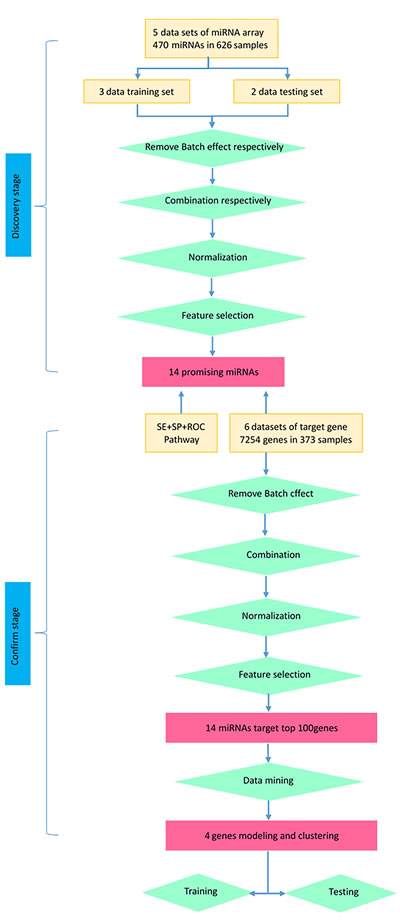
Figure 6: Flowchart of studies (including miRNA and target gene) in this research.
Verification of microarray responses using real time QRT-PCR to verify the credibility of microarray and gene network modeling results
To verify our microarray meta-analysis results, we chose two cell lines, A549 lung adenocarcinoma cell lines and normal lung epithelial cells NL20, to conduct the experiments. We selected four miRNAs and all the four gene markers to perform real time quantitative PCR (QRT-PCR) in the two cell line. As illustrated in Figure 8, compared to normal control cell lines, has-miR-9, has-miR-296-3P, and the gene FAP were up-regulated whereas has-miR-522, has-miR-34b, the gene KIAA1462, the gene MMD and the gene CBX7 were down-regulated.
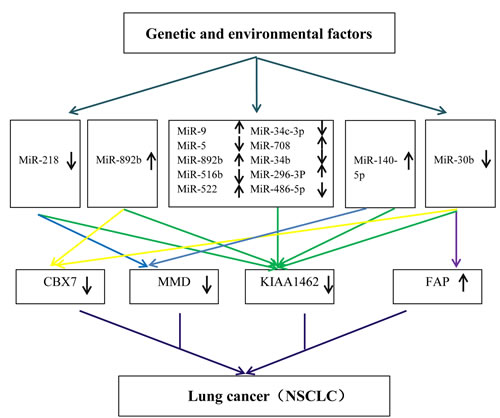
Figure 7: A hypothetical model to explain the molecular mechanisms of NSCLC based on enrolled data sets.
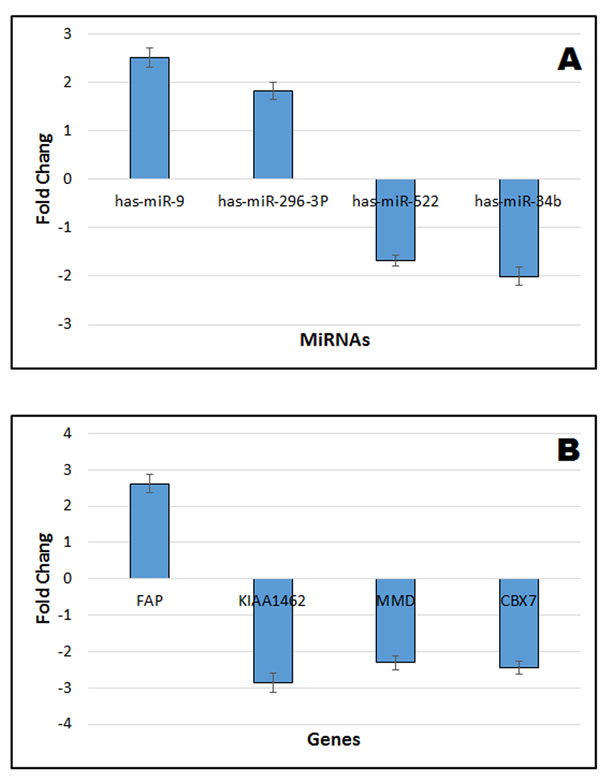
Figure 8: Verification of miRNA and gene expression of integrative microarray results using real time QRT-PCR. A. Verification of 4 miRNA results. B. Verification of 4 gene results. The positive value indicates up-regulated fold change of lung cancer cell line A549 compared to normal lung epithelial cells NL20. The negative value indicates the down-regulated fold change of lung cancer cell line A549 compared to normal lung epithelial cells NL20. Values refer to the mean ± SD of three independent samples, each run in triplicate.
Discussion
In our study (Figure 6), we focused primary on whether promising miRNAs could act as accurate biomarkers to discriminate NSCLC from normal cases by taking advantage of miRNA array data sets. We selected 5 microarray data sets and set out to systematically identify promising miRNAs that distinguish NSCLC and control.
The top 14 miRNAs we found (has-miR-9, has-miR-584, has-miR-708, has-miR-218, has-miR-296-3p, has-miR-30b, has-miR-522, has-miR-486-5p, has-miR-34c-3p, has-miR-892b, has-miR-34b, has-miR-516b, has-miR-140-5p, has-miR-592), as a combination of miRNAs, has more accurate predicted value in distinguishing cancer cases with control cases as measured by higher sensitivity, higher specificity, and statistically significant pathways. Aberrant expressions of 12 miRNAs (miR-9, miR-584, miR-218, miR-296-3p, miR-486-5p, miR-34, miR-592, miR-30b, miR-708, miR-522, miR-516b, and miR-140-5p) were reported as potential biomarkers with diagnostic value in cancer patients, except for miR-516b and miR-892b. Aberrant expression of miR-9 contributes to tumor cell invasion, partly through directly down-regulating CBX7 protein expression [29]. MiR-140-5p significantly reduces MMD protein levels in NSCLC cells leading to inhibit cell proliferation by regulating Erk1/2 signaling [30][27]. Several miRNAs such as miR-584, miR-218, miR-486-5p, miR-34, miR-592, miR-30b, miR-522, were reported respectively to target CMBL/ PIP4K2A [31][28], Robol [29]/BMI [32, 33], ARHGAP5 [34] [31], KRAS/ PDGFR [35], BMI1 [33], CCND3 [36], Rab18 [37], PHLPP1 [38] responsible for cell proliferation migration and invasion. It is noteworthy that miR-708 and miR-296-3p were dysregulated in differential studies. Guo P et al. [36] reported that miR-708 positively influences cell proliferation, invasion, and migration by inhibiting the expression of Akt1, CCND1, EZH2, MMP2, Parp-1, and Bcl2 which are linked to an increase in death [39]. Lin KT et al. [37] mentioned that miR-708, through suppression of Rap1B, results in the reduction of integrin-mediated focal adhesion formation and the inhibition of cell migration and impaired metastasis, and that patients with high miR-708 show significantly better survival [40]. Similarly, Bai Y et al. confirmed that miR-296-3p decreases cancer cell growth by repression of EAG1 [41]. Liu X et al. [39] pointed out that miR-296-3p inhibits ICAM1 expression leading to tumor metastasis [42] Overall, this finding suggested that alterations of these genes/pathways represent meaningful risk factors in NSCLC.
In order to explore these interactions between miRNAs and target genes, we decided to perform a pathway analysis using the list of overlapped target genes referenced by the three computational databases. The top 10 significant pathways enriched 1473 genes associated with cancer initiation and progression.
In our following study of target genes, we took advantage of statistical computer tools to mine some available data for target genes, and then subsequently hold overlapping genes. We found that over half of the target genes with better FDR and higher FC were involved in NSCLC. The gene networks showed that many of these genes related to NSCLC, and interacted with each other.
To seek genes offering greater sensitivity and specificity, a statistical model based on six gene data sets was built. Finally, we selected the 4-gene index (KIAA, MMD, CBX7, and FAP) as a novel biomarker for diagnostic prediction of NSCLC. The index achieved 96.7% sensitivity, 88.1% specificity, 89.9% PPV, and 96.0% NPV in the training set, and with higher significance in testing set (SE = 98.7%, SP = 82.4%, PPV = 86.1%, NPV = 98.3%). Emerging reports [27, 40, 41] showed that MMD, CBX7, FAP played an important role in the proliferation of lung cancer [30, 43, 44]. It is noteworthy that the gene KIAA has never been reported as related to cancer, serving only as a risk factor in coronary artery disease [45][42]. Our study showed KIAA was frequently directly or indirectly associated with the 14 promising miRNAs in NSCLC. Therefore, based on both miRNAs and target genes level, we generated a hypothetical model that can explain genetic and environmental factors that trigger NSCLC (Figure 7). Genetic and environmental factors could affect the expression of miR-9, miR-584, miR-708, miR-218, miR-296-3p, miR-30b, miR-522, miR-486-5p, miR-34c-3p, miR-892b, miR-34b, miR-516b, miR-140, miR-592, then that of KIAA, MMD, CBX7, and FAP, and through interaction finally result in tumorigenesis. As illustrated in our experiment, has-miR-9, has-miR-296-3P, and the gene FAP were up-regulated whereas has-miR-522, has-miR-34b, the gene KIAA1462, the gene MMD and the gene CBX7 were down-regulated. The QRT-PCR results were consistent with the microarray meta-analysis results.
Overall, our results not only demonstrate that combining miRNAs and target genes improves our ability to identify promising biomarkers, but it also contributes to greater insight on new potential mechanisms and functions for predicting NSCLC.
Although we tried to avoid bias in our study, certain limitations still need to be considered while interpreting the result of our study. More research with experimental validation is clearly needed in order to find promising miRNAs and target genes using microarray platform to real-time RT-PCR assays, allowing broader accession and utilization in future clinical application. Third, further work is needed to investigate the relationship between miRNAs and genes.
Despite the above limitations, our study is the first meta-analysis to predict NSCLC from microarray data sets at both miRNA and gene level. This study also avoids distinguishing expression patterns in promising target genes that contradict those of the miRNAs. Detecting NSCLC using miRNAs and core genes still needs further validation as well.
Materials and methods
Search strategy, eligibility and data extraction
Microarray data sets were extracted from NCBI and Gene Expression Omnibus by means of the MESH terms ‘lung cancer/lung neoplasm/NSCLC’ and ‘microRNAs/miRNA’, in combination with the keyword ‘lung tumor/lung neoplasm/NSCLC’ and ‘gene expression/target gene’, without restriction of language or publication.
Three reviewers (Ling Hu, Junmei Ai, and Hui Long) independently extracted the following data from all eligible studies. Eligible data sets had to meet the following criteria: all sample data sets (i) were from humans, (ii) focused on the diagnostic potential of miRNAs/genes for LC tissue, (iii) included microRNA array, (iv) came from raw data rather than matrix data/normalized data, and (v) were part of studies with included false discovery rate (FDR) and fold-change (FC) calculations. All data sets used in this study are summarized in Table 4.
MiRNAs and genes microarray data processing
The scale of miRNAs/genes expression in microarray data sets was consistently different due to different platforms and different batches [46][15]. All statistical data sets were normalized and standardized to be approximately equal in scale and normally distributed. There is general agreement on the normalization of single miRNA/gene expression using the median value of expression of all miRNAs/genes of each data set [47, 48][16, 17], and the expression of each case in each data set was compared with the respective control samples. We combined log2 transformed data sets from different platforms into three: the miRNA data set, a paired gene data set, and an unpaired gene data set. 5% FDR in Bayesian statistical analysis was used to find statistically significant differential miRNAs between cancer and control cases.
Verification of miRNA and gene expression of integrative microarray results using real time QRT-PCR
Cell culture
A549 lung adenocarcinoma cell lines and normal lung epithelial cells (NL20) were purchased from the American Type Culture Collection (ATCC). The cells were cultured in minimum essential medium, Dulbecco’s modified Eagle’s medium (DMEM), and Ham’s F12 medium supplemented with 10% fetal bovine serum (FBS) (Sigma Chemical Co., St.Louis, USA), penicillin (100 U/ mL) and streptomycin (100 µg/ mL) as antibiotics in a humidified atmosphere of 5% CO2 at 37 oC.
RNA extraction
Total RNA was extracted using Qiagen miRNeasy kit (Qiagen, Valencia, CA) according to the manufacturer’s protocol. In brief, the cell pellet was mixed with QIAzol Lysis Reagent and chloroform. After centrifugation at 12,000g at 4°C for 15 min, the aqueous phase was transferred into another tube, and 1.5 volumes of absolute ethanol were added. The mixture was then applied to miRNeasy Mini kit columns, following by washing with RWT and RPE buffers. The RNAs were finally eluted in 40 μl of RNase-free water.
Quantitative RT-PCR
MiRNAs and genes were measured using Taqman miRNA assay kits (Applied Biosystems, USA) according to the manufacturer’s protocol. Briefly, about RNA was reverse transcribed with a TaqMan Reverse Transcription Kit (Applied Biosystems, USA). Expression levels of miRNAs and genes were quantified in triplicate by qRT-PCR using human TaqMan Assay Kits (Applied Biosystems, USA) on the ABI 7500 thermocycler (Applied Biosystems) according to the manufacturer’s protocol. The expression value of miRNAs were normalized against an internal control (U6 RNA) and expression value of genes (mRNAs) were normalized using the internal control GAPDH.
Abbreviations
NSCLC: non-small cell lung cancer; SE: sensitivity; SP: specificity; PPV: positive predictive value; NPV: negative predictive value; ROC curve: receiver operating characteristic curve; AUC: area under ROC curve; FDR: False discovery rate; FC: fold change; GO: Gene Expression Omnibus;
Acknowledgments
We thank Dr. Deng’s team (Departments of Internal Medicine and Biochemistry, Rush University Medical Center) for their analysis of statistical data. we thank Qian xin (Department of Respiratory Medicine, Taihe Hospital, hubei provice, china) for giving some assistance of drawing. This work is supported by the NIH grant (R21CA164764) to Youping Deng.
Conflicts of interests
The authors declare that they have no competing interests.
References
1. Kanaan Z, Kloecker GH, Paintal A and Perez CA. Novel targeted therapies for resistant ALK-rearranged non-small-cell lung cancer: ceritinib and beyond. Onco Targets Ther. 2015; 8:885-892.
2. Feng B, Zhang K, Wang R and Chen L. Non-small-cell lung cancer and miRNAs: novel biomarkers and promising tools for treatment. Clin Sci (Lond). 2015; 128:619-634.
3. Nascimento AV, Bousbaa H, Ferreira D and Sarmento B. Non-small Cell Lung Carcinoma: An Overview on Targeted Therapy. Curr Drug Targets. 2014.
4. Xia S, Huang CC, Le M, Dittmar R, Du M, Yuan T, Guo Y, Wang Y, Wang X, Tsai S, Suster S, Mackinnon AC and Wang L. Genomic variations in plasma cell free DNA differentiate early stage lung cancers from normal controls. Lung Cancer. 2015; 90:78-84.
5. Hubers AJ, Heideman DA, Burgers SA, Herder GJ, Sterk PJ, Rhodius RJ, Smit HJ, Krouwels F, Welling A, Witte BI, Duin S, Koning R, Comans EF, Steenbergen RD, Postmus PE, Meijer GA, et al. DNA hypermethylation analysis in sputum for the diagnosis of lung cancer: training validation set approach. Br J Cancer. 2015; 112:1105-1113.
6. Liu Y, Sun W, Zhang K, Zheng H, Ma Y, Lin D, Zhang X, Feng L, Lei W, Zhang Z, Guo S, Han N, Tong W, Feng X, Gao Y and Cheng S. Identification of genes differentially expressed in human primary lung squamous cell carcinoma. Lung Cancer. 2007; 56:307-317.
7. Perez-Ramirez C, Canadas-Garre M, Jimenez-Varo E, Faus-Dader MJ and Calleja-Hernandez MA. MET: a new promising biomarker in non-small-cell lung carcinoma. Pharmacogenomics. 2015; 16:631-647.
8. Luo A, Yin Y, Li X, Xu H, Mei Q and Feng D. The clinical significance of FSCN1 in non-small cell lung cancer. Biomed Pharmacother. 2015; 73:75-79.
9. Su J, Liao J, Gao L, Shen J, Guarnera MA, Zhan M, Fang H, Stass-Feng Jiang SA and Jiang F. Analysis of small nucleolar RNAs in sputum for lung cancer diagnosis. Oncotarget. 2015. doi: 10.18632/oncotarget.4219.
10. Li HM, Guo K, Yu Z, Feng R and Xu P. Diagnostic value of protein chips constructed by lung-cancer-associated markers selected by the T7 phage display library. Thorac Cancer. 2015; 6:469-474.
11. Markou A, Sourvinou I, Vorkas PA, Yousef GM and Lianidou E. Clinical evaluation of microRNA expression profiling in non small cell lung cancer. Lung Cancer. 2013; 81:388-396.
12. Ma L, Yue W, Teng Y, Zhang L, Gu M and Wang Y. Serum anti-CCNY autoantibody is an independent prognosis indicator for postoperative patients with early-stage nonsmall-cell lung carcinoma. Dis Markers. 2013; 35:317-325.
13. Ronald JA, Chuang HY, Dragulescu-Andrasi A, Hori SS and Gambhir SS. Detecting cancers through tumor-activatable minicircles that lead to a detectable blood biomarker. Proc Natl Acad Sci U S A. 2015; 112:3068-3073.
14. Boeri M, Verri C, Conte D, Roz L, Modena P, Facchinetti F, Calabro E, Croce CM, Pastorino U and Sozzi G. MicroRNA signatures in tissues and plasma predict development and prognosis of computed tomography detected lung cancer. Proc Natl Acad Sci U S A. 2011; 108:3713-3718.
15. Farazi TA, Hoell JI, Morozov P and Tuschl T. MicroRNAs in human cancer. Adv Exp Med Biol. 2013; 774:1-20.
16. Nohata N, Hanazawa T, Enokida H and Seki N. microRNA-1/133a and microRNA-206/133b clusters: dysregulation and functional roles in human cancers. Oncotarget. 2012; 3:9-21. doi 10.18632/oncotarget.424.
17. Melo SA and Esteller M. Dysregulation of microRNAs in cancer: playing with fire. FEBS Lett. 2011; 585:2087-2099.
18. Bouyssou JM, Manier S, Huynh D, Issa S, Roccaro AM and Ghobrial IM. Regulation of microRNAs in cancer metastasis. Biochim Biophys Acta. 2014; 1845:255-265.
19. Zhang WC, Liu J, Xu X and Wang G. The role of microRNAs in lung cancer progression. Med Oncol. 2013; 30:675.
20. Shen Y, Tang D, Yao R, Wang M, Wang Y, Yao Y, Li X and Zhang H. microRNA expression profiles associated with survival, disease progression, and response to gefitinib in completely resected non-small-cell lung cancer with EGFR mutation. Med Oncol. 2013; 30:750.
21. Jeong HC. Clinical Aspect of MicroRNA in Lung Cancer. Tuberc Respir Dis (Seoul). 2014; 77:60-64.
22. Zhang H, Yang H, Zhang R, Zhang C, Zhang J and Li D. In-depth bioinformatic analysis of lung cancer-associated microRNA targets. Oncol Rep. 2013; 30:2945-2956.
23. Gu XY, Wang J, Luo YZ, Du Q, Li RR, Shi H and Yu TP. Down-regulation of miR-150 induces cell proliferation inhibition and apoptosis in non-small-cell lung cancer by targeting BAK1 in vitro. Tumour Biol. 2014; 35:5287-5293.
24. Sun Y, Su B, Zhang P, Xie H, Zheng H, Xu Y, Du Q, Zeng H, Zhou X, Chen C and Gao W. Expression of miR-150 and miR-3940-5p is reduced in non-small cell lung carcinoma and correlates with clinicopathological features. Oncol Rep. 2013; 29:704-712.
25. Brighenti M. MicroRNA and MET in lung cancer. Ann Transl Med. 2015; 3:68.
26. Griffiths-Jones S, Grocock RJ, van Dongen S, Bateman A and Enright AJ. miRBase: microRNA sequences, targets and gene nomenclature. Nucleic Acids Res. 2006; 34:D140-144.
27. Krek A, Grun D, Poy MN, Wolf R, Rosenberg L, Epstein EJ, MacMenamin P, da Piedade I, Gunsalus KC, Stoffel M and Rajewsky N. Combinatorial microRNA target predictions. Nat Genet. 2005; 37:495-500.
28. Lewis BP, Shih IH, Jones-Rhoades MW, Bartel DP and Burge CB. Prediction of mammalian microRNA targets. Cell. 2003; 115:787-798.
29. Xie D, Shang C, Zhang H, Guo Y and Tong X. Up-regulation of miR-9 target CBX7 to regulate invasion ability of bladder transitional cell carcinoma. Med Sci Monit. 2015; 21:225-230.
30. Li W and He F. Monocyte to macrophage differentiation-associated (MMD) targeted by miR-140-5p regulates tumor growth in non-small cell lung cancer. Biochem Biophys Res Commun. 2014; 450:844-850.
31. Niu N, Schaid DJ, Abo RP, Kalari K, Fridley BL, Feng Q, Jenkins G, Batzler A, Brisbin AG, Cunningham JM, Li L, Sun Z, Yang P and Wang L. Genetic association with overall survival of taxane-treated lung cancer patients - a genome-wide association study in human lymphoblastoid cell lines followed by a clinical association study. BMC Cancer. 2012; 12:422.
32. Tie J, Pan Y, Zhao L, Wu K, Liu J, Sun S, Guo X, Wang B, Gang Y, Zhang Y, Li Q, Qiao T, Zhao Q, Nie Y and Fan D. MiR-218 inhibits invasion and metastasis of gastric cancer by targeting the Robo1 receptor. PLoS Genet. 2010; 6:e1000879.
33. Wang T, Chen T, Niu H, Li C, Xu C, Li Y, Huang R, Zhao J and Wu S. MicroRNA-218 inhibits the proliferation and metastasis of esophageal squamous cell carcinoma cells by targeting BMI1. Int J Mol Med. 2015; 36:93-102.
34. Wang J, Tian X, Han R, Zhang X, Wang X, Shen H, Xue L, Liu Y, Yan X, Shen J, Mannoor K, Deepak J, Donahue JM, Stass SA, Xing L and Jiang F. Downregulation of miR-486-5p contributes to tumor progression and metastasis by targeting protumorigenic ARHGAP5 in lung cancer. Oncogene. 2014; 33:1181-1189.
35. Stahlhut C and Slack FJ. Combinatorial Action of MicroRNAs let-7 and miR-34 Effectively Synergizes with Erlotinib to Suppress Non-small Cell Lung Cancer Cell Proliferation. Cell Cycle. 2015; 14:2171-2180.
36. Liu Z, Wu R, Li G, Sun P and Xu Q. MiR-592 inhibited cell proliferation of human colorectal cancer cells by suppressing of CCND3 expression. Int J Clin Exp Med. 2015; 8:3490-3497.
37. Zhong K, Chen K, Han L and Li B. MicroRNA-30b/c inhibits non-small cell lung cancer cell proliferation by targeting Rab18. BMC Cancer. 2014; 14:703.
38. Zhang S, Zhang H, Zhu J, Zhang X and Liu Y. MiR-522 contributes to cell proliferation of human glioblastoma cells by suppressing PHLPP1 expression. Biomed Pharmacother. 2015; 70:164-169.
39. Guo P, Lan J, Ge J, Nie Q, Mao Q and Qiu Y. miR-708 acts as a tumor suppressor in human glioblastoma cells. Oncol Rep. 2013; 30:870-876.
40. Lin KT, Yeh YM, Chuang CM, Yang SY, Chang JW, Sun SP, Wang YS, Chao KC and Wang LH. Glucocorticoids mediate induction of microRNA-708 to suppress ovarian cancer metastasis through targeting Rap1B. Nat Commun. 2015; 6:5917.
41. Bai Y, Liao H, Liu T, Zeng X, Xiao F, Luo L, Guo H and Guo L. MiR-296-3p regulates cell growth and multi-drug resistance of human glioblastoma by targeting ether-a-go-go (EAG1). Eur J Cancer. 2013; 49:710-724.
42. Liu X, Chen Q, Yan J, Wang Y, Zhu C, Chen C, Zhao X, Xu M, Sun Q, Deng R, Zhang H, Qu Y, Huang J, Jiang B and Yu J. MiRNA-296-3p-ICAM-1 axis promotes metastasis of prostate cancer by possible enhancing survival of natural killer cell-resistant circulating tumour cells. Cell Death Dis. 2013; 4:e928.
43. Du H, Chen D, Zhou Y, Han Z and Che G. Fibroblast phenotypes in different lung diseases. J Cardiothorac Surg. 2014; 9:147.
44. Forzati F, Federico A, Pallante P, Fedele M and Fusco A. Tumor suppressor activity of CBX7 in lung carcinogenesis. Cell Cycle. 2012; 11:1888-1891.
45. Murdock DG, Bradford Y, Schnetz-Boutaud N, Mayo P, Allen MJ, D’Aoust LN, Liang X, Mitchell SL, Zuchner S, Small GW, Gilbert JR, Pericak-Vance MA and Haines JL. KIAA1462, a coronary artery disease associated gene, is a candidate gene for late onset Alzheimer disease in APOE carriers. PLoS One. 2013; 8:e82194.
46. Campbell JD, Liu G, Luo L, Xiao J, Gerrein J, Juan-Guardela B, Tedrow J, Alekseyev YO, Yang IV, Correll M, Geraci M, Quackenbush J, Sciurba F, Schwartz DA, Kaminski N, Johnson WE, et al. Assessment of microRNA differential expression and detection in multiplexed small RNA sequencing data. RNA. 2015; 21:164-171.
47. Deng Y, Ai J, Guan X, Wang Z, Yan B, Zhang D, Liu C, Wilbanks MS, Escalon BL, Meyers SA, Yang MQ and Perkins EJ. MicroRNA and messenger RNA profiling reveals new biomarkers and mechanisms for RDX induced neurotoxicity. BMC Genomics. 2014; 15 Suppl 11:S1.
48. Deng Y, Johnson DR, Guan X, Ang CY, Ai J and Perkins EJ. in vitro gene regulatory networks predict in vivo function of liver. BMC Syst Biol. 2010; 4:153.