
INTRODUCTION
Breast cancer prognosis and treatment mostly relies on a few markers such as the estrogen receptor (ER), progesterone receptor (PgR), the human epidermal growth factor receptor 2 (HER2/neu) and tumor stage. Positive ER and PgR expression helps identifying patients more likely to benefit from endocrine treatment while HER2 over expression and amplification predicts response to trastuzumab and lapatinib [1, 2]. Despite advances in breast cancer prognosis and treatment [2, 3] some patients have a short disease-free survival period demonstrating the need of better clinical markers.
Therefore we proposed to screen the EPH receptor family and its ligands. The EPH receptors belong to the largest family of tyrosine kinase receptors with implications in cancer [4-6]. The name EPH derived from an Erythropoietin-Producing Hepatocellular carcinoma cell line used to clone the receptor for the first time [7, 8]. EPH receptors, together with membrane-bound ligands (ephrins) play a crucial role not only in mammary gland development but also in carcinogenesis [9]. EPH and ephrins influence cell adhesion, cell migration, intercellular junction formation, cell shape, cell motility, cell guidance and pattern formation [10, 11].
The EPH family is composed of subclasses A and B, based on sequence homology, and structural features. EPHA receptors are attached to the plasma membrane by a glycosylphosphatidylinositol tail and preferentially bind ephrin-A ligands. EPHB receptors have a single trans-membrane domain and a short cytoplasmic tail and usually recognize transmembrane ephrin-B ligands [12]. Upon cell-to-cell contact, EPH receptors and ephrins interact and transduce signals in a bidirectional manner. Bidirectional signals are defined as “forward signals” when deriving from EPH receptors present in epithelial cells and “reverse signals” when transmitted by the ephrin ligands expressed by, for example, endothelial cells. The EPH-ephrin interaction is usually restricted to members of the same class but hetero-dimerization between EPHA and EPHB members and ephrins takes place [13].
EPH receptors can also “cross talk” with other signaling molecules [14] and receptor tyrosine kinases (RTK) [15]. Therefore, it is believed that EPH-ephrin interactions are complex and promiscuous affecting both the normal and malignant epithelium [9].
Among the family members, EPHA2 and EPHB4 are the most studied in breast cancer and additionally EPHA4, EPHA7 and EPHB6 emerged as promising clinical candidates in an expression profile of the individual EPH and ephrin family members [16]. Here, we explored whether a cluster analysis of the EPH/ephrin gene expression levels would reveal patient subgroups with different clinical outcome. For this purpose the EPH/EFN gene expression was quantified using TaqMan® Array Micro Fluidics Cards containing 21 EPH/ephrin family members and then proceeded to group the patients based on their gene expression levels. This approach, which differs from the one used in a previous study [16], allowed us identifying a subgroup of patients with higher expression levels of the EPH/EFN genes and more frequent relapse of the disease compared with the rest of the patients. Also, in addition to the previous report, we found that EFNB1, EFNB2 and EPHB2 were interesting candidates due to the strong correlation between these genes and the cluster groups. EPHB2 was identified as an independent prognostic factor in multivariate analysis and therefore we also investigated the expression of EPHB2 at the protein level. EPHB2 was found in the cell membrane and the cytoplasm of the tumor cells. However, membranous EPHB2 and cytoplasmic EPHB2 were inversely correlated indicating different patient prognosis. Positive membranous EPHB2 was coupled to better prognosis while cytoplasmic EPHB2 was associated with shorter disease-free survival. This finding suggests that the EPHB2 cellular localization introduces another level of complexity.
In conclusion, we confirmed the clinical value of EPHA2, EPHB4 and EPHB6. We also suggest that EFNB1 and EFNB2 could be additional interesting candidates and revealed the clinical value of EPHB2 as a potential prognostic marker in breast cancer.
RESULTS
Expression of the EPH/EFN gene family (cohort 1)
Gene expression levels were quantified in the first patient cohort (Fig. 1). All analyzed genes expressed mRNA at detectable levels in the cell pool used as reference sample. More than 90% of the tumors expressed mRNA for EFNA1, EFNA2, EFNA3, EFNA4, EFNA5, EFNB1, EFNB2, EFNB3, EPHA1, EPHA2, EPHA3, EPHA4, EPHA7, EPHB1, EPHB2, EPHB3, EPHB4 and EPHB6. However, mRNA levels for EPHA5, EPHA6 and EPHA8 were detected in <40% of the tumors, and although mRNA for EFNA2 was present in most tumors it was poorly expressed with high variance. Relative mRNA expression levels of the analyzed genes, except for EPHA5, EPHA6, EPHA8 and EFNA2, are shown in Fig. 2A. EPHB1 showed the highest relative mRNA expression in the breast cancer samples and EPHA2 the lowest.
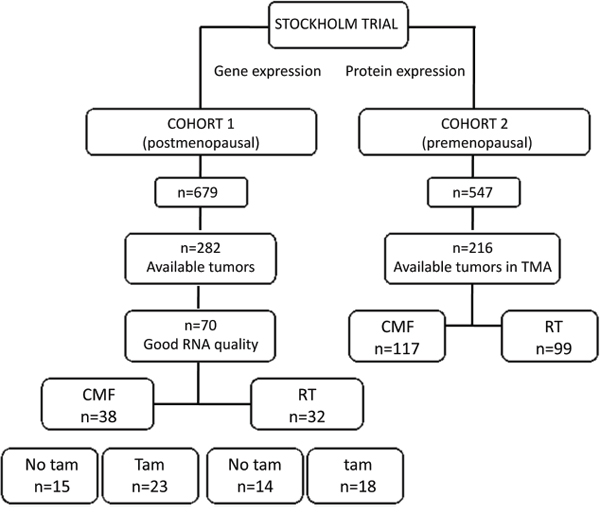
Figure 1: Patient distribution in the two cohorts included in this study. The treatments consisted in cyclophosphamide, methotrexate and 5-fluorouracil (CMF), radiation therapy (RT) or tamoxifen (Tam).
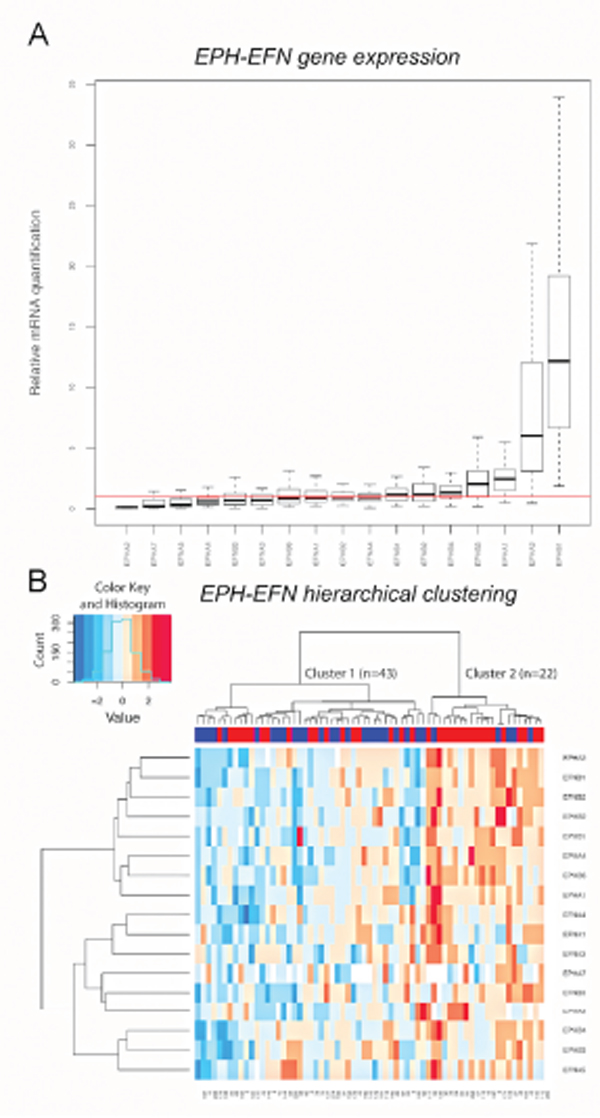
Figure 2: EPH/EFN mRNA expression in breast cancer patients with lymph nodal infiltration. A. The boxes show the distributions of EPH/EFN relative mRNA expression levels across the breast cancer samples, normalized to the endogenous control HPRT1 and relative to the expression levels in the cell line pool. The red line shows y=1 which corresponds to the relative expression levels of the EPH/EFN genes in the cell line pool. The box plot shows expression levels for those EPH family members that were expressed at detectable levels in clinical samples. Hierarchical clustering showing that the patients were clustered into cluster 1 (n=43) with low to medium mRNA levels of the EPH family members and cluster 2 (n=22) with high mRNA expression B. Numbers below the heat map represent anonymous patient identification. The red inserts in the upper blue bar indicate total recurrences. The color key for the mRNA expression is blue for low to medium expression and red for high expression. Both graphs were built in R.
Cluster and statistical analyses (cohort 1)
Unsupervised hierarchical clustering was used to group the patients in cohort 1 according to their expression levels of the EPH/EFN gene family. In order to have a clinically homogenous cohort, only the 65 patients with lymph node infiltration were included. The hierarchical clustering divided the patients in two main clusters. The patients in the smaller cluster (n=22), generally expressed the EPHA2, EFNB1, EFNB2, EPHB2, EPHB1, EPHA4, EPHB6, EPHA1, EFNA4, EFNA1, EFNA3, EPHA7, EFNB3, EPHB4, EPHB3 and EFNA5 genes at higher levels in comparison with the patients in the larger cluster 1 (n=43) (Fig. 2B).
A categorical variable was assigned to each patient describing whether it belonged to the “high expression” cluster or cluster 2 (34% of the patients) or to the “low expression” cluster or cluster 1 (66% of the patients). Spearman Rank Correlation was then used to test the correlation between cluster groups and the expression levels of individual EPH genes. It was noted that the strongest correlation with the cluster groups was observed for EPHA2, EFNB1, EFNB2, EPHB2, EPHA4 and EPHB6 (P<0.000001) indicating that these genes are the most representative members of this cluster. However, no other known clinical variable was associated with the “cluster groups” categorical variable (Table 1). Among the EPH members, EPHB2 mRNA expression was positively associated with HER2 protein expression.
Table 1: Correlation between the cluster groups, EPHB2 (median) and other clinical variables in Cohort 1
Cluster 1 |
Cluster 2 |
P value |
EPHB2- |
EPHB2+ |
P value |
|
Tumor Size |
||||||
<20 mm |
16 (62) |
10 (38) |
11 (42) |
15 (58) |
||
≥20 mm |
27 (69) |
12 (31) |
0.53 |
19 (50) |
19 (50) |
0.55 |
ERαa |
||||||
- |
10 (67) |
5 (33) |
7 (47) |
8 (53) |
||
+ |
33 (66) |
17 (34) |
0.96 |
23 (47) |
26 (53) |
0.99 |
HER2 proteinb |
||||||
- |
34 (68) |
16 (32) |
27 (55) |
22 (45) |
||
+ |
8 (57) |
6 (43) |
0.46 |
2 (14) |
12 (86) |
0.006 |
ERBB2 genec |
||||||
Non amplified |
36 (68) |
17 (32) |
28 (54) |
24 (46) |
||
Amplified |
5 (56) |
4 (44) |
0.47 |
1 (11) |
8 (89) |
0.02 |
Treatmentd |
||||||
- |
7 (54) |
6 (46) |
6 (46) |
7 (54) |
||
+ |
36 (69) |
16 (31) |
0.30 |
24 (47) |
27 (53) |
0.95 |
SPhase (%)e |
||||||
< 10 |
24 (73) |
9 (27) |
19 (58) |
14 (42) |
||
≥ 10 |
17 (61) |
11 (39) |
0.33 |
9 (32) |
19 (68) |
0.05 |
pAKT (Ser473)f |
||||||
- |
18 (55) |
15 (45) |
14 (42) |
19 (58) |
||
+ |
25 (78) |
7 (22) |
0.045 |
16 (52) |
15 (48) |
0.47 |
EPHB2 |
||||||
- |
28 (93) |
2 (7) |
||||
+ |
15 (44) |
19 (56) |
0.0001 |
aEstrogen receptor alpha (ERα) measured by isoelectric focusing with cutoff value of 0.05 fmol/μg DNA, bDetermined by flow cytometry [41], c[40], dTreatment – (radiotherapy) Treatment + (cytostatics alone or together with tamoxifen or radiotherapy together with tamoxifen. eS phase Fraction, f[41]. Significant P≤0.01 in bold adjusted for multiple comparisons.
Survival analysis
Univariate Cox proportional Hazard Regression and the Gehan’s Wilcoxon test (included in the Kaplan-Meier plots) were used to assess whether there were differences in recurrence-free survival time for the patients in the cluster 2 compared with the patients in the cluster 1. Four end-points were analyzed: distant recurrence-free survival, breast cancer-survival, local recurrence-free survival and total recurrence-free survival (time from surgery to development of local or distant recurrences) (Fig. 3A, 3C, 3E, 3G).
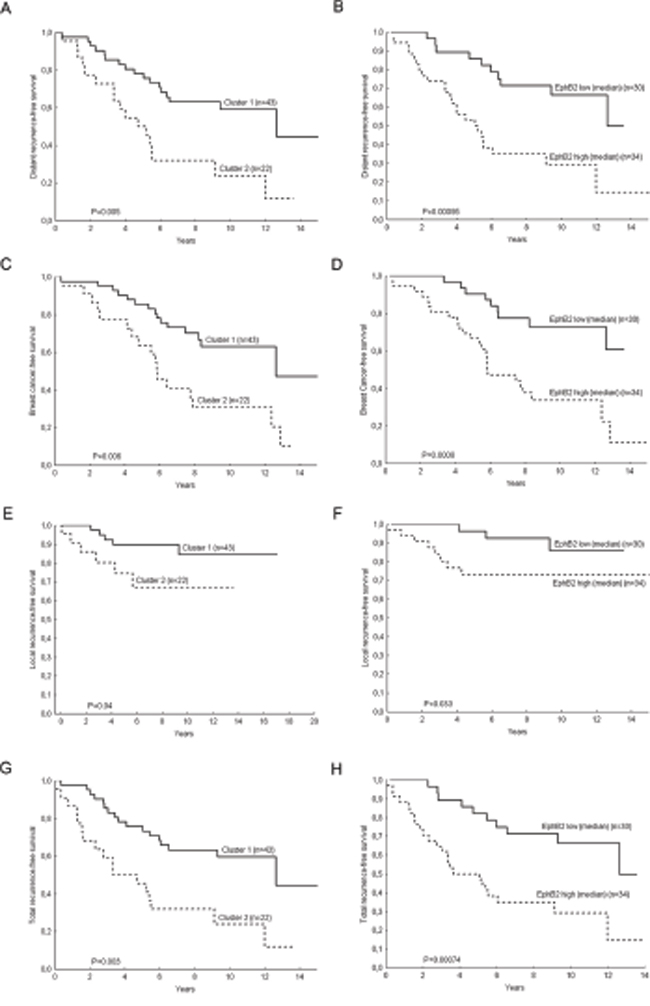
Figure 3: Kaplan-Meier Plots for breast cancer patients with lymph nodal infiltration. Patients who belong to the cluster group 2 have shorter distant recurrence-free survival (H.R. (95%CI)=2.7 (1.39-5.39), P=0.004) A. shorter breast cancer survival (H.R. (95%CI)=2.79 (1.39-5.63), P=0.004) C. shorter local recurrence-free survival (H.R. (95%CI)=3.06 (0.93-10.09), P=0.07) E. and total recurrence-free survival (H.R. (95%CI)=2.85 (1.45-5.60), P=0.002) G. Likewise the patients with high EPHB2 mRNA expressing tumors have shorter distant recurrence-free survival (H.R. (95%CI)=3.31 (1.57-7.01), P=0.002) B. breast cancer-free survival (H.R. (95%CI)= 3.72 (1.66-8.30), P=0.001) D. local recurrence-free survival (H.R. (95%CI)=3.23 (0.85-12.3), P=0.09) F. and total recurrence-free survival (H.R. (95%CI)=3.3 (1.56-6.97), P=0.002) H. P values in the plots correspond to the Gehan’s Wilcoxon test and Hazard Ratios to the Cox regression analysis.
Furthermore, a multivariate Cox analysis (Table 2) showed the independent prognostic value of the cluster groups and EPHB2 with the covariates treatment, tumor size, HER2 protein expression and ERα. EPHB6, which also had a high impact on the cluster separation, had independent prognostic value in univariate analysis. However in multivariate analysis with the covariates EPHB2 and the cluster groups, only EPHB2 remained significant (Table 3 and Fig. 3B, 3D, 3F, 3H).
Table 2: Multivariate Cox proportional hazard regression model for cohort 1
Variables |
Breast Cancer death |
Distant Recurrences |
Total Recurrences |
|||
H.R. (95% CI)a |
P-value |
H.R. (95% CI) |
P-value |
H.R. (95% CI) |
P-value |
|
Treatmentb |
||||||
- |
1.00 |
1.00 |
1.00 |
|||
+ |
0.81 (0.31-2.13) |
0.679 |
0.73 (0.29-1.83) |
0.51 |
0.81 (0.33-2.03) |
0.658 |
Tumor size (mm) |
||||||
< 20 |
1.00 |
1.00 |
1.00 |
|||
≥ 20 |
0.79 (0.39-1.63) |
0.520 |
0.75 (0.37-1.51) |
0.41 |
0.75 (0.37-1.53) |
0.433 |
HER2 proteinc |
||||||
- |
1.00 |
1.00 |
1.00 |
|||
+ |
1.20 (0.49-2.91) |
0.693 |
1.19 (0.49-2.88) |
0.697 |
1.20 (0.49-2.95) |
0.696 |
ERαd |
||||||
- |
1.00 |
1.00 |
1.00 |
|||
+ |
0.79 (0.32-1.94) |
0.600 |
0.84 (0.36-1.94) |
0.678 |
0.80 (0.33-1.92) |
0.611 |
Cluster groups |
||||||
1 |
1.00 |
1.00 |
1.00 |
|||
2 |
2.76 (1.33-5.73) |
0.007 |
2.63 (1.29-5.36) |
0.008 |
2.80 (1.37-5.72) |
0.005 |
H.R. (95% CI) |
P-value |
H.R. (95% CI) |
P-value |
H.R. (95% CI) |
P-value |
|
Treatment |
||||||
- |
1.00 |
1.00 |
1.00 |
|||
+ |
1.03 (0.41-2.62) |
0.938 |
0.91 (0.38-2.20) |
0.840 |
0.97 (0.40-2.33) |
0.946 |
Tumor size (mm) |
||||||
< 20 |
1.00 |
1.00 |
1.00 |
|||
≥ 20 |
1.08 (0.53-2.23) |
0.822 |
0.95 (0.48-1.91) |
0.895 |
0.96 (0.47-1.95) |
0.910 |
HER2 protein |
||||||
- |
1.00 |
1.00 |
1.00 |
|||
+ |
0.76 (0.31-1.85) |
0.544 |
0.86 (0.35-2.08) |
0.731 |
0.87 (0.35-2.14) |
0.759 |
ERα |
||||||
- |
1.00 |
1.00 |
1.00 |
|||
+ |
1.04 (0.42-2.52) |
0.939 |
1.09 (0.47-2.51) |
0.847 |
1.04 (0.44-2.48) |
0.923 |
EPHB2 |
||||||
Low |
1.00 |
1.00 |
1.00 |
|||
High |
3.84 (1.69-8.73) |
0.001 |
3.11 (1.44-6.72) |
0.004 |
3.10 (1.44-6.70) |
0.004 |
Systemic treatment |
||||||
- |
1.00 |
1.00 |
1.00 |
|||
+ |
1.00 (0.36-2.74) |
0.99 |
0.92 (0.34-2.48) |
0.87 |
0.95 (0.36-2.53) |
0.92 |
Tumor size (mm) |
||||||
< 20 |
1.00 |
1.00 |
1.00 |
|||
≥ 20 |
1.03 (0.49-2.15) |
0.94 |
0.90 (0.44-1.84) |
0.78 |
0.91 (0.44-1.87) |
0.80 |
HER2 protein |
||||||
- |
1.00 |
1.00 |
1.00 |
|||
+ |
1.22 (0.51-2.93) |
0.65 |
1.39 (0.58-3.30) |
0.46 |
1.36 (0.57-3.25) |
0.49 |
ERα |
||||||
- |
1.00 |
1.00 |
1.00 |
|||
+ |
1.39 (0.55-3.51) |
0.49 |
1.49 (0.60-3.69) |
0.39 |
1.40 (0.56-3.48) |
0.47 |
EPHB6 |
||||||
Low |
1.00 |
1.00 |
1.00 |
|||
High |
3.05 (1.38-6.72) |
0.006 |
2.98 (1.34-6.64) |
0.007 |
2.80 (1.28-6.13) |
0.01 |
aHazard Ratio (H.R.) and confident intervals calculated with the Cox model, bTreatment – (radiotherapy) Treatment + (cytostatics alone or together with tamoxifen or radiotherapy together with tamoxifen), cHER2 protein measured by flow cytometry, destrogen receptor alpha (ERα) measured by isoelectric focusing, cutoff value of 0.05 fmol/μg DNA. Significant P≤0.01 in bold adjusted for multiple comparisons.
Table 3: Multivariate Cox proportional hazard regression model with Cluster groups, EPHB2 and EPHB6 as additional covariates
Variables |
Breast cancer death |
Distant recurrences |
Total recurrences |
|||
H.R. (95% CI)a |
H.R. (95% CI) |
H.R. (95% CI) |
P-value |
H.R. (95% CI) |
P-value |
|
Systemic treatmentb |
||||||
- |
1.00 |
1.00 |
1.00 |
|||
+ |
1.34 (0.47-3.79) |
0.58 |
1.22 (0.43-3.44) |
0.71 |
1.29 (0.47-3.58) |
0.62 |
Tumor size (mm) |
||||||
< 20 |
1.00 |
1.00 |
1.00 |
|||
≥ 20 |
1.13 (0.53-2.41) |
0.75 |
1.00 (0.49-2.08) |
0.99 |
0.96 (0.46-2.00) |
0.92 |
HER2 proteinc |
||||||
- |
1.00 |
1.00 |
1.00 |
|||
+ |
0.65 (0.25-1.74) |
0.39 |
0.77 (0.29-2.03) |
0.59 |
0.73 (0.27-2.00) |
0.54 |
ERαd |
||||||
- |
1.00 |
1.00 |
1.00 |
|||
+ |
0.87 (0.31-2.39) |
0.78 |
0.98 (0.37-2.66) |
0.98 |
0.83 (0.30-2.34) |
0.73 |
Cluster groups |
||||||
1 |
1.00 |
1.00 |
1.00 |
|||
2 |
1.42 (0.56-3.61) |
0.47 |
1.49 (0.57-3.87) |
0.41 |
1.73 (0.68-4.45) |
0.25 |
EPHB2e |
||||||
Low |
1.00 |
1.00 |
||||
High |
3.21(1.18-8.72) |
0.02 |
2.60 (1.02-6.61) |
0.04 |
2.62 (1.03-6.63) |
0.04 |
EPHB6f |
||||||
Low |
1.00 |
1.00 |
||||
High |
1.90 (0.74-4.89) |
0.18 |
1.76 (0.64-4.87) |
0.28 |
1.54 (0.58-4.09) |
0.39 |
aHazard Ratio (H.R.) and confident intervals calculated with the Cox proportional hazard regression model, bsystemic treatment – (radiotherapy), systemic treatment + (cytostatics, tamoxifen or cytostatics + tamoxifen), cHER2 protein measured by flow cytometry, destrogen receptor alpha (ERα) cutoff value of 0.05 fmol/μg/DNA, eEPHB2 Low (≤median) EPHB2 High (> median), fEPHB6 Low (quartiles 1-3) EPHB6 High (quartile 4).
We next explored the potential clinical value of EPHB2 in four public datasets (Fig. 4A-4D) finding that EPHB2 has prognostic value in other patient cohorts and even for patients without lymphnodal infiltration. Therefore we continued exploring the role of EPHB2 at the protein level in a larger patient material (cohort 2, Fig. 1).
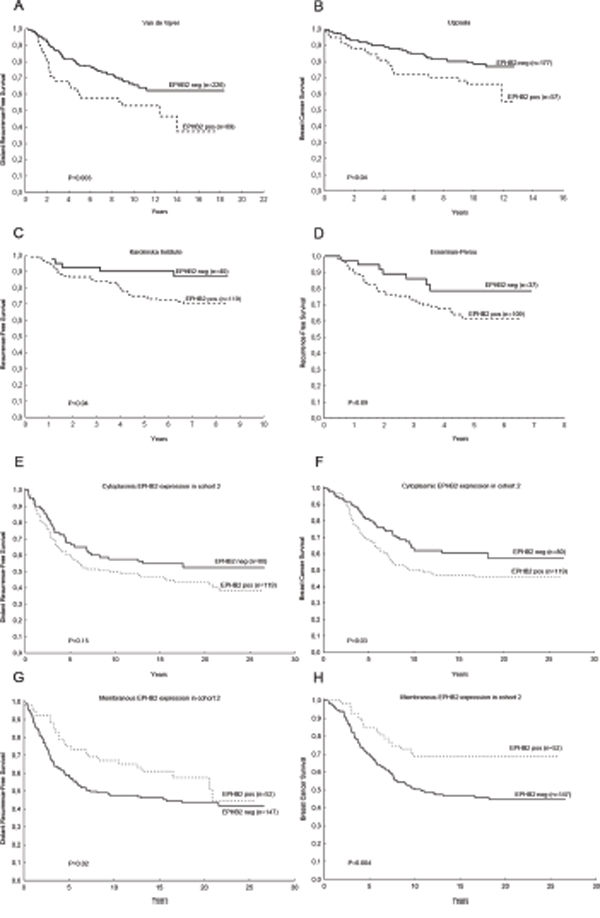
Figure 4: The clinical significance of EPHB2 mRNA expression was validated in public databases and at the protein level in a second patient cohort. High EPHB2 mRNA expression predicted shorter distant recurrence-free survival (H.R. (95%CI)=1.78(1.18-2.71), P=0.006). A. shorter breast cancer survival B. (H.R. (95%CI)=1.76 (1.01-3.05), P=0.04), trend to shorter recurrence-free survival C. (H.R. (95%CI)=2.59 (1.02-6.62), P=0.05) and (H.R. (95%CI)=1.91 (0.85-4.29), P=0.12 D. In the second cohort, high EPHB2 cytoplasmic expression borderline predicted shorter distant recurrence-free survival, H.R. (95%CI)=1.37 (0.92-2.04), P=0.12 E. and poor breast cancer survival, H.R. (95%CI)=1.52 (0.10-2.33), P=0.05 F. While, high membranous EPHB2 indicated longer distant recurrence-free survival, (H.R. (95%CI)=0.66 (0.41-1.05), P=0.08 G. and longer breast cancer survival, (H.R. (95%CI)=0.47 (0.28-0.80), P=0.006 H. Hazard Ratios (H.R.) were calculated with the Cox regression analysis while P values included in the plots correspond to the Gehan’s Wilcoxon test.
EPHB2 protein expression (cohort 2)
EPHB2 protein expression was determined by immunohistochemistry with a polyclonal rabbit anti-EPHB2 antibody raised against the recombinant EPHB2. A commercial cell lysate from HEK293 expressing the extracellular human EPHB2-Fc domain was used as positive control for the immunoblot. Also cell lysates from mouse brain and human colorectal cancer cells (HCT116, SW620) with reported EPHB2 expression, were used. Additionally we detected EPHB2 in MDA-MB-231, MDA-MB-468 and T47D breast cancer cells. The immunoblot (Fig. 5A) shows that the antibody recognizes a single protein band in all the samples including the HEK293 positive control. In the brain lysate the detected band matches the predicted molecular weight slightly above 100 kDa. In the cancer cells, however, a 75kDa band was visualized. This band was also EPHB2 as proved by LC-MS/MS analysis (see Supplementary Methods, Supplementary Table S3 and Supplementary Fig. S1). To further validate the antibody; in addition of using a blocking peptide (result not shown), the SW620 cells were selected to knock down the EPHB2 expression with siRNAs. Fig. 5B shows that the EPHB2 (75kDa) is detected by the rabbit polyclonal antibody in the control siRNA-treated cells but hardly in the EPHB2 siRNA-treated cells due to knockdown of the EPHB2 protein in these cells.
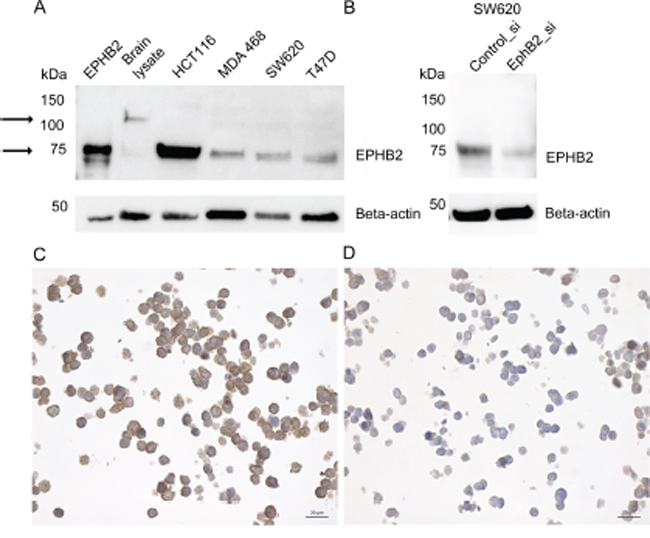
Figure 5: EPHB2 Antibody validation by immunoblot and immunocytochemistry. The left arrows indicate bands at ≈ 100 kDa (brain lysate) and 75kDa (all other cell lines and the positive control). The EPHB2 positive control consisted in HEK293 expressing the recombinant human EPHB2/Fc extracellular domain with estimated Mw between 50-90 kDa. Other tested lysates were extracted from mouse brain, human colorectal cancer cells HCT116 and SW620 and breast cancer cells MDA-MB-468 and T47D A. The SW620, a colon cell lined derived from a metastatic lymph node, was selected to knockdown EPHB2 expression with siRNA B. or treated with the AllStars control siRNA. Beta actin (1:1000) was used as loading control. Paraffin embedded HCT116 cells treated with control siRNA C. or EPHB2 siRNAs D. were stained with the rabbit anti-EPHB2 (dilution 1:300).
Also to prove that the anti-EPHB2 was specific and suitable for studies in paraffin embedded material, we used paraffin-embedded HCT116 cells pre-treated with control or EPHB2 siRNAs. A strong membranous staining was observed in the control cells (Fig. 5C) compared to a negative/weak EPHB2 signal in the knockdown cells (Fig. 5D).
Regarding the clinical material, some tumors were negative for EPHB2 (Fig. 6A) while other tumors showed cytoplasmic staining (Fig. 6B) or membrane staining (Fig. 6C). For the cytoplasmic staining, 60% of the tumors were classified as positive (scored as C>0), and 26% presented strong membranous staining (scored as M=2). Only 7% of the tumors presented nuclear staining (result not shown).
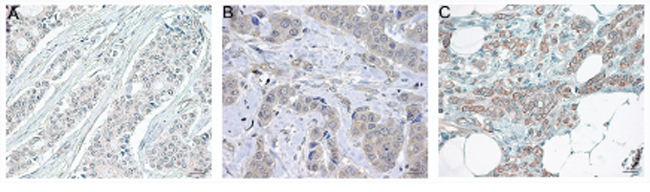
Figure 6: Representative EPHB2 immunostaining in paraffin embedded breast cancer tissues at a final magnification of 630 X. Negative staining A. positive cytoplasmic staining B. and positive membranous staining C. The Image analysis was performed with the software Aperio ImageScope v.12.2 and the panels were assembled in Adobe Photoshop CS5 extended v.12.
Cytoplasmic EPHB2 was positively correlated with Nottingham histological grade (NHG), P=0.0008 and with HER2 protein expression, P=0.01 and borderline negatively correlated to membranous EPHB2 expression, P=0.03. Membranous EPHB2 expression did not correlate with any other clinical variable except for cytoplasmic EPHB2 (Table 4).
Table 4: EPHB2 protein expression in relation to known clinical variables in Cohort 2
EPHB2_C- |
EPHB2_C+a |
P value |
EPHB2_M- |
EPHB2_M+b |
P value |
|
n (%) |
n (%) |
n (%) |
n (%) |
|||
Lymph nodes |
||||||
- |
10 (42) |
14 (58) |
18 (75) |
6 (25) |
||
+ |
71 (40) |
105 (60) |
0.90 |
130 (74) |
46 (26) |
0.91 |
NHGc |
||||||
I |
24 (57) |
18 (43) |
30 (71) |
12 (29) |
||
II |
43 (41) |
62 (59) |
77 (73) |
28 (27) |
||
III |
11 (23) |
37 (77) |
0.0008 |
39 (81) |
9 (19) |
0.27 |
Tumor Size |
||||||
<20 mm |
34 (44) |
43 (56) |
58 (75) |
19 (25) |
||
≥20 mm |
45 (38) |
74 (62) |
0.38 |
88 (74) |
31 (26) |
0.83 |
ERαd |
||||||
- |
17 (31) |
37 (69) |
44 (81) |
10 (19) |
||
+ |
54 (42) |
74 (58) |
0.18 |
93 (73) |
35 (27) |
0.21 |
PgRe |
||||||
- |
22 (34) |
43 (66) |
50 (77) |
15 (23) |
||
+ |
35 (42) |
49 (58) |
0.33 |
58 (69) |
26 (31) |
0.29 |
HER2 protein |
||||||
- |
74 (44) |
93 (56) |
124 (74) |
43 (26) |
||
+ |
7 (21) |
26 (79) |
0.01 |
24 (73) |
9 (27) |
0.86 |
Treatment |
||||||
Chemotherapy |
42 (39) |
65 (61) |
77 (72) |
30 (28) |
||
Radiotherapy |
39 (42) |
54 (58) |
0.70 |
71 (76) |
22 (24) |
0.48 |
EPHB2_C |
||||||
- |
54 (66) |
28 (34) |
||||
+ |
95 (80) |
24 (20) |
0.03 |
aPositive cytoplasmic EPHB2 staining defined as staining >0 in the cytoplasm, bPositive membranous EPHB2 staining defined as membrane intensity =2, cNottingham Grade, dEstrogen receptor alpha (ERα) cutoff value of 0.05 fmol/μg/DNA, eProgesterone Receptor. In bold are the significant P values from the Spearman Rank R test. Significance was set at the level of P≤0.01 to adjust for multiple comparisons.
Survival analysis
Positive cytoplasmic EPHB2 expression was associated with poor patient survival while positive membranous EPHB2 was a good prognostic factor in the univariate analysis. High cytoplasmic EPHB2 expression predicted shorter distant metastasis-free survival, H.R. (95%CI)=1.37 (0.92-2.04), P=0.12 and poor breast cancer survival, H.R. (95%CI)=1.52 (0.10-2.33), P=0.05 (Fig. 4E, 4F). While, high membranous EPHB2 indicated longer distant recurrence-free survival, H.R. (95%CI)=0.66 (0.41-1.05), P=0.08 and longer breast cancer survival, H.R. (95%CI)=0.47 (0.28-0.80), P=0.006 (Fig. 4G, 4H).
Multivariate Cox proportional hazard regression; adjusted for the well-known clinical variables ER, HER2, lymph nodes, tumor size and treatment; showed that membranous EPHB2 was an independent predictor of breast cancer-free survival in addition to lymph nodal status and tumor size. EPHB2 also predicted lower risk to develop metastasis with borderline significance (Table 5). Cytoplasmic EPHB2, albeit indicating higher risk for breast cancer death and metastasis, was not an independent prognostic factor in multivariate analysis.
Table 5: Multivariate Cox proportional hazard regression to determine EPHB2 prognostic value in cohort 2
Variables |
Breast cancer death |
Distant recurrences |
||
H.R. (95% CI)a |
P value |
H.R. (95% CI) |
P value |
|
EPHB2_C |
||||
- |
1.0 |
1.0 |
||
+ |
1.14 (0.71-1.83) |
0.58 |
1.17 (0.75-1.85) |
0.49 |
EPHB2_M |
||||
- |
1.0 |
1.0 |
||
+ |
0.45 (0.25-0.83) |
0.01 |
0.66 (0.39-1.11) |
0.12 |
ERα |
||||
- |
1.0 |
1.0 |
||
+ |
0.69 (0.43-1.11) |
0.13 |
0.82 (0.51-1.31) |
0.40 |
HER2 |
||||
- |
1.0 |
1.0 |
||
+ |
1.42 (0.81-2.49) |
0.22 |
1.29 (0.75-2.23) |
0.36 |
Lymph nodes |
||||
- |
1.0 |
1.0 |
||
+ |
2.88 (1.23-6.74) |
0.01 |
2.43 (1.1-5.38) |
0.03 |
Tumor size (mm) |
||||
<20 |
1.0 |
1.0 |
||
≥20 |
2.12 (1.30-3.47) |
0.003 |
1.78 (1.12-2.82) |
0.01 |
Treatment |
||||
Chemotherapy |
1.0 |
1.0 |
||
Radiotherapy |
1.04 (0.67-1.61) |
0.87 |
1.21 (0.79-1.84) |
0.38 |
aHazard Ratio (H.R.) and confident intervals calculated with the Cox proportional hazard regression model. Significant P≤0.01 in bold.
EPHB2 did not have predictive value for patients randomized between radiation treatment (RT) and CMF. Although, patients with positive membranous staining in the tumor cells or negative cytoplasmic staining, did not received a clear benefit from RT compared to CMF in terms of local recurrences-free survival (Fig. 7).
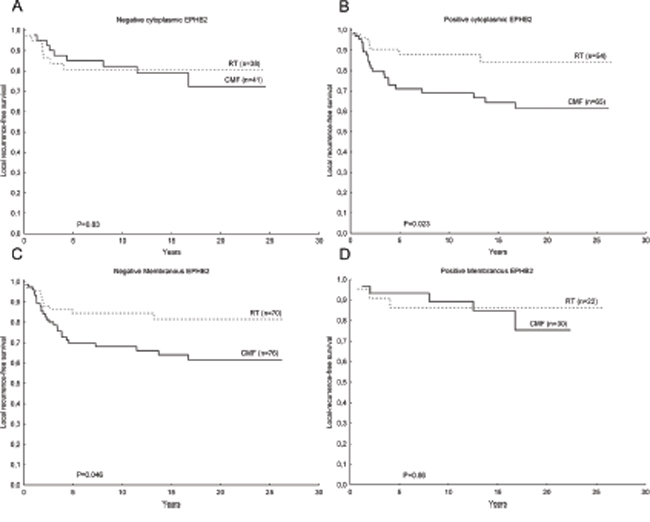
Figure 7: Kaplan-Meier plots showing EPHB2 predictive value in breast cancer. Patients with tumors negative for cytoplasmic EPHB2 staining did not benefited from RT compared to CMF in terms of locoregional recurrence-free survival A. while the group of patients with positive cytoplasmic EPHB2 staining exhibited a longer locoregional recurrence-free survival time upon RT compared to CMF B. (interaction test: P=0.17). The opposite trend was found for EPHB2 membranous staining C, D. although the interaction test did not reach statistical significance (P=0.45).
DISCUSSION
In this study we distinguished a subgroup of patients more likely to relapse with local and distant metastasis and to have a shorter breast cancer free-survival time based on cluster analysis of the EPH/EFN mRNA expression levels. EPHA2, EPHA4, EFNB1, EFNB2, EPHB2, and EPHB6 were the genes most strongly correlated with the cluster groups. Especially the EPHB2 receptor was the most significantly coupled to patient survival in a multivariate analysis. This result was confirmed in public datasets. Moreover, the EPHB2 protein analysis showed that, in addition to its membranous location, EPHB2 could be found in the cytoplasmic and nuclear cell compartments. Interestingly, membranous and cytoplasmic EPHB2 were negatively correlated indicating opposite patient prognosis: cytoplasmic EPHB2 accounted for shorter breast cancer survival and membranous EPHB2 for good prognosis. Taken together, our results suggest that EPHB2 mRNA level has clinical value, EPHB2 protein location is important and EPHB2 could be regarded in the context of EPHA2, EPHA4, EFNB1, EFNB2, and EPHB6.
Hitherto several groups have studied the connections between the EPH family and breast cancer where EPHA2 and EPHB4 are two of the most investigated EPH receptors with potential clinical relevance (reviewed in [4, 17]). A recent study revealed that other family members such as EPHA4, EPHA7 and EPHB6 were negatively correlated with overall patient survival [16]. In our study, based on cluster analysis of mRNA expression levels of EPHA2, EFNB1, EFNB2, EPHB2, EPHB1, EPHA4, EPHB6, EPHA1, EFNA4, EFNA1, EFNA3, EPHA7, EFNB3, EPHA3, EPHB4, EPHB3 and EFNA5, we identified two patient clusters: the patients within cluster 2 were characterized by high EPH expression and were more prone to relapse with local metastasis, distant metastasis and had a shorter breast cancer-free survival time. Especially, expression of EPHA2, EPHB2, EPHB6, EFNB1 and EFNB2 was strongly associated with the cluster variable and coupled to poor outcome. As mentioned before, EPHA2 has been coupled to poor patient survival [15, 18, 19] and to trastuzumab [15] and tamoxifen resistance [20]. Other receptors like EPHA7 failed to show any clinical value in this study in spite of its previous coupling to shorter recurrence and overall-free survival [16]. EPHA7 could be affected by promoter methylation, which explains its down regulation in human tumors [21]. Here, we also found low levels of EPHA7 expression, although detectable in more than 90% of the samples. In general we could detect most of the EPH family members except for EPHA5, EPHA6 and EPHA8 that were only present in less than 40% of the tumors. EPHA5 promoter methylation has also been reported. Low EPHA5 is associated with high tumor grade, lymph node metastasis and PgR negative status in breast cancer, indicating that down regulation of EPHA5 could be an important step in tumor progression [22]. Concerning the lower expression of EPHA6 and EPHA8, further studies are needed to unravel their significance. In our study, the lower mRNA levels of EPHA5, EPHA6 and EPHA8 were not further investigated, as the Ward’s algorithm used in the cluster analysis did not take into account genes with more than 50% missing data.
Multivariate analysis revealed that the cluster variable was an independent prognostic marker using the following covariates: treatment, tumor size, HER2 status and ERα. However, adding the EPHB2 to the multivariate analysis proved that the EPHB2 was the strongest prognostic factor for most of the survival endpoints. EPHB2 was one of the genes significantly coupled with the cluster variable and therefore chosen for confirmation in other patient cohorts.
The clinical role of EPHB2 in breast cancer is not well established. High EPHB2 protein expression has been associated with shorter overall survival [23]. The authors reported high EPHB2 cytoplasmic protein and mRNA expression in 51% of the tumors while we found high EPHB2 gene expression in 52% of the cases (cohort 1). Recently EPHB2 was found to be a target of TGFβ3-mediated invasion and migration [24] which is in line with increased EPHB2 protein levels in invasive carcinomas. Also a recent model suggests that EPHB2 could mediate invasion in cells with defective apoptotic machinery via the pro-survival role of autophagy [25]. The EPHB2 invasive properties were kinase-dependent suggesting interactions with an ephrin ligand or another receptor. Indeed, promiscuous interactions between EPH receptors and their ligands with opposite outcomes regarding tumor progression have been reported [11, 26]. For instance a recent study proposed that EPHB6 could decide the fate of the tumor by interacting with other receptors such as EPHB2 and EPHA2 [27]. EPHB6 is a kinase-dead receptor, which may sequester kinase functioning EPH’s turning off the oncogenic signaling. Although we found that EPHB2 was the most promising candidate in our breast cancer cohorts, EPHB2 together with EPHB6, EPHA2, EPHA4 and the ligands EFNB1 and EFNB2 were important to define prognostic relevant clusters. This information allows speculating that EPHB2 should be studied in combination with these other factors. Especially the EPHB6, which seems to be coupled to invasion upon re-expression in breast cancer cell lines [28, 29] and to adverse prognosis in breast cancer [16] although the EPHB6 gene seems to be methylated in cancer. To our knowledge, the data regarding the clinical value of EFNB1 and EFNB2 is scarce although high ephrin-B1 protein expression seems be involved in the development of brain metastasis from the primary breast tumor [30] and shorter patient overall survival [31].
Furthermore, the prognostic value of EPHB2 mRNA levels could be statistically demonstrated in the Van de Vijver [32], Uppsala [33] and Karolinska [34] datasets while a trend was seen in the Esserman Perou cohort [35]. We also assessed EPHB2 protein expression in a larger and randomized patient material (cohort 2). EPHB2 was mainly located in the cytoplasm (60% of the tumors) and the cell membrane (26%) although 7% of the tumors presented nuclear staining. Cytoplasmic expression was inversely associated with membranous expression and positively correlated with HER2 protein expression in agreement with the results from cohort 1. Cytoplasmic EPHB2 was also positively correlated with high Nottingham Grade. Cytoplasmic EPHB2 predicted shorter breast cancer survival and tended to indicate shorter metastasis-free survival in univariate analysis. However, membranous EPHB2 was not associated with any known clinical variable and resulted a good prognostic indicator for breast cancer survival in both univariate and multivariate analysis and metastasis-free survival in univariate analysis. These findings suggest that it might be important to make a distinction between cytoplasmic and membranous EPHB2 previous to taking clinical decisions.
Regarding the nuclear localization, EPHB2 has not been reported before as a nuclear protein. However, according to the online tool NLStradamus with default prediction cutoff of 0.5, the EPHB2 has a NLS between aa 1017-1033 corresponding to the aa sequence GKKKGMGKKKTDPGRGR. Otherwise, EPHB4 has been detected in the nucleus of prostate cancer cells [36] and other authors assure that presence of receptor tyrosine kinases in this cell compartment is possible [37] through several mechanisms including receptor internalization upon ligand binding and enzymatic cleavage. According to the free-prediction algorithm PsortII [38], EPHB2 could be present in the Golgi apparatus, endoplasmic reticulum and cell membrane in line with our results. Specificity of the EPHB2 antibody might be an issue. However, the antibody used in this study was extensively validated using several techniques. Still it could be important to consider that EPHB2 have several transcript variants and could undergo posttranslational modifications affecting both protein function and cellular localization. These factors should not be underestimated.
Finally we also took advantage of the randomized study and tested the EPHB2 predictive value finding an inverse trend between membranous EPHB2 expression and response to radiotherapy.
In summary we found that the EPH receptors and the ephrin ligands are potential clinical candidates. Especially EPHA2, EPHA4, EFNB1, EFNB2, EPHB2, and EPHB6 and their co-expression in breast cancer. EPHB2, although poorly investigated, has shown to be a promising prognostic marker in breast cancer but more studies on its protein expression and localization are still encouraged.
MATERIALS AND METHODS
Clinical materials
All tumor samples were collected during the Stockholm clinical trial (1976-1990) [39]. The trial included premenopausal and postmenopausal women with a unilateral, operable breast cancer. The surgery procedure was modified radical mastectomy. Further inclusion criteria were either histologically verified lymph node metastasis or a tumor diameter, exceeding 30 mm, measured on the surgical specimen. Patients received either adjuvant chemotherapy or radiotherapy, and both groups were randomized to tamoxifen or no endocrine treatment. Tamoxifen was administered postoperatively at a dose of 40 mg daily for 2 or 5 years. Patients in the chemotherapy group received 12 courses of cyclophosphamide, methotrexate, 5-fluorouracil (CMF) according to the original Milan protocol (100 mg/m2 cyclophosphamide orally at days 1-14, 40 mg/m2 methotrexate and 600 mg/m2 5-fluorouracil intravenously on days 1 and 8). However, in the first 18 months of the trial, 10-15 mg chlorambucil was administered orally on days 1-8 instead of cyclophosphamide and to avoid dose reductions up to 18 months treatment time was allowed for the 12 courses. Patients randomized to radiation treatment (RT), received a dose of 46 Gy with 2 Gy per fraction 5 days a week. Total treatment time was about 4.5 weeks and the target volume included the chest wall, the axilla, the supraclavicular fossa and the internal mammary nodes. In this study we included two patient cohorts from the Stockholm trial (Fig. 1): Cohort 1: originally comprised 679 postmenopausal patients. From those tumor tissue was available from 282 and RNA from 90 patients. In this study we included 70 patients with good RNA quality and from these, 65 patients with lymph nodal infiltration were analyzed. Some clinical variables used here were described in previous studies: ER [39], ERBB2 gene amplification [40], S-phase fraction, HER2 protein levels [41], pAKT [41]. Cohort 2 was initially composed of 547 premenopausal patients and from these, 216 patients, with available tumors, were included. These tumors were paraffin embedded and available on TMA allowing detection of protein expression by immunohistochemistry. The characteristics of the patients included in cohorts 1 and 2 did not significantly differ from all patients included in the Stockholm trial (Supplementary Table S1). The retrospective studies on tumor tissues have been approved by the Research Ethics Committee at the Karolinska Institute (dnr 97–451), with amendments.
Cell lines
Breast cancer cell lines: MDA-MB-231 (HTB-26), MDA-MB-468 (HTB-132) and T47-D (HTB-133) and colorectal cancer cells: HCT116 (CCL-247) and SW620 (CCL-227) were purchased from the American Type Culture Collection (ATCC) and tested for mycoplasma using the PCR Mycoplasma Test Kit I/C from PromoKine (PromoCell GmbH, Germany). Breast cancer cells were cultured in Dulbecco's Modified Eagle's Medium supplemented with 4% fetal bovine serum and penicillin and streptomycin. SW620 cells were cultured in Eagle's Minimum Essential Medium supplemented with 2 mM L-glutamine, 10% Fetal Bovine Serum (FBS) and HCT116 cells in Mc Coy's medium supplemented with 10% FBS. The mouse brain cell lysate was a kind gift from Ravi Kumar Dutta.
ANTIBODY VALIDATION
siRNA and immunoblot
The HCT116 and SW620 cells were transfected with a pool of EPHB2 siRNAs or a negative control siRNA in the Amaxa Nucleofector 2B and the Nucleofection Mix Solution V (Lonza) following manufacturer’s instructions. Transfected cells were harvested after 7 days. siEPHB2 Silencer Select s4740 + s4741 were pooled at 300nM (ThermoFisher Scientific). The AllStar Negative Control (SI03650318, Qiagen) was also used at 300nM. Upon transfection, cell lysates were prepared in RIPA buffer containing proteases inhibitors (Complete Mini, Roche) and the protein concentration was measured with the Bicinchoninic Acid Assay (Pierce Biotechnology). Total proteins (30 μg/well) were loaded in the gel. For the immunoblot, primary antibodies, rabbit anti-EPHB2, 1:500 (Cat # AP7623d, Nordic BioSite) or anti-beta actin, 1:1000 (Cell Signaling) were diluted in blocking buffer (TBS-0.1% Tween20/5% milk) and incubated at 4°C overnight. The secondary antibodies (DAKO) conjugated with horseradish peroxidase (HRP) were incubated for 1 h at room temperature. Proteins were visualized with HyGLO chemiluminescent HRP-antibody detection reagent and developed with BioMax light film (Carestream Health).
Paraffin embedding
HCT116 cells at 80-90% confluence were harvested and the pellet fixed with 4% formaldehyde at room temperature for 25 min. The cells were stained with hematoxylin and centrifuged at 1200 rpm for 2 min followed by progressively dehydration in ethanol at 70% (overnight), 95% (1 h) and 99.5% (1 h). Finally, xylene was added to the pellet for 30 min and after centrifugation the cell pellet was paraffin embedded at 56°C overnight. The embedded cells were cut in 4 μm slices, using a microtome and the slides stained following the immunohistochemistry protocol described below.
Gene expression profile
Quantitative real-time RTPCR was performed using aTaqman® Array Micro Fluidics Cards (Applied Biosystems, Life technologies, UK) that included 21 EPH family members: EPHA1-A8, EPHB1-B4 and EPHB6, EFNA1-A5, EFNB1-B3; and two endogenous controls: glyceraldehyde-3-phosphate dehydrogenase (GAPDH) and hypoxanthine phosphoribosyltransferase 1 (HPRT1) (details of the array are compiled in Supplementary Table S2). Each card included 8 samples: 7 breast tumors and an internal standard consisting of a pool of 7 cell lines. Samples were run in duplicates.
A cDNA equivalent of 200 ng RNA was adjusted to 52 μL with RNase free water and mixed with 51μL of TaqMan® Universal Master Mix II with uracil-DNA glycosylase (UNG) (Applied Biosystems, Life technologies, UK). The mixture was loaded into one slot of a TaqMan® Array Micro Fluidics Card. The PCR reaction was run in a 7900HT Fast time PCR system (Applied Biosystems, Life technologies, UK).
Relative mRNA expression levels of target genes within a sample was calculated with the ΔΔCT method [42] using RQ manager version 1.2 (Applied Biosystems, Life technologies, UK). The cell line pool was used as reference sample, and the HPRT1 gene was chosen as endogenous control due to its low expression variation as confirmed with the geNorm algorithm embedded in the StatMiner version 4.2 software (Integromics, Spain). Non-amplified wells and duplicates with SD>0.5 were omitted in the RQ manager.
Immunohistochemistry (cohort 2)
Tissue microarray (TMA) slides including 216 breast cancer patient samples from the Stockholm trial were incubated for 2 hours at 60°C prior to de-paraffinization and antigen retrieval in a PT-Link system (DAKO, Denmark). Antigen retrieval was performed at pH 6.0 for 20 min at 97°C. A washing buffer, consisting in TBS-0.1% BSA, was used previous to inactivation of endogenous peroxidase in 3% H2O2 for 10 min. Unspecific binding was blocked with serum-free protein block (Background Sniper, Biocare Medical) for 10 min in a moisture chamber. The rabbit anti-EPHB2 antibody (1:300) was incubated overnight at 4°C. The HRP conjugated-secondary antibody (Envision+System-HRP Labelled-Polymer anti Rabbit, DAKO, Ref#4002) was incubated for 30 min and the chromogenic agent and substrate was a DAB/H2O2 solution. Cell nuclei were counterstained with Mayer's Hematoxylin prior to stepwise dehydration with ethanol, 40%, 70%, 95%, 99.5% and tissue clear. The TMA slides were mounted with Pertex and images were acquired with an Aperio Scanscope AT Turbo (Leica Biosystems) with 20x/0.75 NA Plan Apo and with 20X magnification. The software Aperio ImageScope v.12 was used for image analysis.
IHC scoring
Staining was evaluated on three separate core biopsies by two individual observers blinded to the clinical data. The sections were re-evaluated upon disagreement. EPHB2 was mainly visualized in the cell membrane and the cytoplasm. Few tumors also presented nuclear staining. The cytoplasmic (C) and membrane (M) staining were based on intensity (negative =0, weak=1 and strong=2). The cut off for positive cytoplasmic staining was C>0 and for positive membranous staining, M=2.
Statistical analyses
The statistical analyses of relative mRNA expression levels in cohort 1 were performed in R version 3.0.2 (R Core Team (2013). R: A language and environment for statistical computing. R Foundation for Statistical Computing, Vienna, Austria. URL http://www.R-project.org/). Only patients with lymph node infiltration were included in the statistical analyses, and previous to the analysis the data was cleaned by only including the genes with detected expression in more than 60% of the tumor samples (42/70).
Hiearchical clustering of relative mRNA expression levels was performed on scaled data with mean value = 0 and standard deviation = 1 using the Complete linkage method and Eucledian distance. Cox Proportional Hazard regression was used in univariate and multivariate analyses to test if relative mRNA expression levels correlated with the endpoints breast cancer-survival (period from surgery until death due to breast cancer is reported), local recurrence-free survival (time from surgery until local recurrence is detected) and metastasis-free survival (time from surgery until distant metastasis is detected). Patient survival was represented with the Kaplan-Meier plots.
The statistical analysis of EPHB2 protein expression in cohort 2 was performed with Statistica 64 version 12.0 software (StatSoft. Inc, USA). Relationship with known clinical variables in breast cancer was tested with the Spearman Rank correlation test. Cox regression was used in univariate and multivariate analyses to test if there was an independent association between EPHB2 protein expression and the presence of distant metastases, local metastasis or death due to breast cancer. The survival analysis to estimate probabilities for metastasis-free survival (time from surgery until distant metastasis is detected), local recurrence-free survival (time from surgery until local recurrence is detected) and breast cancer-free survival (period from surgery until death due to breast cancer is reported) were calculated by comparing survival in multiple samples and represented with the Kaplan-Meier plots. When needed significance was set to p-value P<0.01 to compensate for multiple comparisons.
Public gene expression datasets
The EPHB2 results were validated in the following gene expression datasets: van de Vijver (n=295) [32], Uppsala (GSE3494, n=236) [33], Karolinska Institute (KI) (GSE1456, n=159) [34] and Esserman, Perou (GSE22226, n=147) [35]. For the statistical analysis gene expression data were divided into quartiles (q) where q1-3 was defined as low expression and q4 was high expression (Van de Vijver and Uppsala) or q1 was low vs. q 2-4 high (Esserman-Perou and KI). When several probes were used to detect EPHB2 mRNA expression (KI and Uppsala) and the probes were positively correlated, the average of the gene expression data was used for the analysis.
ACKNOWLEDGMENTS
The authors are grateful to Olle Stål and Helena Fohlin, for criticism and statistical help during data analysis, Birgitta Holmlund for preparing the TMA slides and Maria Turkina for helping with the LC-MS/MS analysis and for gathering the supplementary data.
CONFLICTS OF INTEREST
The authors state no conflicts of interest
FINANCIAL SUPPORT
This study was supported by grants from the Swedish Research Council, The Stockholm Cancer Society and the Oncology Clinics Research Fund of Linköping.
REFERENCES
1. Arteaga CL, Sliwkowski MX, Osborne CK, Perez EA, Puglisi F, Gianni L. Treatment of HER2-positive breast cancer: current status and future perspectives. Nat Rev Clin Oncol. 2012; 9:16-32.
2. Henry NL, Hayes DF. Uses and abuses of tumor markers in the diagnosis, monitoring, and treatment of primary and metastatic breast cancer. Oncologist. 2006; 11:541-552.
3. Njor S, Nystrom L, Moss S, Paci E, Broeders M, Segnan N, Lynge E. Breast cancer mortality in mammographic screening in Europe: a review of incidence-based mortality studies. J Med Screen. 2012; 19 Suppl 1:33-41.
4. Brantley-Sieders DM. Clinical relevance of Ephs and ephrins in cancer: lessons from breast, colorectal, and lung cancer profiling. Semin Cell Dev Biol. 2012; 23:102-108.
5. Kaenel P, Mosimann M, Andres AC. The multifaceted roles of Eph/ephrin signaling in breast cancer. Cell Adh Migr. 2012; 6:138-147.
6. Nievergall E, Lackmann M, Janes PW. Eph-dependent cell-cell adhesion and segregation in development and cancer. Cell Mol Life Sci. 2012; 69:1813-1842.
7. Hirai H, Maru Y, Hagiwara K, Nishida J, Takaku F. A novel putative tyrosine kinase receptor encoded by the eph gene. Science. 1987; 238:1717-1720.
8. Maru Y, Hirai H, Yoshida MC, Takaku F. Evolution, expression, and chromosomal location of a novel receptor tyrosine kinase gene, eph. Mol Cell Biol. 1988; 8:3770-3776.
9. Andres AC, Ziemiecki A. Eph and ephrin signaling in mammary gland morphogenesis and cancer. J Mammary Gland Biol Neoplasia. 2003; 8:475-485.
10. Pasquale EB. Eph-ephrin bidirectional signaling in physiology and disease. Cell. 2008; 133:38-52.
11. Pasquale EB. Eph receptors and ephrins in cancer: bidirectional signalling and beyond. Nat Rev Cancer. 2010; 10:165-180.
12. Gale NW, Holland SJ, Valenzuela DM, Flenniken A, Pan L, Ryan TE, Henkemeyer M, Strebhardt K, Hirai H, Wilkinson DG, Pawson T, Davis S, Yancopoulos GD. Eph receptors and ligands comprise two major specificity subclasses and are reciprocally compartmentalized during embryogenesis. Neuron. 1996; 17:9-19.
13. Janes PW, Griesshaber B, Atapattu L, Nievergall E, Hii LL, Mensinga A, Chheang C, Day BW, Boyd AW, Bastiaens PI, Jorgensen C, Pawson T, Lackmann M. Eph receptor function is modulated by heterooligomerization of A and B type Eph receptors. J Cell Biol. 2011; 195:1033-1045.
14. Arvanitis D, Davy A. Eph/ephrin signaling: networks. Genes Dev. 2008; 22:416-429.
15. Zhuang G, Brantley-Sieders DM, Vaught D, Yu J, Xie L, Wells S, Jackson D, Muraoka-Cook R, Arteaga C, Chen J. Elevation of receptor tyrosine kinase EphA2 mediates resistance to trastuzumab therapy. Cancer Res. 2010; 70:299-308.
16. Brantley-Sieders DM, Jiang A, Sarma K, Badu-Nkansah A, Walter DL, Shyr Y, Chen J. (2011). Eph/ephrin profiling in human breast cancer reveals significant associations between expression level and clinical outcome. PLoS One, pp. e24426.
17. Vaught D, Brantley-Sieders DM, Chen J. Eph receptors in breast cancer: roles in tumor promotion and tumor suppression. Breast Cancer Res. 2008; 10:217.
18. Martin KJ, Patrick DR, Bissell MJ, Fournier MV. Prognostic breast cancer signature identified from 3D culture model accurately predicts clinical outcome across independent datasets. PLoS One. 2008; 3:e2994.
19. Fournier MV, Martin KJ, Kenny PA, Xhaja K, Bosch I, Yaswen P, Bissell MJ. Gene expression signature in organized and growth-arrested mammary acini predicts good outcome in breast cancer. Cancer Res. 2006; 66:7095-7102.
20. Lu M, Miller KD, Gokmen-Polar Y, Jeng MH, Kinch MS. EphA2 overexpression decreases estrogen dependence and tamoxifen sensitivity. Cancer Res. 2003; 63:3425-3429.
21. Katoh M. Comparative integromics on Eph family. Int J Oncol. 2006; 28:1243-1247.
22. Fu DY, Wang ZM, Wang BL, Chen L, Yang WT, Shen ZZ, Huang W, Shao ZM. Frequent epigenetic inactivation of the receptor tyrosine kinase EphA5 by promoter methylation in human breast cancer. Hum Pathol. 2010; 41:48-58.
23. Wu Q, Suo Z, Risberg B, Karlsson MG, Villman K, Nesland JM. Expression of Ephb2 and Ephb4 in breast carcinoma. Pathol Oncol Res. 2004; 10:26-33.
24. Lam S, Wiercinska E, Teunisse AF, Lodder K, ten Dijke P, Jochemsen AG. Wild-type p53 inhibits pro-invasive properties of TGF-beta3 in breast cancer, in part through regulation of EPHB2, a new TGF-beta target gene. Breast Cancer Res Treat. 2014; 148:7-18.
25. Chukkapalli S, Amessou M, Dilly AK, Dekhil H, Zhao J, Liu Q, Bejna A, Thomas RD, Bandyopadhyay S, Bismar TA, Neill D, Azoulay L, Batist G, Kandouz M. Role of the EphB2 receptor in autophagy, apoptosis and invasion in human breast cancer cells. Exp Cell Res. 2014; 320:233-246.
26. Pasquale EB. Eph-ephrin promiscuity is now crystal clear. Nat Neurosci. 2004; 7:417-418.
27. Fox BP, Kandpal RP. A paradigm shift in EPH receptor interaction: biological relevance of EPHB6 interaction with EPHA2 and EPHB2 in breast carcinoma cell lines. Cancer Genomics Proteomics. 2011; 8:185-193.
28. Fox BP, Kandpal RP. Invasiveness of breast carcinoma cells and transcript profile: Eph receptors and ephrin ligands as molecular markers of potential diagnostic and prognostic application. Biochem Biophys Res Commun. 2004; 318:882-892.
29. Fox BP, Kandpal RP. EphB6 receptor significantly alters invasiveness and other phenotypic characteristics of human breast carcinoma cells. Oncogene. 2009; 28:1706-1713.
30. Dun MD, Chalkley RJ, Faulkner S, Keene S, Avery-Kiejda KA, Scott RJ, Falkenby LG, Cairns MJ, Larsen MR, Bradshaw RA, Hondermarck H. Proteotranscriptomic Profiling of 231-BR Breast Cancer Cells: Identification of Potential Biomarkers and Therapeutic Targets for Brain Metastasis. Mol Cell Proteomics. 2015; 14:2316-2330.
31. Yin H, Lu C, Tang Y, Wang H, Wang J. Enhanced expression of EphrinB1 is associated with lymph node metastasis and poor prognosis in breast cancer. Cancer Biomark. 2013; 13:261-267.
32. van de Vijver MJ, He YD, van't Veer LJ, Dai H, Hart AA, Voskuil DW, Schreiber GJ, Peterse JL, Roberts C, Marton MJ, Parrish M, Atsma D, Witteveen A, Glas A, Delahaye L, van der Velde T, et al. A gene-expression signature as a predictor of survival in breast cancer. N Engl J Med. 2002; 347:1999-2009.
33. Miller LD, Smeds J, George J, Vega VB, Vergara L, Ploner A, Pawitan Y, Hall P, Klaar S, Liu ET, Bergh J. An expression signature for p53 status in human breast cancer predicts mutation status, transcriptional effects, and patient survival. Proc Natl Acad Sci U S A. 2005; 102:13550-13555.
34. Pawitan Y, Bjohle J, Amler L, Borg AL, Egyhazi S, Hall P, Han X, Holmberg L, Huang F, Klaar S, Liu ET, Miller L, Nordgren H, Ploner A, Sandelin K, Shaw PM, et al. Gene expression profiling spares early breast cancer patients from adjuvant therapy: derived and validated in two population-based cohorts. Breast Cancer Res. 2005; 7:R953-964.
35. Esserman LJ, Berry DA, Cheang MC, Yau C, Perou CM, Carey L, DeMichele A, Gray JW, Conway-Dorsey K, Lenburg ME, Buxton MB, Davis SE, van't Veer LJ, Hudis C, Chin K, Wolf D, et al. Chemotherapy response and recurrence-free survival in neoadjuvant breast cancer depends on biomarker profiles: results from the I-SPY 1 TRIAL (CALGB 150007/150012; ACRIN 6657). Breast Cancer Res Treat. 2012; 132:1049-1062.
36. Mertens-Walker I, Lisle JE, Nyberg WA, Stephens CR, Burke L, Rutkowski R, Herington AC, Stephenson SA. EphB4 localises to the nucleus of prostate cancer cells. Exp Cell Res. 2015; 333:105-115.
37. Carpenter G, Liao HJ. Receptor tyrosine kinases in the nucleus. Cold Spring Harb Perspect Biol. 2013; 5:a008979.
38. Nakai K, Horton P. PSORT: a program for detecting sorting signals in proteins and predicting their subcellular localization. Trends Biochem Sci. 1999; 24:34-36.
39. Rutqvist LE, Johansson H. Long-term follow-up of the Stockholm randomized trials of postoperative radiation therapy versus adjuvant chemotherapy among 'high risk' pre- and postmenopausal breast cancer patients. Acta Oncol. 2006; 45:517-527.
40. Gunnarsson C, Ahnstrom M, Kirschner K, Olsson B, Nordenskjold B, Rutqvist LE, Skoog L, Stal O. Amplification of HSD17B1 and ERBB2 in primary breast cancer. Oncogene. 2003; 22:34-40.
41. Stal O, Perez-Tenorio G, Akerberg L, Olsson B, Nordenskjold B, Skoog L, Rutqvist LE. Akt kinases in breast cancer and the results of adjuvant therapy. Breast Cancer Res. 2003; 5:R37-44.
42. Livak KJ, Schmittgen TD. Analysis of relative gene expression data using real-time quantitative PCR and the 2(-Delta Delta C(T)) Method. Methods. 2001; 25:402-408.
43. Shevchenko A, Tomas H, Havlis J, Olsen JV, Mann M. In-gel digestion for mass spectrometric characterization of proteins and proteomes. Nat Protoc. 2006; 1:2856-2860.