
INTRODUCTION
In order to survive, cancer cells must activate a cellular mechanism for telomere maintenance. This is commonly achieved by activation of the ribonucleoprotein telomerase through the telomerase reverse transcriptase component encoded by the TERT gene [1]. Telomerase may then elongate telomeric DNA allowing for continued cancer cell proliferation. Telomerase activation is observed in the majority of human cancers, and TERT, which is normally suppressed, is frequently over-expressed in cancer cells. This may be due to e.g. specific mutations in the TERT promoter (Figure 1) that are common in certain cancer types, as initially described in melanoma [2, 3]. In follicular-cell derived thyroid carcinomas TERT promoter mutations were found to be associated with telomerase activation, altered telomere length and poor survival [4, 5]. In medullary thyroid carcinoma (MTC) TERT mutations were not observed [4, 6]. However, telomerase activation was detected in approximately 50% of MTCs, together with expression of one or more of three different splicing forms of TERT [7]. We found that the activation of telomerase and expression of the full-length TERT transcript had strong prognostic influence on patient survival [7]. In addition, a subset of telomerase negative MTCs were found to exhibit the alternative lengthening of telomere (ALT) phenotype [7]. However, the mechanism for activation of telomerase in MTC is not fully understood.
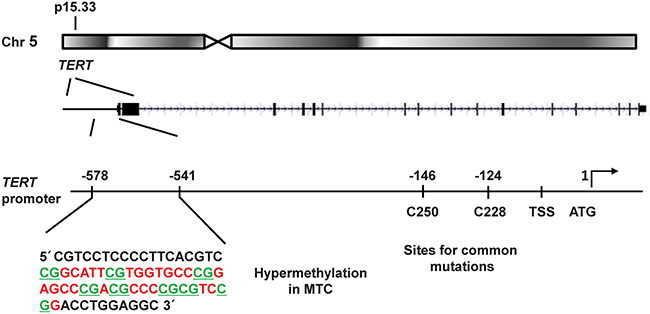
Figure 1: Schematic illustration of the TERT gene locus in chromosomal region 5p15.33 and its promoter region. The investigated promoter sequence showing CpG hypermethylation in MTCs is shown in an enlargement to the left. The location of the common mutations C250T and C228T are indicated to the right together with the transcription start site (TSS) and the translation start site (ATG). The eight CpG sites analysed here are underlined.
MTC arises from calcitonin-producing C-cells and is the main component of the hereditary multiple endocrine neoplasia type 2 (MEN 2) syndromes also associated with pheochromocytoma and primary hyperparathyroidism [8]. The genetic background of sporadic and familial MTC includes frequent activating mutations of the RET (REarranged during Transfection) proto-oncogene [9]. In RET negative tumors, mutations of HRAS or KRAS are recurrently observed [10], and exome-sequencing of MTCs support that the RET and RAS pathways are prominent drivers in this tumor type [11].
Aberrant gene expression in human cancer may result from different types of molecular genetic alterations. In addition to mutations, numerical DNA alterations and chromosomal rearrangements, the importance of epigenetic modifications is increasingly recognized. This may include e.g. altered DNA methylation affecting gene expressions. The possible involvement of DNA copy number alterations and DNA methylation in telomerase activation has not been explored in MTC. Indeed, CpG hypermethylation of the TERT promoter has been demonstrated in some other cancer types and associated with increased TERT expression and patient outcome [12].
Here we aimed to further elucidate mechanisms of telomerase activation and the effects on protein expression profiles in MTC. For this purpose we quantified DNA copy numbers and promoter methylation in a series of 42 MTCs and evaluated the findings in relation to telomerase activity, telomere length and clinical outcome. Furthermore, protein expression profiles were established using a proteomics approach.
RESULTS
TERT copy number gain in a subset of telomerase positive MTCs
DNA copy numbers of the TERT locus were determined in the 42 MTC samples and 10 normal thyroid tissues using a Taqman based assay. Five of the 39 (13%) sporadic MTCs displayed three copies of TERT while 34 tumors showed two copies (Figure 2A). The three MEN 2 cases and all normal thyroid tissues revealed two copies of the TERT gene locus. All five cases with copy number gain, i.e. three TERT copies, exhibited TERT expression and telomerase activity (Figure 2A). Furthermore, they presented with late stage disease at the diagnosis (Supplementary Table S1). At the end of follow-up, two patients had died from MTC, two were alive with persistent disease and one had died from other disease.
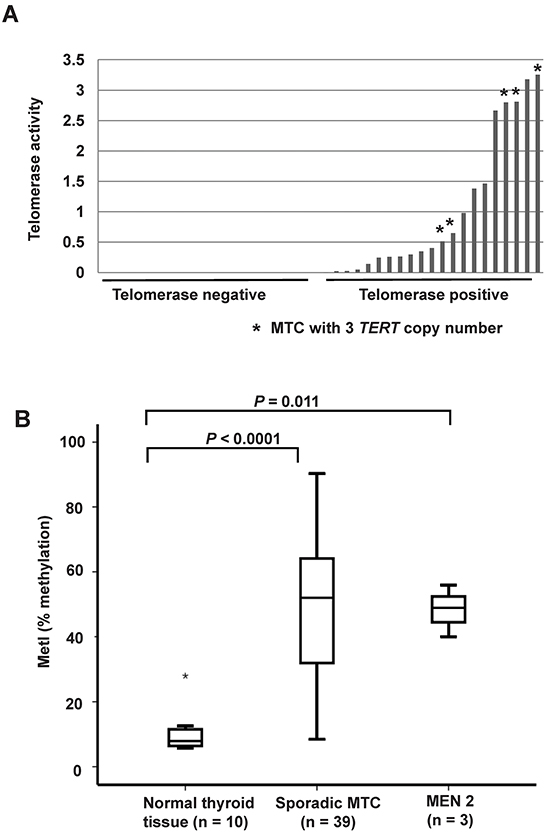
Figure 2: TERT copy number gain and promoter hypermethylation in sporadic MTCs. A. Comparison of DNA copy numbers of TERT and telomerase activity in the 39 sporadic MTCs. The same calibrator was used for both experiments. Each bar represents one MTC, and the height of the bar indicates the level of telomerase activity. The five MTCs with three TERT copies are indicated by an asterisk (*). All other samples have two copies of TERT. B. Box plots showing increased TERT promoter methylation in 39 sporadic MTCs and in the three MEN 2 cases as compared to 10 normal thyroid tissues. The outlier is indicated by an asterisk (*).
Increased TERT promoter methylation in MTCs correlate with telomerase activity, telomere length and RAS mutations
Specific TERT promoter methylation density was quantified at eight CpG sites by Pyrosequencing in MTCs and normal thyroid tissue samples (Supplementary Figure S1A), as well as MTC cell lines. A methylation index (MetI) was calculated for each sample analyzed as a mean of the eight CpGs assessed. Normal thyroid references exhibited low MetIs (mean 10.2%; range 5.7%-28%, Figure 2B). The MTC cell lines had very high levels of methylation with MetIs of 96% in MTC-TT and 96.5% in MZ-CRC-1. In the MTCs MetIs above 10% were observed in 37/39 sporadic MTCs and in 3/3 MEN2 related MTCs. Both the sporadic MTC group (P < 0.0001) and the MEN 2 group (P = 0.011) had increased TERT MetI as compared to normal thyroid (Figure 2B). In MTCs with increased methylation levels MetIs ranged from 12% to 90.3% (Supplementary Table S2). At the individual CpGs 1-8 methylation levels between 5% and 98% were observed without obvious difference between individual CpGs (Supplementary Figure S1B).
MetIs were compared with TERT expression, telomerase activation and telomere length previously determined for the same cases (7) (Supplementary Table S2). This revealed a positive correlation between MetI and TERT mRNA expression (r = 0.432, P = 0.006; Figure 3A), and a negative correlation was revealed between MetI and telomere length (r = -0.343, P = 0.032) (Figure 3B). MetIs were also significantly higher in MTCs with telomerase activation than in telomerase negative cases (P = 0.014) (Figure 4A; Table 1).
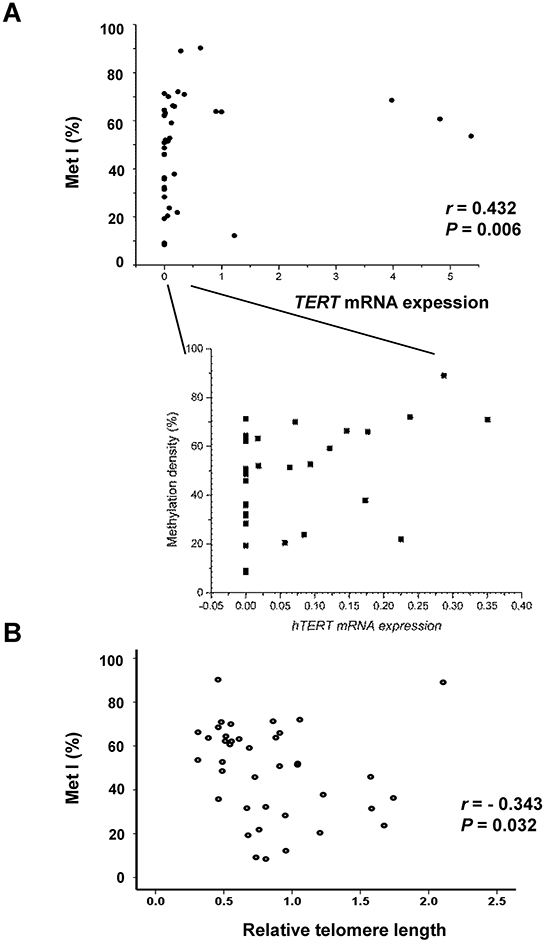
Figure 3: Comparisons of TERT promoter methylation index (Met I) with TERT gene expression and telomere length in the 39 sporadic MTCs. A. The scatter diagram shows a positive correlation between MetI and TERT mRNA expression in sporadic MTCs. An enlargement to the right illustrates all cases with TERT mRNA expression within the lower range. B. Negative correlation between MetI and relative telomere length. Correlations were determined using Spearman rank order correlation. The values on the X-axes refer to TERT expression and telomere relative length values given in arbitrary units, respectively.
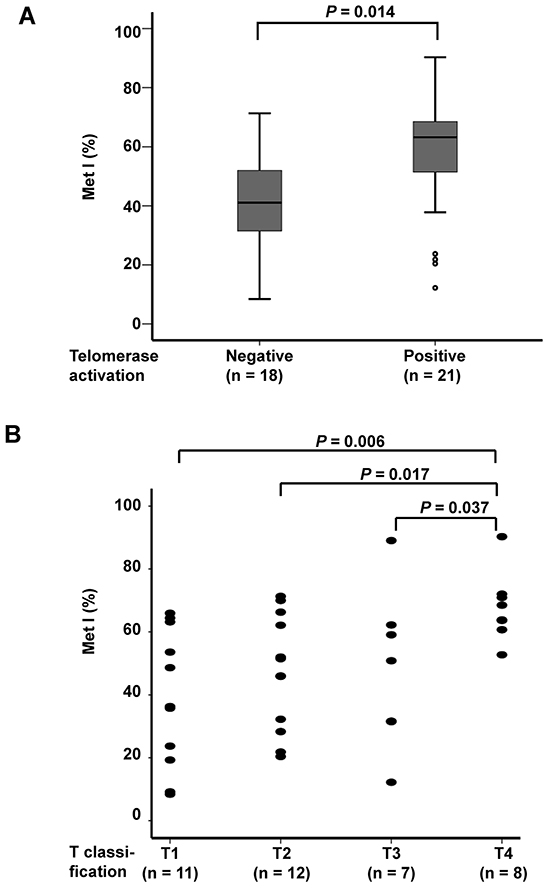
Figure 4: Comparison of TERT promoter MetI with telomerase activation status and tumor size of the 38 sporadic MTCs. A. Box plots show higher TERT promoter MetIs in MTCs with telomerase activation as compared to telomerase negative MTCs. B. Scatter plot illustrating higher TERT promoter MetIs in MTCs with larger tumor size. T1 = ( < 20 mm), T2 = (20 mm-40 mm), T3 = ( > 40 mm but limited to thyroid OR with minimal extra-thyroidal extension), T4 = (tumors with extensive extra-thyroidal growth). Differences between groups were evaluated by Mann-Whitney U test. P-values are indicated for comparisons with statistically significant differences.
Table 1: Comparison of TERT promoter methylation density with clinical and molecular parameters in 39 sporadic MTC
Parameter informative cases (n = ) |
TERT methylation Met I (min.-max.) % |
P-value |
|---|---|---|
T classification (n = 38) |
0.026 |
|
T1 (n = 11) |
38 (8–66) |
|
T2 (n = 12) |
47 (20–71) |
|
T3 (n = 7) |
48 (12–89) |
|
T4 (n = 8) |
68 (53–90) |
|
Stage (n = 39) |
0.407 |
|
Stage I (n = 3) |
36 (8–64) |
|
Stage II (n = 6) |
46 (32–71) |
|
Stage III (n = 6) |
40 (9–70) |
|
Stage IV (n = 24) |
54 (12–90) |
|
Stage (n = 39) |
0.100 |
|
Early-Stage (n = 15) |
42 (8–71) |
|
Late-Stage (n = 24) |
54 (12–90) |
|
RET mutation (n = 39) |
0.167 |
|
Positive (n = 21) |
54 (20–90) |
|
Negative (n = 18) |
44 (8–89) |
|
RAS mutation (n = 39) |
0.031 |
|
Positive (n = 7) |
66 (51–89) |
|
Negative (n = 32) |
45 (8–90) |
|
RET and /or RAS mutation (n = 39) |
0.002 |
|
Positive (n = 27) |
57 (20–90) |
|
Negative (n = 12) |
32 (8–72) |
|
Telomerase activation (n = 39) |
0.014 |
|
Positive (n = 21) |
56 (12–90) |
|
Negative (n = 18) |
41 (8–71) |
|
Tumor type (n = 38) |
0.215 |
|
Primary tumor (n = 27) |
52 (8–90) |
|
Metastasis (n = 11) |
41 (9–66) |
|
Gender (n = 39) |
0.862 |
|
Female (n = 24) |
49 (8–89) |
|
Male (n = 15) |
49 (9–90) |
|
Overall survival (n = 39) |
0.039 |
|
Alive (n = 22) |
44 (9–71) |
|
Dead (n = 17) |
56 (8–90) |
|
Disease-related survival (n = 39) |
0.053 |
|
Alive or dead from other diseases (n = 22 + 4) |
45 (8–71) |
|
Dead of MTC (n = 13) |
58 (12–90) |
|
Outcome (n = 39) |
0.144 |
|
Free of disease (n = 12) |
42 (9-71) |
|
Persistent disease (n = 27) |
52 (8-90) |
T1 = (<20 mm); T2 = (20 mm-40 mm)
T3 = ( >40 mm and limited to thyroid OR with minimal extra-thyroidal extension)
T4 = (tumors with extensive extra-thyroidal growth)
Early-Stage = Stage I - Stage III ; Late-Stage = Stage IV
Significant and close to significant P-values are indicated in bold
Evaluation of MetIs in relation to RAS and RET mutation status revealed that MTCs with a RAS mutation displayed higher MetIs than RAS wild-type cases (P = 0.031) (Table 1). Similarly, MTCs with RAS and/or RET mutation had higher MetI than wild-type cases (P = 0.002). However, no statistically significant association was found between MetI and RET mutations.
Increased TERT promoter methylation is associated with poor survival in MTC
Evaluation of MetIs in relation to clinical parameters revealed some significant associations (Table 1). MetIs were found to be higher in MTC cases with T4 tumors (tumors with extensive extra-thyroidal growth) as compared to T1 (P = 0.006), T2 (P = 0.017) and T3 (P = 0.037) tumors (Figure 4B). No significant differences were observed between groups with regard to gender or tumor stage (Table 1). Furthermore, no correlation was revealed between patient age and MetI values (r = 0.048; P = 0.772).
For survival analyses sporadic MTC cases were divided into two groups according to the median MetI (52%). This cut-off gave an optimal combination of sensitivity and specificity for both overall survival (sensitivity: 0.76; specificity: 0.73) and disease-related survival (sensitivity: 0.77; specificity: 0.68). Among the 19 sporadic MTC cases with MetI > 52%, 10 died from MTC, three died from intercurrent disease, three were alive with disease and only three were alive without disease at the end of follow-up. In the group with MetI ≤ 52%, only three patients died from MTC, one died from intercurrent disease (lymphoma), seven were alive with disease and 9 patients were alive without disease. Using log rank test and Kaplan-Meier plots MetI > 52% was found to be associated with poor outcome. Patients with MetI > 52% showed shorter survival compared to patients with MetI ≤ 52% (P = 0.005 for overall survival and P = 0.007 for disease-related survival) (Figure 5).
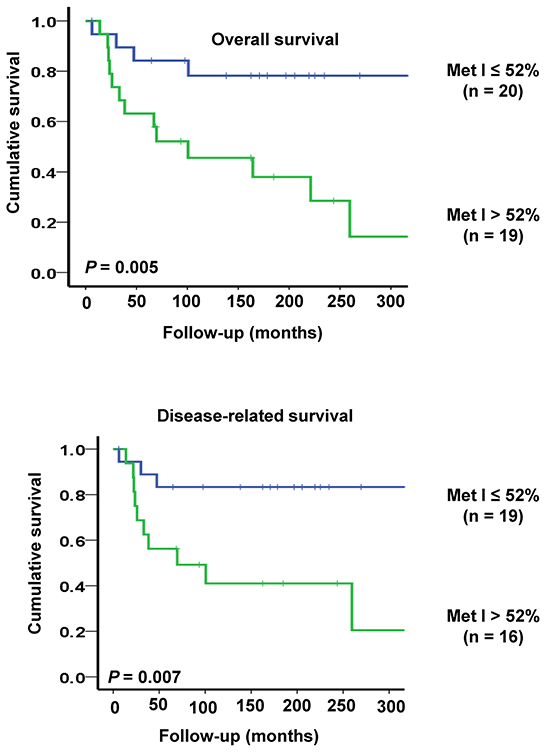
Figure 5: Kaplan-Meier plots illustrating survival of sporadic MTC cases in relation to TERT promoter methylation. Patients with high MetI > 52% had shorter overall survival (top) and disease-related survival (below) as compared to cases with MetI ≤ 52%. The statistical analysis was performed using log-rank test.
Protein expression profiles and pathway analysis in MTCs with and without telomerase activation
Fourteen fresh-frozen MTC samples were profiled by HiRIEF-LC-MS/MS including eight telomerase positive with different levels of TERT mRNA expression and six telomerase negative cases without detectable TERT mRNA expression. In total, 4,837 proteins were identified (1% FDR) in all samples, and the further data analyses were performed based on 4,321 proteins with quantitative data cross all tumors (Supplementary Table S3). Using PCA for visualization of the data no obvious grouping of MTCs could be observed (Supplementary Figure S2). Two samples were close to the 2-standard deviation line, which could be due to biological variation between cases (no. 26 and 19; Supplementary Table S1).
Different analytical approaches were taken to decipher the data, with the goal of finding proteins or groups of proteins that could distinguish the samples based on telomerase activation. Based on student's t-test 240 proteins were found to de differentially expressed between telomerase positive and negative MTCs (P < 0.05) (Supplementary Table S4). Among these 240 proteins, 101 showed higher expression in telomerase positive MTCs as compared to telomerase negative cases. Another 139 proteins had lower expression levels in telomerase positive cases, including e.g. CDKN1B (p27) which has been suggested to be a telomerase regulator [13].
The OPLS analysis generated a model that could separate the eight MTCs with high versus low TERT expression levels (P = 0.002). The model was refined by ranking to define the most important proteins for the separation (Supplementary Table S5). These 93 proteins were then used to find enriched pathways employing the IPA tool (Table 2). The two top enriched canonical pathways identified were ‘DNA double-strand break repair by non-homologous end joining’ (P = 7×10⁻⁵) and ‘telomere extension by telomerase’ (P = 8×10⁻⁵). The same three proteins from our data were part of these two pathways, i.e. XRCC5 (Ku80) (gene), XRCC6 (Ku70) (gene) and RAD50. None of the three proteins were significantly differentially expressed on their own but showed high similarities in expression levels (Figure 6A).
Table 2: Canonical pathways identified according to TERT mRNA expression levels in 8 telomerase positive MTC.
Comparison / Pathways identified |
-log (P-value) |
Ratio |
Symbol |
|---|---|---|---|
DNA double-strand break repair by non-homologous end joining |
4.15E00 |
1.88E-01 |
XRCC6, XRCC5, RAD50 |
Telomere extension by telomerase |
4.06E00 |
1.88E-01 |
XRCC6, XRCC5, RAD50 |
Mismatch repair in eukaryotes |
3.97E00 |
1.5E-01 |
MSH2, MSH6, POLD1 |
Signaling by Rho family GTPases |
3.54E00 |
2.85E-02 |
RELA, STMN1, WASL, CFL1, PIP4K2B, SLC9A1, MSN |
Protein ubiquitination |
2.78E00 |
2.28E-02 |
PSMA6, PSMA7, PSMA5, PSMA4, PSMA1, PSMA2 |
Mitochondrial L-carnitine shuttle |
2.35E00 |
1.11E-01 |
ACSL3, CPT1A |
Role of BRCA1 in DNA damage response |
2.27E00 |
4.76E-02 |
MSH2, MSH6, RAD50 |
Actin cytoskeleton signaling |
2.15E00 |
2.17E-02 |
WASL, CFL1, PIP4K2B, SLC9A1, MSN |
Regulation of actin-based motility by Rho |
1.98E00 |
3.49E-02 |
WASL, CFL1, PIP4K2B |
RhoGDI signaling |
1.82E00 |
2.13E-02 |
WASL, CFL1, PIP4K2B, MSN |
Rac signaling |
1.67E00 |
2.56E-02 |
RELA, CFL1, PIP4K2B |
RhoA signaling |
1.67E00 |
2.75E-02 |
CFL1,P IP4K2B, MSN |
Pentose phosphate (oxidative branch) |
1.63E00 |
2.5E-01 |
PGD |
Hereditary breast cancer signaling |
1.55E00 |
2.52E-02 |
MSH2, MSH6, RAD50 |
Glycine cleavage complex |
1.45E00 |
1.67E-01 |
GCSH |
LPS/IL-1 mediated inhibition of RXR function |
1.44E00 |
1.8E-02 |
HS6ST1, ACSL3, CPT1A, GSTP1 |
Semaphorin signaling in neurons |
1.42E00 |
3.85E-02 |
CFL1, DPYSL4 |
Acetyl-CoA biosynthesis I (pyruvate dehydrogenase complex) |
1.39E00 |
1.43E-01 |
DLAT |
ATM signaling |
1.32E00 |
3.28E-02 |
TRIM28, RAD50 |
Pathways are based on analyses of 93 proteins from the OPLS model /Supplementary Table S5
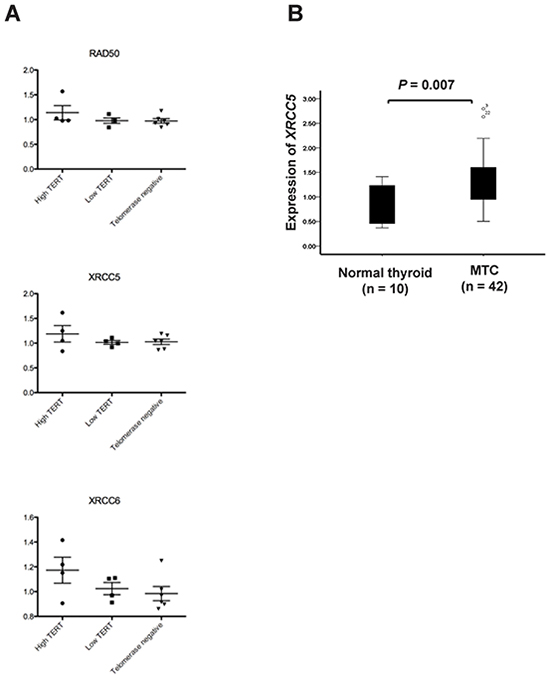
Figure 6: Expression of XRCC5 (Ku80), XRCC6 (Ku70) and RAD50 in sporadic MTCs. A. Scatter plots showing relative protein expression levels of RAD50, XRCC5 and XRCC6 in 14 MTCs based on HiRIEF-LC-MS/MS data. Separate plots are shown for telomerase positive MTCs with high or low TERT mRNA expression as well as for telomerase negative MTCs. B. Relative mRNA expression of the XRCC5 gene in 39 sporadic MTCs determined by qRT-PCR.
The IPA tool was subsequently used to identify upstream regulators of the proteins in the data that have altered expression levels. For this purpose the 240 proteins identified as significantly changed by student’s t-test (Supplementary Table S5) were analyzed regarding upstream regulators. This showed that FOXO1 was predicted as inhibited in the telomerase positive samples, based on the observed inhibition of a set of molecules such as STAT5B, NDUFAF1, CMC4, CDKN1B(p27) and BCL2.
Increased expression of XRCC5 in MTCs
XRCC5, which encodes the Ku80 subunit of the Ku heterodimer involved in DNA double strand break repair and has been associated with cancer development, was further analyzed in the MTC cohort. The mRNA expression of XRCC5 was found to be increased in MTCs as compared to normal thyroid tissue (P = 0.007; Figure 6B).
DISCUSSION
We have previously observed frequent telomerase activation and TERT expression in MTC tumors and identified TERT/telomerase as a prognostic factor in MTC patients [7]. In the present study, we further explored the mechanisms underlying these findings. To this end, we analyzed the TERT promoter methylation status and proteomic profiles, their relationship with TERT expression and clinical implications in MTCs.
The TERT promoter is highly GC-rich and in general unmethylated in normal human somatic cells irrespective of TERT expression status [12, 14]. In sharp contrast, TERT-expressing malignant cells exhibit promoter hypermethylation in certain regions [12, 13, 15]. It is believed that the acquisition of methylated CpGs in those specific regions leads to dissociation of TERT repressors from the TERT promoter, thereby contributing to the trans-activation of the TERT gene and subsequent telomerase activation in oncogenesis [12, 13, 15]. Indeed, we found significantly higher MetIs in MTC tumors than in normal thyroid tissues; and moreover, the score of MetIs was highly correlated with TERT mRNA and telomerase activity levels in MTCs. These results thus suggest that the hypermethylation of the TERT promoter plays an important part in the induction of TERT transcription and expression during MTC development, as seen in other human malignancies [12, 13, 15]. It may be argued that C-cells from which MTC is derived only constitute a minority of the normal thyroid cells and therefore a firm conclusion about increased MetI in MTC compared to its normal counterpart cannot be made. On the other hand, the observed low level of TERT promoter methylation in normal thyroids is in agreement with reports of several different types of non-cancer cells [12, 14].
The cancer-specific TERT promoter methylation has previously been tested for clinical significance [12, 13, 16]. However, most of these studies evaluated it as a cancer diagnostic biomarker. Only recently did Castelo-Branco and co-workers report that the TERT promoter methylation increased with cancer progression and could serve as a useful prognostic factor in posterior fossa ependymomas [12]. To see if this is also the case in MTCs, we divided the MTC patients into low and high MetI categories using the median score as a cut-off, and the result showed that a higher MetI was significantly associated with both shorter overall and disease-free survivals in MTC patients. Conceivably, higher MetIs might stimulate TERT expression and telomerase activation more potently, thereby contributing to more aggressive disease and shorter patient survival. It is currently unclear whether MetIs can act as a prognostic factor independently of TERT or telomerase activity, which calls for further clinical investigations in additional cohorts of MTC or other cancer patients. Furthermore, the correlation between MetI and TERT expression was not absolute, suggesting that additional mechanisms could also contribute to TERT expression such as transcriptional regulators with other binding sites or other epigenetic modifications.
As described above, the TERT promoter is not universally methylated in malignant cells. For instance, the CpG methylation is undetectable in the proximal TERT promoter (from -150 to +150 upstream of ATG) [17]. Furthermore, the methylated regions of the TERT promoter may differ among different types of cancer. The TERT promoter region that we chose for the present study was based on the result obtained from cancer cell lines [17]. Specifically, the interval at -550 bp from the ATG investigated here (Figure 1) is the same as the highly methylated region (included in BS-1) reported by Zinn et al. [17]. The two MTC cell lines studied here both showed very high MetIs at the same CpGs as investigated in the MTC tumors, supporting their relevance in cancers of different origins including thyroid C-cells. In addition, a region located down-stream in the TERT promoter was investigated in paediatric brain tumors and found to be hypermethylated [12]. Furthermore, in a region around the ATG of TERT low levels of methylation were shown to contribute to TERT expression [18].
Little is known about the mechanism underlying the TERT promoter hypermethylation in cancer. In the present study of MTCs, we noticed that MetIs were highly correlated with (i) the presence of RAS mutations, and (ii) shorter telomere length. Likely, oncogenic drivers promote target cells to over-proliferate; thereby leading to telomere over-erosion or crisis, and telomere crisis subsequently triggers both genomic catastrophic changes and telomerase activation. The TERT promoter hypermethylation may be mediated by genomic instability, and result in the dissociation of the specific repressors from the promoter, thereby derepressing TERT gene transcription and then activating telomerase.
In addition to the aberrant TERT promoter methylation, the TERT gene amplification has also been shown to frequently occur in many human malignancies and contribute to the up-regulation of TERT expression and telomerase activation [19, 20]. We thus determined whether the TERT copy number is altered in MTC tumors. Our analysis revealed that 5 of 39 (13%) MTC tumors carried 3 TERT copies, and all of them exhibited TERT expression and telomerase activation. It is not possible to evaluate their clinical significance due to too few patients. However, it may be noted that all 5 patients with increased TERT copy number presented with late stages of the disease, two of whom died of MTC and the remaining three had persistent disease. Taken together, the TERT copy number increase occurs in a subset of MTCs, and may be associated with TERT up-regulation and progressive disease.
As the TERT and telomerase regulation occurs at multiple levels, we further sought to characterize proteins related to and thus potentially responsible for TERT expression in MTCs. A total of 240 differentially expressed proteins were identified in group wide comparison of telomerase positive and negative MTCs tumors using a proteomic approach, among which 101 showed higher expression and 139 proteins had lower expression in telomerase positive tumors compared to those in the negative ones. Comparison with the protein expression profiles associated with RET and RAS mutation status, respectively, suggested that these are generally different from the proteins associated with telomerase activation (unpublished data). This would support that the 240 proteins identified were related to telomerase activation, and not merely a consequence of the underlying mutated drivers. On the other hand, RAS mutations could promote cellular over-proliferation at early stages when the TERT gene is still silent, leading to over-erosion of telomere length and subsequent telomere dysfunction/genomic instability. In in vitro immortalization models, it is well established that telomere dysfunction/genomic instability or catastrophe drives TERT transcription and telomerase activation, which is similar to that seen in in vivo settings. However, it remains unclear exactly how hypermethylation of the TERT promoter occur during in vitro cellular immortalization and in vivo malignant development, as well as how genomic catastrophe is linked to activation of TERT transcription. Among the proteins identified by upstream or pathway analyses, some such as CDKN1B (p27) and BCL2 are reported to regulate TERT transcription and telomerase activity [13]. While p27 inhibits telomerase activity and TERT expression [21, 22], BCL2 up-regulates telomerase activity [23]. It is currently unclear whether their effects on TERT expression are due to alterations in the methylation status of the TERT promoter, which calls for further detailed investigations.
Furthermore, FOXO1 was predicted as inhibited, and one of the functions of the FOXO1 transcription factor is to control expression of CDKN1B (p27), which in turn may inhibit TERT gene transcription.
The three proteins XRCC5 (Ku80), XRCC6 (Ku70) and RAD50 in the top enriched pathway “telomere extension by telomerase” have a role in telomere maintenance. However, the relationship between TERT regulation and most of these proteins remains to be defined, and further experimental studies are needed to elucidate this issue. Interestingly, XRCC5 (Ku80), XRCC6 (Ku70) and RAD50 are members of the non-homologous end joining (NHEJ) DNA repair machinery and are recurrently mutated genes in thyroid cancer according to the Catalogue of Somatic Mutations in Cancer (COSMIC) database. Moreover, another member of the NHEJ pathway, the mediator of DNA damage check point protein 1 gene (MDC1), has been similarly found to be recurrently mutated in MTCs [11]. The observed association between telomerase activity and this pathway through XRCC5/6 and RAD50 thus further supports a role for deregulation of the NHEJ pathway in subsets of MTCs. Given that telomere dysfunction/genomic instability or catastrophe is a strong driving-force for TERT transcription and telomerase it is conceivable that NHEJ proteins may be directly or indirectly involved in genetic and epigenetic alterations of the TERT gene in MTC. The present study does not provide direct evidence for such a link. However, a recent publication did show that telomere dysfunction or DNA damage significantly alters DNA repair, chromatin remodeling, histone modification and other epigenetic landscapes in telomerase-knockout mice [24].
It should be pointed out that TERT, as the catalytic component of telomerase, not only catalyzes telomeric DNA synthesis, but also exhibits multiple telomere lengthening-independent activities [25, 26]. One of such TERT functions is to serve as a co-factor, promoting beta-catenin target gene transcription [25, 27]. Therefore, it is most likely that subsets of those 240 differentially expressed proteins observed between TERT-positive and negative tumors are due to the presence and absence of TERT expression. Nevertheless, the telomere lengthening-independent functions of TERT may also play important roles in cancer progression, which eventually leads to poor outcomes as seen in MTC and other cancer patients [25].
In summary, we show here that increased TERT copy number and TERT promoter hypermethylation are highly correlated with TERT expression in MTCs, indicating their contribution to telomerase activation; higher MetIs predict shorter overall and disease-free survival in MTC patients. Moreover, we identified differences in protein expression profiles between telomerase positive and negative MTC tumors, and their relationship with TERT expression remains to be defined. Collectively, the present findings not only provide insights into the mechanism underlying telomerase activation in MTCs, but also carry important clinical significance.
MATERIALS AND METHODS
MTC cell lines
MTC-TT was obtained from ATCC (LGC Standards GmhH, Germany), and MZ-CRC-1 was kindly provided by Professor Bruce Robinson and Professor Stan Sidhu, University of Sydney, Australia. Both cell lines were grown in DMEM with 10% fetal bovine serum (FBS), and verified by sequencing to carry RET mutations.
Patients and clinical samples
The study includes 42 patients (39 sporadic and three MEN2) who were operated for MTC between 1986 and 2010 at the Karolinska University Hospital, Stockholm. The clinical information is provided in detail for each case in Supplementary Table S1. The diagnosis was established after routine histopathological examination following criteria of the WHO guidelines [8]. Ten histopathologically verified non-cancerous thyroid tissue samples from patients operated for a benign thyroid tumor were included as normal references. All tissue samples were retrieved from the Karolinska University Hospital Biobank. Informed consent was obtained from all patients and the study of the tissue samples was approved by the local ethics committee.
All 42 MTCs have previously been studied for C228T and C250T TERT promoter mutation, TERT expression, telomerase activity and telomere length, and a subset for the ALT phenotype (Supplementary Table S2) [4, 7]. In addition the mutation status for RET hot spot exons and HRAS, NRAS and KRAS hot spot codons have been performed (Wang et al. manuscript in preparation).
DNA extraction
Genomic DNA was extracted using the DNeasy® Blood & Tissue kit (QIAGEN, Germany). Samples were quantified with a NanoDrop ND-100 spectrophotometer (Nano Drop Technologies, Wilmington, DE, USA) and stored at −80 °C until use.
DNA copy number assay
Copy numbers of the TERT gene locus were assessed in MTCs and normal thyroid tissues by a TaqMan-based assay. All samples were run in quadruplicate in a 96-well plate using commercially available assays for TERT (Hs 01237576_CN) and the endogenous control RNase P (4403326_CN). The results were normalized to the endogenous control followed by calibration to normal human reference DNA (Promega). TERT copy numbers were predicted using the CopyCaller software version 2.0 (Applied Biosystems, Foster City, CA, USA).
Bisulfite pyrosequencing
Methylation density at the TERT promoter was quantified in MTCs, normal thyroid samples and MTC cell lines by Pyrosequencing. Genomic DNA (150 ng) was subjected to sodium bisulfate modification using the EpiTect Bisulfite Kit (Qiagen AB, Sweden) according to the recommendations of the manufacturer. Converted DNA was then used as template for PCR amplification at 58 °C annealing temperature. A Pyrosequencing assay targeting eight CpGs in the TERT promoter (Figure 1) was designed using PyroMark Assay Design software version 2.0 (Qiagen). The assay included the following primers: 5′-GGGTTTGTGTTAAGGAGTTTAAGT-3′ (forward biotinylated); 5′-AAACCCAAAACTACCTCCA-3′ (reverse); and 5′-CCAAAACTACCTCCAAAT-3′ (sequencing). The PCR products were immobilized to streptavidin-coated Sepharose beads and were captured using a pump with filter. Pyrosequencing reactions were run in a PyroMark Q24 and the data were analysed with the PyroMark Q24 software (Qiagen AB, Sweden). For each sample, a methylation index (Met I) was calculated as the mean methylation level of all CpG dinucleotides covered [28]. The methylation status in MTCs was defined based on the comparison to the normal thyroid samples.
Protein extraction and iTRAQ labeling for HiRIEF-LC-MS/MS
Fourteen MTCs (8 with telomerase activation and 6 without telomerase activation) were included in the HiRIEF-LC-MS/MS analysis essentially following previously published procedures [29]. Tumor samples were treated in sample buffer consisting of 4% SDS, 25 mM HEPES pH 7.6, 1 mM DTT followed by homogenizing with pestle. Protein extraction was performed by cell lysis at 90 °C for 15 min, and sonication at room temperature to shear DNA and reduce viscosity. The lysates were cleared by centrifugation (10,000g for 20 min), and the supernatant containing the soluble protein fraction was transferred to a new tube. Protein concentrations were determined using Bio-Rad DCC. Extracted proteins were precipitated in four volumes of ice cold acetone to remove lysis buffer. Samples were kept on ice for one hour and centrifuged for 10 minutes at 4 °C and 12,000g. Protein pellets were allowed to air dry, dissolved in 0.2% SDS and protein concentrations were determined again.
A protein aliquot from each sample was reduced and alkylated with iodoacetamide, and digested with trypsin. Peptides were then labeled with 8-plex iTRAQ (isobaric tags for relative and absolute quantitation). For standardization between the two sets, an internal standard consisting of a mixture of all 14 samples was labeled and included in both iTRAQ sets. Excess iTRAQ reagent and detergents were removed by strong cation exchange solid phase extraction (Strata X-C 33 μm polymeric SCX, Phenomenex). Purified samples were freeze dried in a SpeedVac system and placed in −80 °C overnight.
HiRIEF-LC-MS/MS analysis and protein identification
Protein samples were iTRAQ labeled and pooled samples were separated on both narrow range IPG strips (pH 3.7 – 4.9) and on ultra-narrow range IPG strips (pH 4.0 – 4.2). After separation, peptides were eluted from the gel strips into 72 fractions for each strip. These fractions were one by one subjected to reversed phase LC-MS/MS, where the peptides were fragmented to obtain the amino acid sequences. LC-MS was performed on a hybrid LTQ-Orbitrap Velos mass spectrometer (Thermo Fischer Scientific, San Jose, CA, USA). An Agilent HPLC 1200 system (Agilent Technologies, Santa Clara, CA, USA) was used for online reversed-phase nano-LC at a flow of 0.4 μl/min. Solvent A included 97 % water, 3 % ACN, and 0.1 % formic acid; and solvent B had 5 % water, 95 % ACN, and 0.1 % formic acid. The curved gradient went from 2 % B up to 40 % B in 45 min, followed by a steep increase to 100 % B in 5 min. Samples (3 (of 8) μl from each IPG fraction) were trapped on Zorbax 300SB-C18, 5 μm, 5 x 0.3 mm (Agilent Technologies, Santa Clara, CA, USA) and separated on a NTCC-360/100-5-153 C18 column (Nikkyo Technos Co., Tokyo, Japan) installed on to the nano electrospray ionisation (NSI) source of the Orbitrap Velos instrument. Acquisition proceeded in ~3.5 s scan cycles, starting by a single full scan MS at 30000 resolution (profile mode), followed by two stages of data-dependent tandem MS (centroid mode): the top 5 ions from the full scan MS were selected firstly for collision induced dissociation (CID, at 35 % energy) with MS/MS detection in the ion trap, and finally for high energy collision dissociation (HCD, at 37.5 % energy) with MS/MS detection in the Orbitrap. Precursors were isolated with a 2 m/z width and dynamic exclusion was used with 60 s duration. The fragment spectra from the mass spectrometer were then matched to a database consisting of theoretical fragment spectra from all human proteins; this way the protein identities can be obtained. Quantitative information was acquired from the fragment spectra by using the iTRAQ reporter ion intensities.
Proteomics data analysis
In total, 4,837 proteins (1% FDR on peptide level) were identified across the samples, with quantitative information retrieved for 4,321 proteins These 4,321 proteins were first assessed by principal component analysis (PCA) [30]. This method allows for detection of outliers and groupings among the samples. Protein levels were compared between telomerase positive and negative MTCs using student’s t-test.
Further, multivariate data analyses were used to find groups of proteins that separate telomerase positive MTCs with different levels of TERT mRNA expression. These proteins will not necessarily be significant in univariate analysis comparing the two groups, but together they can form a panel of proteins that can classify tumors according to telomere activity status based on quantitative proteome data. This set of proteins can be used in downstream analysis to elucidate involved pathways or biological processes. For multivariate analysis orthogonal projections to latent structures (OPLS) [31] analysis was used as well as the commercial software package Ingenuity Pathway Analysis (IPA). For OPLS analysis, only the eight telomerase positive samples with different TERT mRNA levels were included to allow distinction of proteins important for the level of TERT mRNA expression. The proteins that distinguished MTCs with high versus low TERT expression in the OPLS analysis were analyzed with software in the Ingenuity Pathway Analysis (IPA) program to reveal connections to canonical pathways and find enriched pathways among the defined protein set.
RNA extraction and reverse transcription-quantitative real-time PCR (qRT-PCR)
RNA was extracted from frozen tissue samples of MTCs and normal thyroids using the mirVana miRNA Isolation kit (Appied Biosystems), and cDNA was synthesized from RNA using High-Capacity cDNA Reverse Transcription kit (Invitrogen). qRT-PCR was carried out in an ABI 7900HT Real time PCR System (Applied Biosystems) using SYBR® Green PCR master mix (Invitrogen) for XRCC5 (Hs00162669_m1) and β-actin as endogenous control. Expression levels of XRCC5 mRNA were calculated based on the threshold cycle (Ct) values and normalization to human β-actin mRNA.
Statistical analysis
The statistical analyses were performed with the SPSS software version 18.0 for windows. Differences between groups were evaluated by chi-square test (χ2) or Fisher’s exact test (where appropriate) and Mann-Whitney U test. Spearman rank order correlation was performed to analyze correlation between TERT methylation, age, TERT expression, and telomere length. A cut-off of MetI 52% was selected based on the median value for the 39 sporadic MTCs and based on the optimal sensitivity and specificity. Survival curves were illustrated by Kaplan-Meier plots, and significance was calculated by log-rank test. P-values < 0.05 were regarded as statistically significant.
ACKNOWLEDGMENTS
The authors wish to thank Ms Lisa Ånfalk for excellent assistance in collecting tissue samples, and the medical genetics group for valuable discussions. The study was financed by grants from the Swedish Cancer Society, the Swedish Research Council, Stockholm County Council and the Cancer Society in Stockholm.
CONFLICTS OF INTEREST
The authors declare that they have no known conflicts of interest in this work.
REFERENCES
1. Blackburn EH, Greider CW, Szostak JW. Telomeres and telomerase: the path from maize, Tetrahymena and yeast to human cancer and aging. Nat Med. 2006; 12:1133–1138.
2. Horn S, Figl A, Rachakonda PS, Fischer C, Sucker A, Gast A, Kadel S, Moll I, Nagore E, Hemminki K, Schadendorf D, Kumar R. TERT promoter mutations in familial and sporadic melanoma. Science. 2013; 339:959–961.
3. Huang FW, Hodis E, Xu MJ, Kryukov GV, Chin L, Garraway LA. Highly recurrent TERT promoter mutations in human melanoma. Science 2013; 339:957–959.
4. Liu T, Wang N, Cao J, Sofiadis A, Dinets A, Zedenius J, Larsson C, Xu D. The age- and shorter telomere-dependent TERT promoter mutation in follicular thyroid cell-derived carcinomas. Oncogene 2014; 33:4978–4984.
5. Liu X, Bishop J, Shan Y, Pai S, Liu D, Murugan AK, Sun H, El-Naggar AK, Xing M. Endocr Relat Cancer 2013; 20: 603–610.
6. Killela PJ, Reitman ZJ, Jiao Y, Bettegowda C, Agrawal N, Diaz LA Jr, Friedman AH, Friedman H, Gallia GL, Giovanella BC, Grollman AP, He TC, He Y, et al. TERT promoter mutations occur frequently in gliomas and a subset of tumors derived from cells with low rates of self-renewal. Proc Nat Acad Sci USA 2013; 110:6021–6026.
7. Wang N, Xu D, Sofiadis A, Höög A, Vukojeviä V, Bäckdahl M, Zedenius J, Larsson C. Telomerase-dependent and independent telomere maintenance and its clinical implications in medullary thyroid carcinoma. J Clin Endocrinol Metab. 2014; 99:E1571–1579.
8. DeLellis RA. Pathology and genetics of tumours of endocrine organs. Lyon: IARC Press; 2004. 320
9. Kloos RT, Eng C, Evans DB, Francis GL, Gagel RF, Gharib H, Moley JF, Pacini F, Ringel MD, Schlumberger M, Wells SA Jr. Medullary thyroid cancer: management guidelines of the American Thyroid Association. Thyroid. 2009; 19:565–612
10. Moura MM, Cavaco BM, Pinto AE, Leite V. High prevalence of RAS mutations in RET-negative sporadic medullary thyroid carcinomas. J Clin Endocrinol Metab. 2011; 96:E863-868.
11. Agrawal N, Jiao Y, Sausen M, Leary R, Bettegowda C, Roberts NJ, Bhan S, Ho AS, Khan Z, Bishop J, Westra WH, Wood LD, Hruban RH, et al. Exomic sequencing of medullary thyroid cancer reveals dominant and mutually exclusive oncogenic mutations in RET and RAS. J Clin Endocrinol Metab. 2013; 98:E364–369.
12. Castelo-Branco P, Choufani S, Mack S, Gallagher D, Zhang C, Lipman T, Zhukova N, Walker EJ, Martin D, Merino D, Wasserman JD, Elizabeth C, Alon N, et al. Methylation of the TERT promoter and risk stratification of childhood brain tumours: an integrative genomic and molecular study. Lancet Oncol. 2013; 14:534–542.
13. Daniel M, Peek GW, Tollefsbol TO. Regulation of the human catalytic subunit of telomerase (hTERT). Gene. 2012; 498:135–146.
14. Devereux TR, Horikawa I, Anna CH, Annab LA, Afshari CA, Barrett JC. DNA methylation analysis of the promoter region of the human telomerase reverse transcriptase (hTERT) gene. Cancer Res. 1999; 59:6087–6090.
15. Guilleret I, Yan P, Grange F, Braunschweig R, Bosman FT, Benhattar J. Hypermethylation of the human telomerase catalytic subunit (hTERT) gene correlates with telomerase activity. Int J Cancer. 2002; 101:335–341.
16. Schache AG, Hall G, Woolgar JA, Nikolaidis G, Triantafyllou A, Lowe D, Risk JM, Shaw RJ, Liloglou T. Quantitative promoter methylation differentiates carcinoma ex pleomorphic adenoma from pleomorphic salivary adenoma. Br J Cancer. 2010; 103:1846–1851.
17. Zinn RL, Pruitt K, Eguchi S, Baylin SB, Herman JG. hTERT is expressed in cancer cell lines despite promoter DNA methylation by preservation of unmethylated DNA and active chromatin around the transcription start site. Cancer Res. 2007; 67:194–201.
18. Renaud S, Loukinov D, Abdullaev A, Guilleret Z, Bosman FT, Lobanenkov V, Benhattar J. Dual role of DNA methylation inside and outside of CTCF-binding regions in the transcriptional regulation of the telomerase hTERT gene. Nucleic Acids Res. 2007; 35:1245–1256.
19. Zhang A, Zheng C, Lindvall C, Hou M, Ekedahl J, Lewensohn R, Yan Z, Yang X, Henriksson M, Blennow E, Nordenskjöld M, Zetterberg A, Björkholm M, et al. Frequent amplification of the telomerase reverse transcriptase gene in human tumors. Cancer Res. 2000; 60:6230–6235.
20. Xie H, Liu T, Wang N, Björnhagen V, Höög A, Larsson C, Lui WO, Xu D. TERT promoter mutations and gene amplification: promoting TERT expression in Merkel cell carcinoma. Oncotarget. 2014; 5:10048–10057. doi:10.18632/oncotarget.2491.
21. Zhang W, Tong Q, Wu Q, Li S, Wang X, Wang Q. Upregulated p27kip1 can downregulate survivin expression and inhibit telomerase activity in gastric carcinoma cells. Cancer Invest. 2009; 27:898–900.
22. Lee SH, Kim JW, Oh SH, Kim YJ, Rho SB, Park K, Park KL, Lee JH. IFN-gamma/IRF-1-induced p27kip1 down-regulates telomerase activity and human telomerase reverse transcriptase expression in human cervical cancer. FEBS Lett. 2005; 579: 1027-1033.
23. Mandal M, Kumar, R. Bcl-2 modulates telomerase activity. J Biol Chem. 1997; 22:14183–14187.
24. Colla S, Ong DS, Ogoti Y, Marchesini M, Mistry NA, Clise-Dwyer K, Ang SA, Storti P, Vaile A, Giuliani N, Ruisaard K, Ganan Gomez I, Bristow CA, et al. Telomere dysfunction drives aberrant hematopoietic differentiation and myelodysplastic syndrome. Cancer Cell. 2015; 27:644–657.
25. Liu Z, Li Q, Li K, Chen L, Li W, Hou M, Liu T, Yang J, Lindvall C, Björkholm M, Jia J, Xu D. Telomerase reverse transcriptase promotes epithelial-mesenchymal transition and stem cell-like traits in cancer cells. Oncogene. 2013; 32:4203–4213.
26. Cong Y, Shay JW. Actions of human telomerase beyond telomeres. Cell Res. 2008; 18:725–732.
27. Park JI, Venteicher AS, Hong JY, Choi J, Jun S, Shkreli M, Chang W, Meng Z, Cheung P, Ji H, McLaughlin M, Veenstra TD, Nusse R, McCrea PD, Artandi SE. Telomerase modulates Wnt signalling by association with target gene chromatin. Nature. 2009; 460:66–72.
28. Fotouhi O, Adel Fahmideh M, Kjellman M, Sulaiman L, Höög A, Zedenius J, Hashemi J, Larsson C. Global hypomethylation and promoter methylation in small intestinal neuroendocrine tumors: an in vivo and in vitro study. Epigenetics. 2014; 9:987–997.
29. Branca RM, Orre LM, Johansson HJ, Granholm V, Huss M, Pérez-Bercoff Å, Forshed J, Käll L, Lehtiö J. HiRIEF LC-MS enables deep proteome coverage and unbiased proteogenomics. Nat Methods. 2014; 11:59–62.
30. Wold S, Esbensen K, Geladi P. Principal component analysis. Chemometrics and Intelligent Laboratory Systems. 1987; 2:37–52.
31. Trygg J, Wold S. Orthogonal projections to latent structures (O-PLS). J Chemometr. 2002; 16:119–128.