
INTRODUCTION
Gastric cancer is often diagnosed in advanced stage [1], and 5-FU-based chemotherapy is currently recommended as the first-line treatment [2]. As the overall response rate is only about 20-40% [3], it is urgent to develop a signature to recognize patients who cannot benefit from 5-FU-based chemotherapy and recommend them to other chemotherapy regimens. A number of previous studies focused on genes related to 5-FU metabolism (TS, TP, DPD), DNA repair (ERCC1, ERBB2) or apoptosis (BCL2, BAX) to find signatures of 5-FU resistance [4–8] but few have been validated [9]. Then, many studies have turned to use gene expression profiles to identify prognostic signatures for chemo-treated gastric cancer patients, usually based on risk scores summarized from the expression measurements of signature genes [10, 11]. However, this type of signatures cannot be applied directly to independent inter-laboratory data because their applications require pre-setting risk thresholds which are sensitive to experimental batch effects [12]. Although many batch effect correction algorithms and data normalization methods have been proposed, they can hardly correct such biases and even distort the real biological signals [13]. Even if it would be possible to pre-collect a set of samples to measure together with a particular sample for data normalization, the risk-score based signatures would still have a critical limitation that the risk classification of a sample will change with the uncertain risk compositions of the other samples adopted for normalization together, as systematically revealed in our recent work [14]. In contrast, it has been reported that the within-sample relative expression orderings (REOs) of genes are insensitive to experimental batch effects and invariant to monotonic data normalization [15]. With this unique advantage, the REOs-based signatures can perform robustly across datasets produced by different laboratories and allow application at the individual levels [16]. Therefore, it is worthy adopting the REOs-based approach to extract robust prognostic signatures for clinical application.
Notably, researchers often firstly identify prognostic signatures of overall survival (OS) or relapse risk for chemo-treated patients, and then prove the drug benefit predictive value by showing that these signatures could not predict prognoses of patients not receiving chemotherapy [11, 17, 18]. However, this approach is challenged by the argument that patients receiving and not receiving the chemotherapy may have systemic differences in malignant degree of tumor or corporeity [19]. To increase the relevance of prognostic signatures to drug-resistance, Kim et al. [17] pre-selected “drug-resistance” genes from differentially expressed genes (DEGs) between non-responders and responders of patients with the chemotherapy treatment. However, because the tissue samples of non-responders were dissected from patients after the chemotherapy treatment, these DEGs may mainly reflect tissue’s response to drug stimuli rather than drug resistance [20]. The same problem exists when pre-selecting DEGs between drug-induced resistant cell lines and parental cell lines [21, 22].
Another major problem in studies for extracting drug resistance signatures for a single drug on clinical trials is that currently combination administration of drugs is conventionally used for cancer chemotherapy [23]. In such a situation, human cancer-derived cell line models provide the only chance to identify drug resistance signature for a single drug [24–26] although the clinical relevance of cancer cell line models remains controversial [27]. Recently, we have proved that if two chemo-regimens shared one or several drugs, then the overlaps between their clinically relevant drug resistance genes (CRGs), defined as the genes differentially expressed in the non-responders compared with responders respectively for the two chemo-regimens, should be (or largely be) the CRGs for the shared single or multiple drugs, given that the drugs used in combination have no (or limited) antagonistic effects [28]. Thus, if we could firstly identify a set of genes positively or negatively associated with 5-FU GI50 (50% Growth Inhibition) from gastric cancer cell lines and prove that they are correspondingly negatively or positively associated with prognoses of patients treated with a chemo-regimen including 5-FU as a component, then these genes should be CRGs for 5-FU shared by the cancer cell models and clinical chemo-regimen, given that patients with poor or good prognoses should largely represent non-responders or responders to 5-FU treatment. In this process, the clinical relevance of the cancer cell line models could be evaluated by statistical evidence of concordance analysis (see Materials and Methods) that the genes positively or negatively correlated with 5-FU GI50 values of the cell lines were non-randomly negatively or positively correlated with prognoses of patients treated with 5-FU-based chemotherapy.
In this study, by pre-selecting genes correlated with both 5-FU GI50 of gastric cancer cells and OS of patients treated with 5-FU-based chemotherapy, we extracted and validated a prognostic signature consisting of two gene pairs. The within-sample REOs of these gene pairs could robustly stratify patients into distinct prognostic groups. Using the robust REOs-based signature, we classified the gastric cancer samples of The Cancer Genome Atlas (TCGA) [29] into two groups. Then, instead of analyzing the TCGA samples’ survival data which were confounded with complex chemotherapy regimens and treatment cycles [30], we confirmed that the two identified groups of TCGA samples represented the prognostic groups by evidence that they had the same distinct transcriptional characteristics with the prognostics groups identified in the validation dataset. This strategy enabled us to exploit the TCGA multi-omics data to reveal the distinct copy number, gene mutation and DNA methylation landscapes of the prognostic groups.
RESULTS
Extraction of the REOs-based 5-FU-relevant prognostic signature
We hypothesized that genes which are differentially expressed between 5-FU-resistant and -sensitive cell lines while also showing concordant correlation with prognosis in patients could robustly predict prognoses of gastric cancer patients treated with 5-FU-based chemotherapy (Figure 1). Tan et al. [31] classified 28 gastric cancer cell lines into two subtypes which had significantly different average 5-FU GI50 values [32], and we defined them as 5-FU-resistant subtype and 5-FU-sensitive subtype, respectively. Based on the gene expression profiles of these cell lines (GSE22183, Table 1), 2,175 DEGs were detected (Student’s t-test, FDR < 20%) between the two subtypes. Notably, 5 of the 17 cells in the 5-FU-resistant subtype had GI50 values below the median of the GI50 values of the 28 cells while 2 of the 11 cells in the 5-FU-sensitive subtype had GI50 values above the median. When reclassifying these 5 and 2 cell lines into the 5-FU-sensitive and FU-resistant groups, respectively, no DEGs could be detected between the two groups with the same 20% FDR control. Thus, we chose to use the DEGs between the primary subtypes defined by Tan et al. [31] for the 28 cell lines as candidates of 5-FU resistance relevant genes. Statistically, these DEGs should include the genes associated with 5-FU resistance given that most of 5-FU-resistant and 5-FU-sensitive cells were correctly identified. Then, to ensure the relevance of the candidate genes to 5-FU resistance, we further extracted genes correlated with 5-FU GI50 values of the cells from these DEGs. In this regard, from the 2,175 DEGs between the two subtypes, we were able to extract 100 genes whose expression levels were significantly correlated with 5-FU GI50 values of the 28 cell lines with a reasonable statistical control (FDR < 20%, Pearson correlation analysis). Notably, without the process of preselecting candidates of 5-FU resistance genes, no genes could be found to be significantly correlated with 5-FU GI50 values of the 28 cell lines at an acceptable FDR control level (e.g., FDR < 20%) due to the conservativeness of multiple testing correction. Then, based on the gene expression profiles of 35 gastric cancer patients treated with 5-FU-based chemotherapy extracted from the GSE15459 dataset (Table 1) [31], denoted as GC35, we found 14 of the 100 GI50-related genes tended to be significantly associated with patients’ OS (univariate Cox model, P < 0.05). The concordance score of the clinical relevance of these 14 genes was 100%, which was unlikely to be observed by chance (binomial distribution test, P < 6.10E–05; see Materials and Methods). In the following analyses, we focused on analyzing nine of the 14 genes, which were also measured in the validation GSE14208 dataset produced by the Affymetrix U133A 2.0 platform (Table 1).
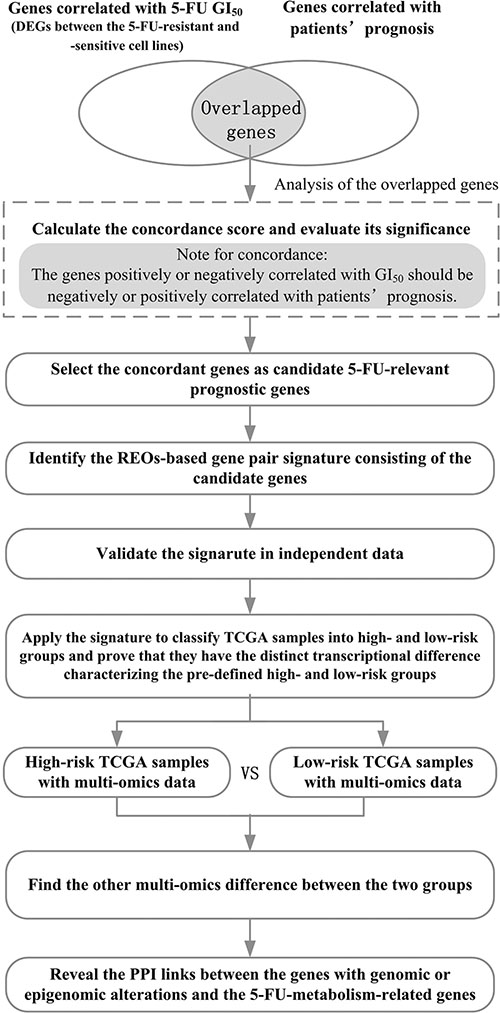
Figure 1: The flowchart for depicting the development, validation and application of the 5-FU-relevant prognostic signature.
Table 1: The datasets of gastric cancer cell lines and tissues analyzed in this study
Accession |
Size |
Omics |
Platform |
Stage |
Treatment |
|---|---|---|---|---|---|
Samples of gastric cancer cell lines |
|||||
GSE22183a |
28 |
mRNA |
AffymetrixU133 Plus 2.0 |
- |
5-FU |
Samples of gastric cancer tissues |
|||||
GSE15459b |
35 |
mRNA |
AffymetrixU133 Plus 2.0 |
I–IV |
5-FU-based |
GSE14208c |
123 |
mRNA |
AffymetrixU133A 2.0 |
IV |
5-FU plus cisplatin |
GSE15459b |
130 |
mRNA |
AffymetrixU133 Plus 2.0 |
I–IV |
Surgery alone |
TCGAd |
329 |
mRNA |
IlluminaHiSeqRNASeq |
I–IV |
Mixed |
TCGAe |
327 |
Copy number |
Genome Wide SNP 6.0 |
I–IV |
Mixed |
TCGAe |
289 |
Somatic mutation |
IlluminaGADNASeq/IlluminaHiSeq |
I–IV |
Mixed |
TCGAe |
293 |
DNA methylation |
HumanMethylation450 |
I–IV |
Mixed |
Abbreviation: 5-FU, 5-Fluorouracil;
aThe gene expression profiles of 28 gastric cancer cell lines with 5-FU GI50 data in this dataset were analyzed. 17 and 11 cell lines were defined as 5-FU-resistant and 5-FU-sensitive, respectively.
bIn this dataset, there were 35 samples of patients treated with 5-FU-based chemotherapy and 130 samples of patients treated with surgery alone. These two groups of samples were analyzed. The clinical information of patients was kindly provided by Dr. Ju-Seog Lee.
cThe survival data of patients was kindly provided by Dr. Jeffrey E. Green.
dOnly 329 TCGA samples of patients in stage I-IV with mRNA-seq profiles, measured by IlluminaHiSeq RNASeq, were analyzed.
e327, 289 and 293 samples among the 329 TCGA samples with mRNA-seq profiles also had copy number, somatic mutation and DNA methylation data produced by the corresponding platforms, respectively.
For every two of the nine candidate genes, according to their within-sample REO, we classified the 35 gastric cancer samples of the GC35 dataset into two groups and then evaluated whether they had significantly different OS (see Materials and Methods). Using univariate Cox model, we found two gene pairs (KCNE2 and PRPF3, KCNE2 and API5) whose REOs were likely to be associated with patients’ OS (P < 0.05). KCNE2 had lower expression level than both PRPF3 and API5 in the high-risk group, whereas the REOs were reversed in the low-risk group. Thus, a simple rule was used to classify patients: a patient would be predicted to be of high risk if and only if KCNE2 had lower expression level than both PRPF3 and API5. According to this rule, 24 and 11 of the 35 samples were classified into the high- and low-risk groups, respectively, and the former had significantly shorter OS than the latter (HR = 2.78, 95%CI 1.05−7.39, log-rank P = 3.39E-02, Figure 2A). A multivariate Cox analysis showed that the signature still tended to be prognostic after adjusting for stage, grade and gender even though the size of the GC35 dataset was small (P = 0.11, Table 2). As the 35 patients were treated with 5-FU combined with other drugs after surgery, we hypothesized that the high-risk patients could benefit from neither 5-FU nor the other drugs used in combination, whereas the majority of low-risk patients could benefit from 5-FU-based chemotherapy. Thus, we defined these two gene pairs as 5-FU-relevant prognostic signature.
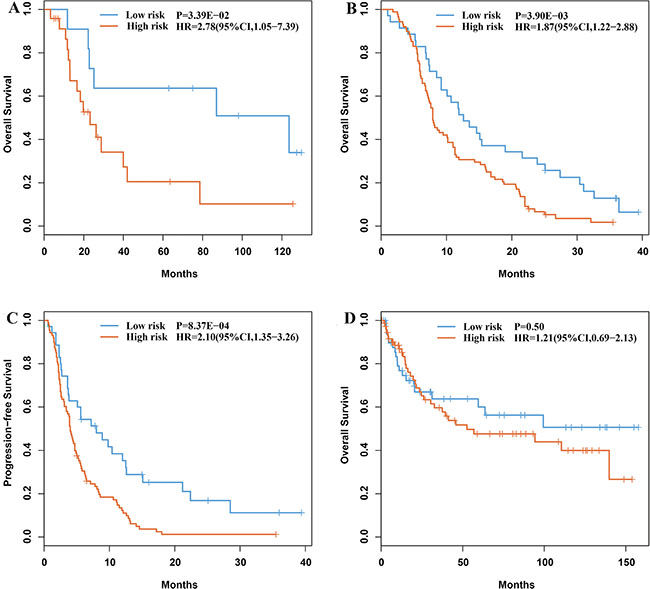
Figure 2: Kaplan-Meier estimates of overall survival and time to progression of the prognostic groups identified by the signature. (A) Overall survival curves for the GC35 dataset. (B) Overall survival curves for the GC123 dataset. (C) Time to progression curves for the GC123 dataset. (D) Overall survival curves of the 130 gastric cancer patients treated with surgery alone.
Table 2: Univariate and multivariate Cox regression analysis for the 5-FU-relevant prognostic signature
Variables |
Univariate model |
Multivariate model |
||
|---|---|---|---|---|
HR (95%CI) |
P |
HR (95%CI) |
P |
|
The Prognostic signature |
||||
Low-risk |
1 [Reference] |
|
1 [Reference] |
|
High-risk |
2.78 (1.05–7.39) |
3.39E–02 |
2.40 (0.83–6.96) |
0.11 |
Tumor stage |
||||
I–II |
1 [Reference] |
|
1 [Reference] |
|
III–IV |
2.05 (0.79–5.29) |
0.14 |
1.40 (0.47–4.11) |
0.55 |
Tumor grade |
||||
Moderate |
1 [Reference] |
|
1 [Reference] |
|
Poor/Undifferentiated |
1.95 (0.66–5.81) |
0.23 |
1.79 (0.56–5.72) |
0.32 |
Gender |
||||
Female |
1 [Reference] |
|
1 [Reference] |
|
Male |
0.74 (0.29–1.92) |
0.55 |
0.64 (0.21–1.96) |
0.43 |
Abbreviation: HR, hazard ratio; CI, confidence interval.
It has been reported that overexpression of KCNE2, which encodes a member of potassium channel on plasma membrane, can facilitate cell apoptosis by mediating K+ efflux [33]. Overexpression of API5, which encodes an apoptosis inhibitory protein, is related to poor prognosis in various cancers [34]. PRPF3 encodes a constitutive protein associated with U4 and U6 small nuclear ribonucleoproteins (snRNPs) which make up spliceosome, and abnormal splicing activity is associated with 5-FU efficacy [35].
With the same approach, we have also analyzed the clinical relevance of cisplatin IC50 (50% Inhibitory Concentration)-related genes based on data of gastric cancer cell lines but failed to find their correlations with prognosis (see Supplementary Results). This result seems to be consistent with previous reports that no significantly different OS was observed between the 5-FU and cisplatin combination chemotherapy arm and 5-FU alone arm [36, 37]. Therefore, cisplatin therapeutic significance for gastric cancer should be further investigated.
Validation of the REOs-based 5-FU-relevant prognostic signature
We validated the signature in the GSE14208 dataset (Table 1), denoted as GC123, which included data for 118 gastric cancer patients treated with 5-FU in combination with cisplatin and five patients treated with capecitabine in combination with cisplatin, respectively [17]. As capecitabine is a fluorouracil pro-drug, we collectively regarded the chemo-regimens of the GC123 dataset as 5-FU-based chemotherapy. The signature predicted 88 and 35 of the 123 patients into high- and low-risk groups, respectively. Compared with the low-risk group, the high-risk group had significantly shorter OS (HR = 1.87, 95%CI 1.22-2.88, log-rank P = 3.90E–03, Figure 2B) and time to progression (TTP) (HR = 2.10, 95%CI 1.35−3.26, log-rank P = 8.37E–04, Figure 2C). The GC123 dataset lacked the necessary clinical data for multivariate Cox analysis. Alternatively, we proved that the transcriptome difference between the prognostic groups for the stage IV samples identified in this dataset was consistent with the corresponding difference for the 24 stage I–III samples involved in the GC35 dataset. Using Student’s t-test, with FDR < 20%, we extracted 3,927 DEGs between the high- and low-risk groups of stage IV samples from the GC123 dataset. Among these 3,927 DEGs, 456 genes were found to be deregulated between the 15 high-risk samples and 9 low-risk samples identified from the 24 stage I–III samples in the GC35 dataset (Student’s t-test, P < 0.05). The concordance score of the 456 overlapped DEGs was 98.25%, which was unlikely to happen by chance (binomial distribution test, P < 1.11E–16; see Materials and Methods). This result provided evidence that the signature was independent of the disease stage.
Functional enrichment analyses (hypergeometric distribution model, FDR < 10%) revealed that the up-regulated genes in the high-risk group compared with the low-risk group identified from the GC123 dataset were significantly enriched in spliceosome, cell cycle, DNA replication, DNA repair (including mismatch repair, nucleotide excision repair, base excision repair and Homologous recombination) and ECM-receptor interaction, whereas the down-regulated genes were significantly enriched in immune, cell adhesion molecules and drug metabolism related pathways (Supplementary Table S1). The pathways enriched with DEGs between the two groups from the GC35 dataset were all reproducible in GC123 (Supplementary Table S2).
Finally, we applied the signature to predict the survival of the 130 samples of gastric cancer patients treated with surgery alone, which were extracted from the GSE15459 dataset and found that it could not stratify the patients into two groups with significantly different OS (HR = 1.21, 95%CI 0.69−2.13, log-rank P = 0.50, Figure 2D). This reflected that the signature was not just prognostic for gastric cancer patients in general but predictive for patient’s benefit from 5-FU-based chemotherapy.
Distinct genomic characteristics of prognostic groups
Applying the prognostic signature to the gene expression profiles of 329 gastric cancer samples documented in TCGA (Table 1), we recognized 286 high-risk patients and 43 low-risk patients. Between the two prognostic groups for patients in stage I, II, III and IV, respectively, we detected 1,323, 3,103, 2,823 and 761 DEGs (Rank Products, FDR < 20%). The four lists of DEGs shared 269, 706, 736 and 182 genes with the 3,927 DEGs from the GC123 dataset for stage IV patients, and the concordance scores were 90.17%, 83.85%, 95.11% and 89.01% (binomial distribution test, all values of P < 1.11E-16), respectively. This result provided further evidence that the signature was independent of the disease stage. Among the 329 TCGA tumors, 327 (284 high-risk and 43 low-risk samples) had copy number alteration data; 289 (249 high-risk and 40 low-risk samples) had somatic mutation data; and 293 (252 high-risk and 41 low-risk samples) had DNA methylation data (as described in Table 1). This allowed us to further characterize the two prognostic groups in genome and epigenome.
Interestingly, we observed that the high-risk patients had a distinct copy number amplification landscape comparing to the low-risk patients, with significantly higher frequencies (Fisher’s exact test, FDR < 20%) of copy number gain at 7p22.1, 7p11.2, 7q21.2, 7q22.1, 13q22.1, 13q12.3 and 12p12.1 (Figure 3), whereas the two prognostic groups had no difference in copy number loss regions. In further integrated analysis with the gene expression data, we found that 85 genes located in the seven amplified regions displayed significant overexpression in the high-risk samples (Spearman rank correlation, FDR < 20%). Functional enrichment analysis (FDR < 10%) showed that these 85 genes were significantly enriched in the “mismatch repair pathway”, indicating that the potentially enhanced ability of mismatch repair could lead to failure of 5-FU-induced DNA damage in the high-risk patients [38]. In the PPI network (see Materials and Methods), 12.94% (11) of the 85 genes with frequent amplification in the high-risk patients had direct PPI links with at least one of the 92 5-FU metabolism-related genes collected by Tan et al. [39], which was significantly higher than the corresponding frequency of 4.05% for the rest 518 genes located in all the amplified regions in the gastric cancer tissues (Fisher’s exact test, P = 2.41E–03). As shown in Figure 4A, the 11 genes frequently amplified in high-risk patients directly interacted with nine 5-FU metabolism-related genes including ATR and CHEK1 [40] involved in cell cycle regulation, MLH1, PMS2 and EXO1 [38] involved in DNA repair, and BCL2 [41] involved in apoptosis (Supplementary Table S3). This result suggested that the high-risk patients had higher malignant degree of tumors.
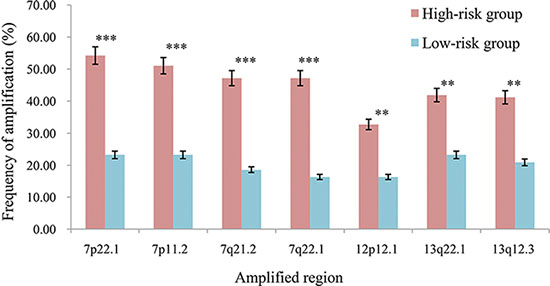
Figure 3: The frequencies of the seven amplified regions in the two prognostic groups. ***P < 0.001, **P < 0.05.
Comparison of somatic mutation profiles of high- and low-risk samples characterized 156 genes whose mutation frequencies tended to be different between the two prognostic groups (Fisher’s exact test, P < 0.05). Among them, LRP1B was mutated in 31.33% of samples in the high-risk group while its mutation frequency was 15% in the low-risk group. It has been reported that chromosomal, epigenetic and microRNA-mediated inactivation of LRP1B increases the growth and invasive capacity of tumor cells [42]. In addition to LRP1B, all other 155 genes had higher mutation frequencies in the low-risk group compared with the high-risk group, significantly more than what expected by chance (P < 1.11E–16). Functional enrichment analysis (P < 0.05) showed that these 155 mutation genes tended to be enriched in Wnt signaling, Ras signaling and Regulation of autophagy pathways, which implied that mutation-induced disturbances of these pathways might promote 5-FU efficacy for the low-risk patients [43–45]. In the PPI network, 5.13% (eight) of the 155 genes frequently mutated in the low-risk group had direct PPI links with at least one of the 92 5-FU metabolism-related genes, which was significantly higher than the corresponding frequency of 0.93% for the rest 18,759 mutated genes without significantly different mutation frequencies between the two prognostic groups (Fisher’s exact test, P = 1.36E–04). As shown in Figure 4B, the eight mutation genes directly interacted with 13 5-FU metabolism-related genes including RRM1 involved in pyrimidine metabolism [46], ATM [40], MHL1 and BCL2 involved in DNA repair, cell cycle regulation and apoptosis (Supplementary Table S4). Therefore, it is possible that these mutation-induced disturbances could facilitate 5-FU efficacy for the low-risk patients.
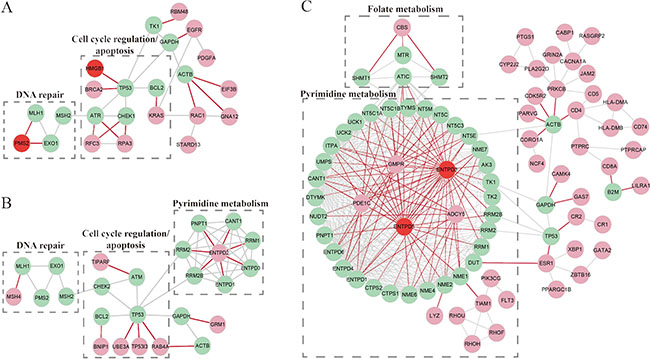
Figure 4: The PPI links between the 5-FU-metabolism-related genes and the genes with genomic or epigenomic alterations characterizing each of the prognostic groups. (A) The sub-network for the genes frequently amplified in the high-risk group. (B) The sub-network for the genes frequently mutated in the low-risk group. (C) The sub-network for the hypermethylation-mediated down-regulated genes in the high-risk group. The aquamarine nodes denote the 5-FU-metabolism-ralted genes. The pink nodes denote amplified genes (A), mutation genes (B), or hypermethylation-mediated down-regulation genes (C). The red nodes denote the 5-FU-metabolism-related genes with genomic or epigenomic alterations. The red edges denote the direct PPI links between the aquamarine nodes and the pink or red nodes.
Distinct epigenomic characteristics of prognostic groups
Using the high- and low-risk TCGA samples with DNA methylation profiles, we identified 1,480 hypermethylated genes and 1,235 hypomethylated genes in the high-risk group compared with the low-risk group (Rank Products, FDR < 20%), respectively. Among the 1,480 hypermethylated genes, 400 genes were also identified as DEGs between the high-risk group and the low-risk group, and the concordance score of hypermethylation with down-regulation was 81.75%, which was highly unlikely to occur by chance (binomial distribution test, P < 1.11E–16; see Materials and Methods). This result suggested that the down-regulation of the concordant genes could be mediated by DNA hypermethylation. These genes were significantly enriched in the “cell adhesion molecules pathway” (FDR < 10%), indicating that hypermethylation-induced suppression of this pathway might contribute to 5-FU-based chemotherapy resistance. Among the 327 hypermethylation-mediated down-regulated genes in the high-risk group, 5.81% (19) had direct PPI links with at least one of the 92 5-FU metabolism-related genes, which was significantly higher than the corresponding frequency of 1.53% for the rest 12,476 genes without concordant hypermethylation with down-regulation in the high-risk group (Fisher’s exact test, P = 1.83E–06). As shown in Figure 4C, the 19 hypermethylation-mediated down-regulated genes directly interacted with 40 5-FU metabolism-related genes including NME1 [47] and TK1/2 [48] involved in pyrimidine metabolism, MTR and SHMT1/2 [49] involved in folate metabolism (Supplementary Table S5). Folate, as a co-factor, can assist the 5-FU active metabolite flurodeoxyuridine monophosphate (FdUMP) to inhibit thymidylate synthase (TS) from DNA synthesis and repair [48]. The results implied that the hypermethylation-mediated down-regulation of genes in the high-risk patients might disturb the conversion of 5-FU to active metabolites and inhibit 5-FU-induced DNA or RNA damage.
On the other hand, the concordance score of hypomethylation with up-regulation was only 39.63%, providing no evidence of hypomethylation- mediated up-regulation of genes.
DISCUSSION
In this study, we developed a signature consisting of two gene pairs whose within-sample REOs were prognostic for gastric cancer patients treated with 5-FU-based chemotherapy. This REOs-based signature could perform robustly in independent datasets produced by different laboratories and could be easily applied at the individual levels. With this unique advantage, we were able to transform the transcriptional signature to other omics signature using the TCGA multi-omics data as a pivot. This strategy makes it feasible to explore the genomic and epigenomic characteristics of prognostic groups using the TCGA multi-omics data which would otherwise be largely unsuitable for prognostic analyses because the diverse chemo-regimens could confound the survival outcomes. Our analyses showed that the high-risk patients had frequent amplification of genes affecting DNA repair, cell cycle regulation and apoptosis, indicating that they had high malignant degree of tumors. Meanwhile, the hypermethylation-mediated down-regulation of genes in the high-risk group mainly affected pyrimidine and folate metabolism, which might decrease the conversion of 5-FU to active metabolites and inhibit 5-FU-induced DNA or RNA damage. In contrast, the low-risk patients were characterized with frequent mutation of genes enriched in Wnt signaling, Ras signaling and Regulation of autophagy pathways, implying that these mutation-induced disturbances might facilitate 5-FU efficacy.
We need to clarify that we should not simply conclude that the high-risk patients identified by the prognostic signature are all resistant to 5-FU-based chemotherapy. Some of the high-risk patients’ tumor could be indeed resistant to 5-FU-induced DNA or RNA damage [48], while some others might be sensitive to 5-FU but their tumor cell growth ability outperforms the drug efficacy [50]. Despite this problem, such a prognostic signature can still provide valuable information for clinical recommendation of adjuvant chemotherapy. Because all the high-risk patients should have high malignant degree of tumors and the routine clinical chemotherapy might be unable to improve their clinical outcomes, other therapy regimens or a larger dosage of chemotherapy could be recommended to these patients [51]. In contrast, the low-risk patients identified by the signature should include both patients with high malignant degree of tumors who, however, can benefit from chemotherapy and patients with low malignant degree of tumors who could be at low risk without the help of chemotherapy. We could recommend 5-FU-based chemotherapy to these patients. Especially, for the advanced patients with distant metastasis, because the improved survival of the low-risk patients must be attributed to 5-FU-based chemotherapy, the signature could identify the patients who can benefit from 5-FU-based chemotherapy. To recognize the patients who are sensitive or resistant to 5-FU, we need gene expression profiles of patients with explicit information of response, which, however, are currently scarce in public databases. Also, future work is needed to study whether it is possible to design novel drugs targeting the genomic or epigenomic lesions characterizing the patients who cannot benefit from 5-FU-based chemotherapy.
In summary, the discovery that the REOs-based signature could robustly predict prognoses of 5-FU-treated gastric cancer patients will provide a translational biomarker in further stratifying the gastric cancer patients for 5-FU response. The multi-omics characteristics of the high-risk patients would expand our understanding of the mechanisms underlying 5-FU resistance in gastric cancer and provide novel therapeutic targets to overcome 5-FU resistance of gastric patients in the future.
MATERIALS AND METHODS
Data and pre-processing
Data for gastric cancer cell lines and tissues were downloaded from the Gene Expression Omnibus (GEO, http://www.ncbi.nlm.nih.gov/geo/) and TCGA (http://cancergenome.nih.gov/), as described in details in Table 1. The raw data (.CEL files) of microarray platforms were processed using the Robust Multichip Average algorithm [52]. Probe IDs were mapped to gene IDs using the corresponding platform files. If multiple probes were mapped to the same gene, the expression value for the gene was summarized as the arithmetic mean of the values of the multiple probes. The mRNA-seq profiles of level 3 for TCGA samples were downloaded from TCGA portal. We removed genes whose expression measurements were at or below a noise threshold of 0.2 reads per kilobase per million mapped reads (RPKM) in at least 75% of samples [29].
Copy number data of level 4 for TCGA samples analyzed by the GISTIC 2.0 algorithm [53] were downloaded from Firehose (https://confluence.broadinstitute.org/display/GDAC/Download). Using the significant regions of gain or loss identified by GISTIC 2.0, we assigned a discrete copy number alteration status to each gene in each sample. Gene mutation data of level 2 and DNA methylation data of level 3 for TCGA samples were downloaded from TCGA portal. For gene mutation data, only the non-synonymous mutations were included in our analysis. By integrating mutation data produced by different platforms, we generated a discrete mutation profile including 18,916 genes. DNA methylation profiles of level 3 provided beta-value for each CpG site in each sample. We focused on the 25,978 CpG sites located at the promoter regions of genes, which were measured by Illumina Infinium Human DNA methylation 450 and 27 platforms. Probes that had any “NA”-masked data points and that were designed for sequences on X and Y chromosomes were removed [29]. Probe IDs were mapped to gene IDs using the corresponding platform file. If multiple probes were mapped to the same gene, the beta-value for this gene was summarized as the arithmetic mean of the values of the multiple probes. Totally, 21,993 CpG sites mapped to 12,803 genes were analyzed in this study.
The human protein-protein interaction (PPI) data including 142,583 distinct interactions and 13,693 human proteins were collected as previously described [54]. The types of interaction relationships between proteins included physical interaction, transcriptional regulation and sequential catalysis.
Correlation and survival analysis
The Pearson correlation analysis was used to evaluate the correlation of genes expression levels with GI50 values of cell lines. The univariate Cox regression model was used to evaluate the correlation of gene expression levels and REOs of gene pairs with OS, and the multivariate Cox regression model was used to evaluate the independent prognostic value of the signature after adjusting for clinical factors including stage, grade and gender. Survival curves were estimated by the Kaplan-Meier method and compared with log-rank test.
Development of the prognostic signature
Let Ea and Eb represent the expression levels of two candidate genes, a and b, respectively, we classified cancer samples into two groups according to the within-sample REO (Ea > Eb or Ea < Eb) of this gene pair. If the two groups of samples had significantly different OS, then we defined this gene pair as a prognosis-associated gene pair. If the Ea > Eb REO was associated with poor OS, then this REO voted for high risk; otherwise, low risk. All the prognosis-associated gene pairs were selected as prognostic signature. Finally, a sample was predicted to be of high risk if the REOs of all gene pairs of the signature in this sample voted for high risk; otherwise, low risk.
Concordance scores
If two lists of DEGs detected separately from two datasets had k overlapped genes, among which s genes showed the same deregulation directions (up- or down-regulation) in the two DEGs lists, then the concordance score was calculated as s/k. This score was used to evaluate the consistence of DEGs extracted from independent datasets.
If k genes were found to be correlated with both 5-FU GI50 of cell lines and patients’ OS, among which s genes had the same signs positively (or negatively) correlated with 5-FU GI50 of cell lines and correspondingly negatively (or positively) correlated with patients’ OS, then the concordance score was calculated as s/k. This score was used to evaluate the clinical relevance of the GI50-related genes.
If k genes had both methylation and expression changes, among which s genes were hypermethylated (or hypomethylated) and correspondingly down-regulated (or up-regulated), then the concordance score was calculated as s/k. This score was used to evaluate the concordance of hypermethylation (or hypomethylation) with down-regulation (or up-regulation).
The probability of observing a concordance score of s/k by chance was evaluated by the cumulative binomial distribution model as following:
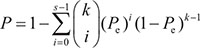
where Pe is the probability of one gene having the concordant relationship between the two lists of genes by chance (here, Pe = 0.5).
Analysis of genomic and epigenomic data
The Student’s t-test was used to select DEGs between two groups of samples. The Rank Products algorithm [55], which is insensitive to batch effects, was used to select DEGs and differential DNA methylation genes (DMGs) between two groups of TCGA samples derived from multiple experimental batches.
Fisher’s exact test was conducted to extract genes which had significantly different frequencies of copy number alterations and mutation between two groups of TCGA samples. Spearman rank correlation analysis was used to evaluate the correlation between copy number alterations and expression changes after removing the batch effects by ComBat for TCGA samples [56].
Functional enrichment analysis
Functional enrichment analyses were performed based on KEGG (the Kyoto Encyclopedia of Genes and Genomes) [57]. The hypergeometric distribution model was used to calculate the significance of biological pathways enriched with genes of interest [58]. The Benjamini-Hochberg method was adopted to estimate the false discovery rate (FDR). All statistical analyses were performed using the R software package version 3.0.1.
The flowchart of the analysis procedure
Figure 1 describes the development, validation and application of the 5-FU-relevant prognostic signature.
ACKNOWLEDGMENTS
The authors thank Dr. Ju-Seog Lee of Department of Pathology at The University of Texas MD Anderson Cancer Center for providing clinical data of GSE15459. They also thank Dr. Jeffrey E. Green from Laboratory of Cancer Biology and Genetics, National Cancer Institute, Bethesda, for providing clinical data of GSE14208.
Abbreviations
5-Fluorouracil, 5-FU; REOs, Relative Expression Orderings; OS, Overall survival; FDR, False Discovery Rate; HR, Hazard Ratios; CI, Confidence Intervals; PPI, Protein-Protein Interaction
GRANT SUPPORT
This work was supported in part by Natural Science Foundation of China (Grant Nos. 81372213, 81501215, 81501829 and 81572935) and Medical Elite Cultivation Program of Fujian, P.R.C (2013-ZQN-ZD-24).
CONFLICTS OF INTEREST
No potential conflicts of interest were disclosed.
REFERENCES
1. Ajani JA, Rodriguez W, Bodoky G, Moiseyenko V, Lichinitser M, Gorbunova V, Vynnychenko I, Garin A, Lang I, Falcon S. Multicenter phase III comparison of cisplatin/S-1 with cisplatin/infusional fluorouracil in advanced gastric or gastroesophageal adenocarcinoma study: the FLAGS trial. J Clin Oncol. 2010; 28:1547–1553.
2. Ajani JA, Bentrem DJ, Besh S, D’Amico TA, Das P, Denlinger C, Fakih MG, Fuchs CS, Gerdes H, Glasgow RE, Hayman JA, Hofstetter WL, Ilson DH, et al. Gastric cancer, version 2.2013: featured updates to the NCCN Guidelines. J Natl Compr Canc Netw. 2013; 11:531–546.
3. Becker K, Langer R, Reim D, Novotny A, Meyer zum Buschenfelde C, Engel J, Friess H, Hofler H. Significance of histopathological tumor regression after neoadjuvant chemotherapy in gastric adenocarcinomas: a summary of 480 cases. Ann Surg. 2011; 253:934–939.
4. Chen L, Li G, Li J, Fan C, Xu J, Wu B, Liu K, Zhang C. Correlation between expressions of ERCC1/TS mRNA and effects of gastric cancer to chemotherapy in the short term. Cancer Chemother Pharmacol. 2013; 71:921–928.
5. Metzger R, Leichman CG, Danenberg KD, Danenberg PV, Lenz HJ, Hayashi K, Groshen S, Salonga D, Cohen H, Laine L, Crookes P, Silberman H, Baranda J, et al. ERCC1 mRNA levels complement thymidylate synthase mRNA levels in predicting response and survival for gastric cancer patients receiving combination cisplatin and fluorouracil chemotherapy. J Clin Oncol. 1998; 16:309–316.
6. Napieralski R, Ott K, Kremer M, Specht K, Vogelsang H, Becker K, Muller M, Lordick F, Fink U, Rudiger Siewert J, Hofler H, Keller G. Combined GADD45A and thymidine phosphorylase expression levels predict response and survival of neoadjuvant-treated gastric cancer patients. Clin Cancer Res. 2005; 11:3025–3031.
7. Choi J, Lim H, Nam DK, Kim HS, Cho DY, Yi JW, Kim HC, Cho YK, Kim MW, Joo HJ, Lee KB, Kim KB. Expression of thymidylate synthase in gastric cancer patients treated with 5-fluorouracil and doxorubicin-based adjuvant chemotherapy after curative resection. Br J Cancer. 2001; 84:186–192.
8. Fareed KR, Kaye P, Soomro IN, Ilyas M, Martin S, Parsons SL, Madhusudan S. Biomarkers of response to therapy in oesophago-gastric cancer. Gut. 2009; 58:127–143.
9. Kim HK, Green JE. Predictive biomarker candidates for the response of gastric cancer to targeted and cytotoxic agents. Pharmacogenomics. 2014; 15:375–384.
10. Shen J, Wei J, Wang H, Yue G, Yu L, Yang Y, Xie L, Zou Z, Qian X, Ding Y, Guan W, Liu B. A three-gene signature as potential predictive biomarker for irinotecan sensitivity in gastric cancer. J Transl Med. 2013; 11:73.
11. Kim HK, Choi IJ, Kim CG, Kim HS, Oshima A, Yamada Y, Arao T, Nishio K, Michalowski A, Green JE. Three-gene predictor of clinical outcome for gastric cancer patients treated with chemotherapy. Pharmacogenomics J. 2012; 12:119–127.
12. Leek JT, Scharpf RB, Bravo HC, Simcha D, Langmead B, Johnson WE, Geman D, Baggerly K, Irizarry RA. Tackling the widespread and critical impact of batch effects in high-throughput data. Nat Rev Genet. 2010; 11:733–739.
13. Lazar C, Meganck S, Taminau J, Steenhoff D, Coletta A, Molter C, Weiss-Solis DY, Duque R, Bersini H, Nowe A. Batch effect removal methods for microarray gene expression data integration: a survey. Brief Bioinform. 2013; 14:469–490.
14. Qi L, Chen L, Li Y, Qin Y, Pan R, Zhao W, Gu Y, Wang H, Wang R, Chen X, Guo Z. Critical limitations of prognostic signatures based on risk scores summarized from gene expression levels: a case study for resected stage I non-small-cell lung cancer. Brief Bioinform. 2015. pii: bbv064.
15. Geman D, d’Avignon C, Naiman DQ, Winslow RL. Classifying gene expression profiles from pairwise mRNA comparisons. Stat Appl Genet Mol Biol. 2004; 3:Article19.
16. Wang H, Sun Q, Zhao W, Qi L, Gu Y, Li P, Zhang M, Li Y, Liu SL, Guo Z. Individual-level analysis of differential expression of genes and pathways for personalized medicine. Bioinformatics. 2015; 31:62–68.
17. Kim HK, Choi IJ, Kim CG, Kim HS, Oshima A, Michalowski A, Green JE. A gene expression signature of acquired chemoresistance to cisplatin and fluorouracil combination chemotherapy in gastric cancer patients. PLoS One. 2011; 6:e16694.
18. Xu L, Tan AC, Winslow RL, Geman D. Merging microarray data from separate breast cancer studies provides a robust prognostic test. BMC Bioinformatics. 2008; 9:125.
19. Beelen K, Zwart W, Linn SC. Can predictive biomarkers in breast cancer guide adjuvant endocrine therapy? Nat Rev Clin Oncol. 2012; 9:529-541.
20. Tan SH, Lee SC. Clinical implications of chemotherapy-induced tumor gene expression in human breast cancers. Expert Opin Drug Metab Toxicol. 2010; 6:283–306.
21. Munkacsy G, Abdul-Ghani R, Mihaly Z, Tegze B, Tchernitsa O, Surowiak P, Schafer R, Gyorffy B. PSMB7 is associated with anthracycline resistance and is a prognostic biomarker in breast cancer. Br J Cancer. 2010; 102:361–368.
22. Allen WL, Turkington RC, Stevenson L, Carson G, Coyle VM, Hector S, Dunne P, Van Schaeybroeck S, Longley DB, Johnston PG. Pharmacogenomic profiling and pathway analyses identify MAPK-dependent migration as an acute response to SN38 in p53 null and p53-mutant colorectal cancer cells. Mol Cancer Ther. 2012; 11:1724–1734.
23. Al-Lazikani B, Banerji U, Workman P. Combinatorial drug therapy for cancer in the post-genomic era. Nat Biotechnol. 2012; 30:679–692.
24. Lee JK, Havaleshko DM, Cho H, Weinstein JN, Kaldjian EP, Karpovich J, Grimshaw A, Theodorescu D. A strategy for predicting the chemosensitivity of human cancers and its application to drug discovery. Proc Natl Acad Sci USA. 2007; 104:13086–13091.
25. Garnett MJ, Edelman EJ, Heidorn SJ, Greenman CD, Dastur A, Lau KW, Greninger P, Thompson IR, Luo X, Soares J, Liu Q, Iorio F, Surdez D, et al. Systematic identification of genomic markers of drug sensitivity in cancer cells. Nature. 2012; 483:570–575.
26. Geeleher P, Cox NJ, Huang RS. Clinical drug response can be predicted using baseline gene expression levels and in vitro drug sensitivity in cell lines. Genome Biol. 2014; 15:R47.
27. Gillet JP, Varma S, Gottesman MM. The clinical relevance of cancer cell lines. J Natl Cancer Inst. 2013; 105:452–458.
28. Tong M, Zheng W, Lu X, Ao L, Li X, Guan Q, Cai H, Li M, Yan H, Guo Y, Chi P, Guo Z. Identifying clinically relevant drug resistance genes in drug-induced resistant cancer cell lines and post-chemotherapy tissues. Oncotarget. 2015; 6:41216–41227. doi: 10.18632/oncotarget.5649.
29. Cancer Genome Atlas Research N. Comprehensive molecular characterization of gastric adenocarcinoma. Nature. 2014; 513:202–209.
30. Hsu FH, Serpedin E, Hsiao TH, Bishop AJ, Dougherty ER, Chen Y. Reducing confounding and suppression effects in TCGA data: an integrated analysis of chemotherapy response in ovarian cancer. BMC Genomics. 2012; 13:S13.
31. Tan IB, Ivanova T, Lim KH, Ong CW, Deng N, Lee J, Tan SH, Wu J, Lee MH, Ooi CH, Rha SY, Wong WK, Boussioutas A, et al. Intrinsic subtypes of gastric cancer, based on gene expression pattern, predict survival and respond differently to chemotherapy. Gastroenterology. 2011; 141:476-485, 485 e471–411.
32. Lei Z, Tan IB, Das K, Deng N, Zouridis H, Pattison S, Chua C, Feng Z, Guan YK, Ooi CH, Ivanova T, Zhang S, Lee M, et al. Identification of molecular subtypes of gastric cancer with different responses to PI3-kinase inhibitors and 5-fluorouracil. Gastroenterology. 2013; 145:554–565.
33. Kondratskyi A, Kondratska K, Skryma R, Prevarskaya N. Ion channels in the regulation of apoptosis. Biochim Biophys Acta. 2014.
34. Faye A, Poyet JL. Targeting AAC-11 in cancer therapy. Expert Opin Ther Targets. 2010; 14:57–65.
35. Robert M. Mader MM, Gunther G. Steger. Resistance to 5-Fluorouracil. ELSEVIER. 1998; 31:661–666.
36. Ohtsu A, Shimada Y, Shirao K, Boku N, Hyodo I, Saito H, Yamamichi N, Miyata Y, Ikeda N, Yamamoto S, Fukuda H, Yoshida S, Japan Clinical Oncology Group S. Randomized phase III trial of fluorouracil alone versus fluorouracil plus cisplatin versus uracil and tegafur plus mitomycin in patients with unresectable, advanced gastric cancer: The Japan Clinical Oncology Group Study (JCOG9205). J Clin Oncol. 2003; 21:54–59.
37. Kim NK, Park YS, Heo DS, Suh C, Kim SY, Park KC, Kang YK, Shin DB, Kim HT, Kim HJ, et al. A phase III randomized study of 5-fluorouracil and cisplatin versus 5-fluorouracil, doxorubicin, and mitomycin C versus 5-fluorouracil alone in the treatment of advanced gastric cancer. Cancer. 1993; 71:3813–3818.
38. Helleday T, Petermann E, Lundin C, Hodgson B, Sharma RA. DNA repair pathways as targets for cancer therapy. Nat Rev Cancer. 2008; 8:193–204.
39. Tan WL, Bhattacharya B, Loh M, Balasubramanian I, Akram M, Dong D, Wong L, Thakkar B, Salto-Tellez M, Soo RA, Fichtner I, Iacopetta B, et al. Low cytosine triphosphate synthase 2 expression renders resistance to 5-fluorouracil in colorectal cancer. Cancer Biol Ther. 2011; 11:599–608.
40. Zhou BB, Bartek J. Targeting the checkpoint kinases: chemosensitization versus chemoprotection. Nat Rev Cancer. 2004; 4:216–225.
41. Holohan C, Van Schaeybroeck S, Longley DB, Johnston PG. Cancer drug resistance: an evolving paradigm. Nat Rev Cancer. 2013; 13:714–726.
42. Prazeres H, Torres J, Rodrigues F, Pinto M, Pastoriza MC, Gomes D, Cameselle-Teijeiro J, Vidal A, Martins TC, Sobrinho-Simoes M, Soares P. Chromosomal, epigenetic and microRNA-mediated inactivation of LRP1B, a modulator of the extracellular environment of thyroid cancer cells. Oncogene. 2011; 30:1302–1317.
43. Anastas JN, Moon RT. WNT signalling pathways as therapeutic targets in cancer. Nat Rev Cancer. 2013; 13:11–26.
44. Klampfer L, Swaby LA, Huang J, Sasazuki T, Shirasawa S, Augenlicht L. Oncogenic Ras increases sensitivity of colon cancer cells to 5-FU-induced apoptosis. Oncogene. 2005; 24:3932–3941.
45. Sui X, Chen R, Wang Z, Huang Z, Kong N, Zhang M, Han W, Lou F, Yang J, Zhang Q, Wang X, He C, Pan H. Autophagy and chemotherapy resistance: a promising therapeutic target for cancer treatment. Cell Death Dis. 2013; 4:e838.
46. Nobili S, Napoli C, Landini I, Morganti M, Cianchi F, Valanzano R, Tonelli F, Cortesini C, Mazzei T, Mini E. Identification of potential pharmacogenomic markers of clinical efficacy of 5-fluorouracil in colorectal cancer. Int J Cancer. 2011; 128:1935–1945.
47. Gmeiner WH, Reinhold WC, Pommier Y. Genome-wide mRNA and microRNA profiling of the NCI 60 cell-line screen and comparison of FdUMP [10] with fluorouracil, floxuridine, and topoisomerase 1 poisons. Mol Cancer Ther. 2010; 9:3105–3114.
48. Longley DB, Harkin DP, Johnston PG. 5-fluorouracil: mechanisms of action and clinical strategies. Nat Rev Cancer. 2003; 3:330–338.
49. Jennings BA, Willis G. How folate metabolism affects colorectal cancer development and treatment; a story of heterogeneity and pleiotropy. Cancer Lett. 2015; 356:224–230.
50. Drewinko B, Patchen M, Yang LY, Barlogie B. Differential killing efficacy of twenty antitumor drugs on proliferating and nonproliferating human tumor cells. Cancer Res. 1981; 41:2328–2333.
51. van Kuilenburg AB, Maring JG. Evaluation of 5-fluorouracil pharmacokinetic models and therapeutic drug monitoring in cancer patients. Pharmacogenomics. 2013; 14:799–811.
52. Irizarry RA, Hobbs B, Collin F, Beazer-Barclay YD, Antonellis KJ, Scherf U, Speed TP. Exploration, normalization, and summaries of high density oligonucleotide array probe level data. Biostatistics. 2003; 4:249–264.
53. Mermel CH, Schumacher SE, Hill B, Meyerson ML, Beroukhim R, Getz G. GISTIC2.0 facilitates sensitive and confident localization of the targets of focal somatic copy-number alteration in human cancers. Genome Biol. 2011; 12:R41.
54. Shen X, Li S, Zhang L, Li H, Hong G, Zhou X, Zheng T, Zhang W, Hao C, Shi T, Liu C, Guo Z. An integrated approach to uncover driver genes in breast cancer methylation genomes. PLoS One. 2013; 8:e61214.
55. Breitling R, Armengaud P, Amtmann A, Herzyk P. Rank products: a simple, yet powerful, new method to detect differentially regulated genes in replicated microarray experiments. FEBS Lett. 2004; 573:83–92.
56. Johnson WE, Li C, Rabinovic A. Adjusting batch effects in microarray expression data using empirical Bayes methods. Biostatistics. 2007; 8:118–127.
57. Kanehisa M, Goto S. KEGG: kyoto encyclopedia of genes and genomes. Nucleic Acids Res. 2000; 28:27–30.
58. Hong G, Zhang W, Li H, Shen X, Guo Z. Separate enrichment analysis of pathways for up- and downregulated genes. J R Soc Interface. 2014; 11:20130950.