
INTRODUCTION
Melanoma is the most deadly form of skin cancer. Although immunotherapies and selective inhibitors of the BRAF/MEK/ERK pathway have improved outcomes for patients with advanced melanoma, the majority of melanomas either are intrinsically resistant or develop resistance after initial response [1–3]. This provides a strong rationale for combination therapies [2, 4]. To improve the current understanding of melanoma cell response to therapies, diverse studies have been initiated to analyze the genetic landscape determining an effective clinical response [2, 5, 6]. Novel therapies are in development and MITF is listed among attractive therapeutic oncotargets [3, 7]. MITF-M is a melanocyte-specific master regulator that has a critical role in the pathogenesis of melanoma and hyperpigmented disorders [8–12]. MITF-M regulation is complex and the exact mechanisms that determine MITF expression and activity remain incompletely understood [12–14]. MITF’s contribution to phenotypic heterogeneity and plasticity of melanoma is considered as an important part of reduced sensitivity to the BRAF/MEK/ERK pathway inhibition [2, 7, 15].
Parthenolide (PN), a sesquiterpene lactone isolated from the herbal medicine feverfew (Tanacetum parthenium) inhibits proliferation and induces cell death in various cancers [16], remaining normal cells unaffected [17, 18]. Interestingly, PN shows activity against cancer stem-like cells [16, 18–21], and acts as a chemopreventive agent in a UVB-induced skin cancer model [22]. The major activity of PN is to inactivate specific proteins by forming a covalent bond between α-methylene-γ-lactone moiety of PN and sulfhydryl groups within proteins [23], and to increase intracellular concentrations of reactive oxygen species (ROS) [17, 24]. PN was first identified as nuclear factor κB (NF-κB) inhibitor [23] that can directly inhibit the p65 subunit [25], and it is still used as NF-κB inhibitor in a variety of studies [26, 27]. PN can also interfere with AP-1 [28] and STAT signaling [29] and induces activation of c-Jun N-terminal kinase (JNK) [30]. PN enhances p53 activity by promoting the ubiquitination of mouse double minute 2 homolog (MDM2) [31] and depletes histone deacetylase 1 (HDAC1) protein [32]. We and others have already shown diverse activities of PN in melanoma cells. In melanoma cell lines, A375, 1205Lu and WM793, PN inhibits proliferation and adhesion, induces cell cycle arrest, apoptosis and reduces constitutive and induced NF-κB activity [33, 34]. In SK-MEL-28 cells, PN rapidly induces ROS, and activates extracellular signal-regulated kinase 1/2 (ERK1/2) and NADPH oxidase [35]. In patient-derived melanospheres, it reduces the frequency of ATP-binding cassette, sub-family B, member 5 (ABCB5)-positive cells and clonogenic capacity [19]. The influence of PN on MITF-M has not been yet studied.
MITF-M expression in melanocytes and melanoma cells was shown to be suppressed by multiple inhibitors of HDAC1 [36]. As PN can inhibit HDAC1 in breast and colon carcinoma cells [32], we hypothesized that MITF-M level might be also diminished by PN in melanoma cells. However, it was also possible that PN could elevate the MITF level because it is an inhibitor of NF-κB and the gene expression reciprocity between NF-κB and MITF was reported in melanoma cell lines as modulating intrinsic sensitivity of melanomas to inhibitors of the BRAF/MEK/ERK pathway [37]. Therefore, we sought to clarify the influence of PN on MITF in NF-κBlow and NF-κBhigh populations. To limit off-target effects, we did not modify cells genetically but instead we have chosen patient-derived melanoma populations with originally distinct molecular characteristics: (i) BRAFWT, MITF-Mhigh/NF-κBlow, (ii) BRAFV600E, MITF-Mhigh/NF-κBhigh, (iii) BRAFV600E, MITF-Mlow/NF-κBhigh.
RESULTS
Patient-derived melanoma populations exert different doubling rate and basal expression of MITF/MITF-M and MITF-dependent genes
Four patient-derived melanoma populations were grown in stem cell medium (SCM) as we have previously shown that this medium better preserves the parent tumor characteristics than serum-containing medium [38, 39, 40]. Three of them, DMBC11, DMBC12 and DMBC21 harbored mutation in BRAF (BRAFV600E), the most highly recurrent genetic aberration in melanoma [41] (Figure 1A). DMBC17 and DMBC21 were slow-cycling populations and their doubling time was above 60 hours, whereas doubling time of DMBC11 and DMBC12 populations was about 20-24 hours (Figure 1B).
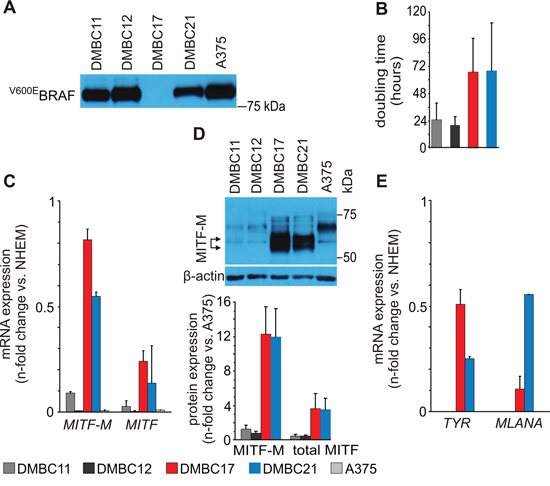
Figure 1: Molecular characteristics of patient-derived melanoma populations used in the study. A. Western blot analysis of BRAF mutation status in patient-derived melanoma cell populations (DMBCs). An antibody recognizing BRAFV600E but not wild type BRAF was employed. A375, a melanoma cell line harboring BRAFV600E mutation was used as a positive control. B. Doubling time of melanoma cell populations assessed as metabolic activity of acid phosphatase. (n = 3) C. qRT-PCR analysis comparing basal levels of MITF-M and MITF. D. Western blot analysis comparing basal levels of MITF. A doublet of M isoform is indicated by arrows (top). MITF (total) and MITF-M protein levels were quantified relatively to their levels in A375 cells (bottom) (n = 3). E. qRT-PCR analysis comparing basal transcript levels of tyrosinase (TYR) and MLANA. Relative mRNA quantity of MITF and MITF-M (panel C), TYR and MLANA (panel E) is represented after normalization to RPS17 and the level in melanocytes (NHEM). As in DMBC11 and DMBC12 cells the expression of TYR and MLANA was several hundred fold lower than in NHEM, it is displayed as zero. DMBC, patient-derived melanoma populations obtained in Department of Molecular Biology of Cancer.
MITF-M transcript was present in slow-cycling populations DMBC17 and DMBC21 at the level similar to that in melanocytes (NHEM), whereas MITF-M expression in DMBC11 and DMBC12 populations showing a high proliferation rate was very low as in A375 cells (Figure 1C). The most substantial difference between tested populations was observed in the basal level of MITF-M protein, which migrates as a doublet and it has lower molecular weight than other non-melanocyte-specific isoforms (Figure 1D). Concerning MITF-M activity, MITF-M-dependent pigmentation-related genes, TYR and MLANA, were expressed in DMBC17 and DMBC21 populations at similar levels as in melanocytes (NHEM) (Figure 1E). This indicates that DMBC17 and DMBC21 cell populations were highly heterogeneous and besides cycling cells they contained a large fraction of differentiated melanoma cells, which is further confirmed in Figure 2A. In DMBC11 and DMBC12 cells the expression of these genes was several hundred fold lower than in NHEM (Figure 1E). Thus, we had four melanoma patient-derived populations with different characteristics: (1) DMBC17: BRAFWT, MITF-Mhigh, slow-cycling, highly differentiated, (2) DMBC21: BRAFV600E, MITF-Mhigh, slow-cycling, highly differentiated and (3,4) DMBC11 and DMBC12: BRAFV600E, MITF-Mlow, fast-cycling, less differentiated.
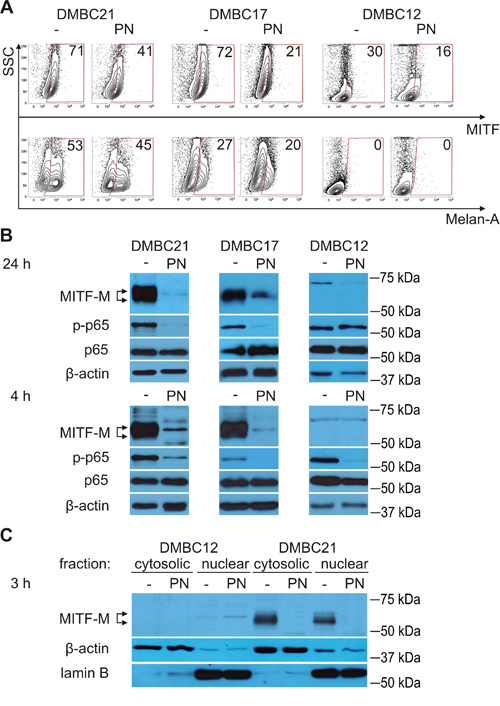
Figure 2: PN reduces percentages of MITF-positive cells and diminishes levels of MITF-M protein and phosphorylated p65/NF-κB. A. Percentages of MITF (total)-positive and Melan-A-positive cells after treatment with 20 μM PN for 4 hours were assessed by flow cytometry. The numbers are representative percentages of MITF- or Melan-A-positive cells. B. Melanoma cells were treated with 10 μM PN for 24 hours or with 20 μM PN for 4 hours, and changes in the levels of MITF-M and phosphorylated p65 (p-p65) in whole-cell lysates were determined by Western blotting. C. MITF-M levels in cytosolic and nuclear fractions were analyzed by Western blotting after 3 hours of incubation with 20 μM PN. Equal loading was confirmed by β-actin (whole-cell lysates and cytosolic fraction) and lamin B (nuclear fraction). Representative results are shown.
PN reduces the percentage of melanoma cells expressing MITF at high level
First, the influence of PN on the percentage of MITF (total)-positive cells was assessed using flow cytometry. At this stage of the study it was not clear whether PN would increase or reduce the percentage of MITFhigh melanoma cells. After 20 hours, PN at 10 μM and 20 μM markedly reduced the percentage of cells expressing MITF at high level (not shown). More interestingly, this diminution was already visible after 4 hours (Figure 2A). Changes in the percentages of Melan-A-positive cells induced by PN were much lower (Figure 2A). Since MITF was substantially reduced by PN treatment, results for only one of MITF-Mlow populations (DMBC12) were included.
PN decreases MITF-M protein level in the nucleus and cytoplasm of melanoma cells
As the MITF antibody used in the flow cytometry detects all isoforms of MITF, the influence of PN on MITF-M isoform was subsequently assessed using Western blotting. MITF-M, a protein with a molecular weight between 50 and 65 kDa depending on its posttranslational modifications [12], was almost completely depleted by 20 μM PN in MITF-Mhigh populations after 24 hours, and similar effects were induced already after 4 hours (Figure 2B). PN eradicated MITF-M protein both in nucleus and cytoplasm as shown for MITF-Mhigh DMBC21 population (Figure 2C). We also noted that the inverse correlation between the level of MITF-M and phosphorylated p65 (NF-κB subunit) is not always true as we had DMBC21 cells that were MITF-Mhigh/NF-κBhigh. Moreover, PN simultaneously reduced the level of both MITF-M and phosphorylated p65 (Figure 2B).
PN-induced MITF-M depletion is proteasome-, lysosome- and caspase-independent
The minimal time necessary for a substantial reduction of MITF-M protein level was determined (Figure 3A). MITF-M was rapidly reduced by 20 μM PN and already after 30 minutes first signs of protein depletion were detected, and after 4 hours almost no MITF-M was left. The phosphorylated p65 was completely eradicated already after 30 minutes further supporting the notion that MITF-M level does not inversely depend on NF-κB signaling (Figure 3A). Several mechanisms might be considered as responsible for MITF-M depletion. First, we investigated whether PN could induce ERK1/2 activity, which might contribute to the proteosomal degradation of MITF-M [42, 43]. When the membrane showing time-dependent depletion of MITF-M in DMBC21 cells was immunoblotted for phosphorylated ERK1/2, the activity of ERK1 and ERK2 was increased by PN also in a time-dependent manner (Figure 3A). When levels of phosphorylated ERK1/2 were assessed in untreated melanoma cells, it appeared that melanoma cell populations differed in basal levels of active ERK1/2 (Figure 3B), and ERK1/2high populations, DMBC12 and DMBC17 expressed MITF-M at either very low or high levels, respectively. Therefore, it was rather unlikely that ERK1/2 activity was responsible for MITF-M level. To further confirm this conclusion, the activation of ERK1/2 was blocked by GSK1120212 (trametinib, TRA), an inhibitor of MEK. As expected, TRA at 0.5 μM used alone completely inhibited phosphorylation of ERK1/2 but did not affect MITF-M level (Figure 3C). In combination with PN, TRA did not prevent PN from action, and a full eradication of MITF-M was observed in MITF-Mhigh populations, DMBC17 and DMBC21 (Figure 3C). MITF-M depletion was observed even when ERK1/2 activity was first blocked with TRA and then PN was added. This clearly indicates that ERK1/2 was not involved in PN-induced MITF-M depletion.
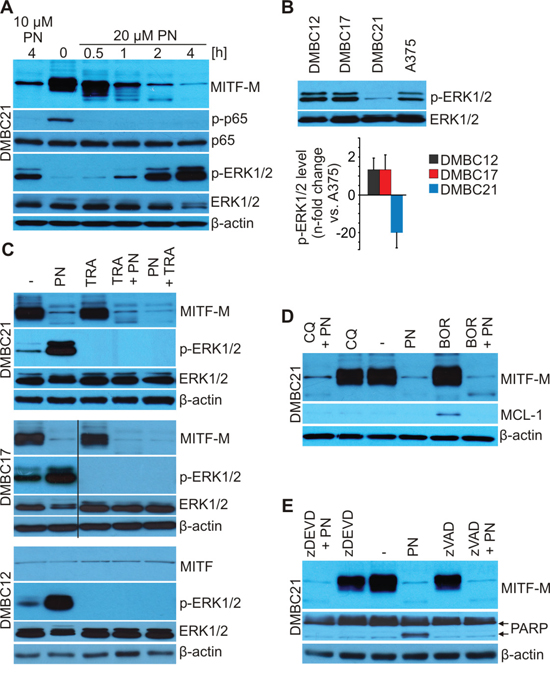
Figure 3: PN does not induce lysosomal, proteasomal and caspase-dependent degradation of MITF-M as shown by immunoblotting. A. DMBC21 cells were treated with 10 and 20 μM PN for the indicated time and the levels of MITF-M, phosphorylated p65 (p-p65), p65, phosphorylated ERK1/2 (p-ERK1/2) and total ERK1/2 were assessed. B. Basal levels of p-ERK1/2 in DMBC cell populations shown by immunoblotting were quantified relatively to the level in A375 cells (n = 3). C. Cells were exposed to 20 μM PN and 0.5 μM trametinib (TRA) alone or in combination for 4 hours with 2 hours preincubation with either drug and protein levels were determined by Western blotting. D. and E. Cells were preincubated with bortezomib (0.1 μM BOR; 10 min), chloroquine (50 μM CQ; 10 min) or caspase inhibitors (50 μM zDEVD or 50 μM zVAD; 30 min) and 20 μM PN was added for additional 4 hours. MCL-1 was used as a control of BOR-triggered inhibition of proteasomal turnover, PARP as a control of caspase inhibition. Equal loading was confirmed by β-actin or ERK1/2. Representative results are shown.
MITF-M proteasomal degradation can be triggered by ERK1/2- [42] but also by glycogen synthase kinase 3 (GSK3)-dependent MITF-M phosphorylation [44]. To investigate contribution of proteasomal degradation to PN-induced MITF-M depletion, 0.1 μM bortezomib (BOR) was used but it did not prevent PN-induced downregulation of MITF-M (Figure 3D). To rule out the possibility that the lysosomal pathway is involved in the PN-induced loss of MITF-M, chloroquine (CQ), a lysosomal inhibitor was used. Chloroquine did not affect MITF-M level and did not interfere with PN-induced MITF-M depletion. As cleavage of MITF-M by caspases has been shown and interestingly, it generates fragment of MITF-M endowed with a proapoptotic activity [45], we sought to investigate whether caspases were responsible for PN-stimulated MITF-M degradation. Pretreatment with a pan-caspase inhibitor Z-VAD-fmk or caspase-3 inhibitor Z-DEVD-fmk did not affect PN-induced depletion of MITF-M (Figure 3E).
PN reduces MITF-M transcript and HDAC1 protein level
As we excluded PN-induced degradation of MITF-M protein along any of known pathways, we next analyzed PN influence on MITF transcript level. qRT-PCR revealed that 20 μM PN substantially reduced mRNA levels of MITF and its M isoform in MITF-Mhigh populations DMBC21 (Figure 4A) and DMBC17 (not shown), whereas these transcripts expressed at low levels already in untreated DMBC12 cells (Figure 1C), remained unaffected by PN treatment (Figure 4A). Of note, the post-PN transcript level of MITF-M in DMBC21 population was still 3-fold higher than in DMBC12 population (not shown).
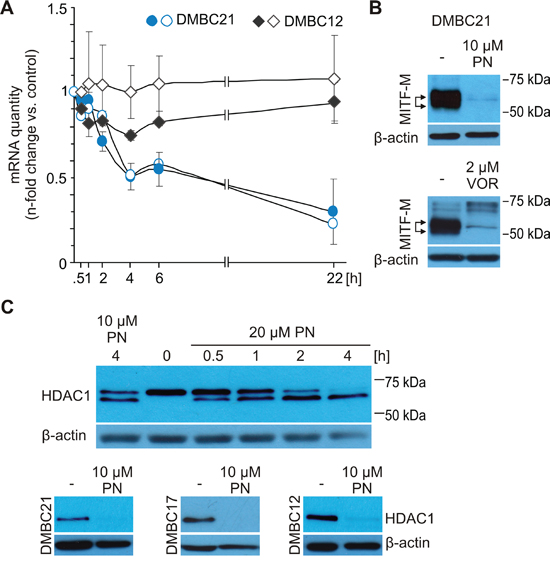
Figure 4: MITF level in melanoma cells might be reduced via inhibition of HDAC1 activity. A. Expression of total MITF (closed symbols) and MITF-M (open symbols) was analyzed by qRT-PCR in DMBC21 and DMBC12 melanoma cell populations treated with 20 μM PN. n-fold change in mRNA quantity is represented after normalization to RPS17 and the respective DMSO-treated control. B. Immunoblot analysis of lysates from DMBC21 cells treated with either 10 μM PN or 2 μM vorinostat (VOR) for 24 hours. C. DMBC21 cells were treated with 10 μM and 20 μM PN and harvested for Western blots at different time points to show changes in the HDAC1 level (top). HDAC1 level was assessed after 24 hours incubation with 10 μM PN (bottom). In Western blot experiments, equal loading was confirmed by β-actin. Representative results are shown.
Previously, PN was shown to specifically inhibit HDAC1 in breast cancer cells [32]. Moreover, inhibition of HDAC1 was reported as the mechanism of MITF downregulation in melanoma [36]. Using vorinostat (VOR), an inhibitor of HDAC1 activity, we confirmed that MITF-M is down-regulated by HDAC1 inhibition also in MITF-Mhigh DMBC21 cell population (Figure 4B). The kinetics of PN-induced HDAC1 inhibition for DMBC21 cells is shown in Figure 4C, top. The faster migrating band showing the degradation product [46], was already present after 30 min with 20 μM PN (Figure 4C, top). HDAC1 cleavage was also observed in other three melanoma populations treated with 20 μM PN for 4 hours (not shown). The prolonged incubation with 10 μM PN caused complete disappearance of HDAC1 protein in all tested populations (Figure 4C, bottom).
PN reduces proliferation, viability and clonogenic capacity of melanoma populations
PN inhibited cell proliferation and induced cell death displayed by an accumulation of cells in subG1 (Figure 5A, 5B and 5C). Induction of cell death was more efficient in DMBC12 population than in slow-cycling MITF-Mhigh DMBC21 population (Figure 5C). We have previously shown that PN induces apoptosis in melanoma cells [33, 34]. In the present study, poly(ADP-ribose)-polymerase (PARP) cleavage, a marker of apoptosis induction, was observed, and again it was more substantial in DMBC12 population than in DMBC17 and DMBC21 (Figure 5D). Exposure to PN for 4 hours was also long enough to markedly reduce a colony formation ability measured in soft agar after 3 weeks (Figure 5E).
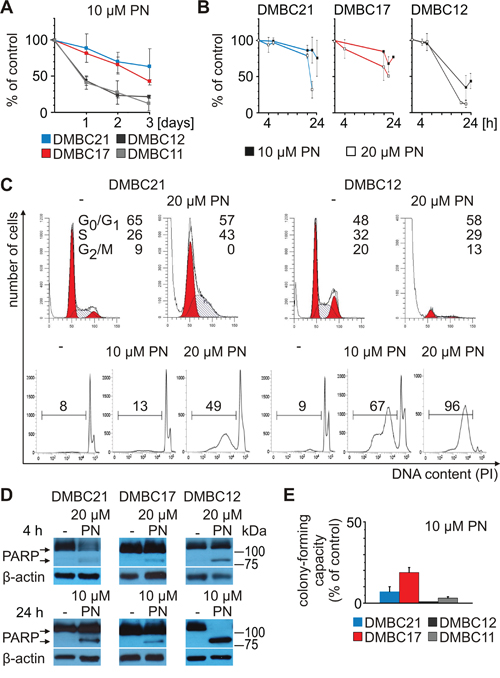
Figure 5: PN induces diverse cellular effects in different melanoma cell populations. PN was used at the indicated concentrations. A. Changes in viable cell number were assessed after 1, 2, 3 days as acid phosphatase activity. B. Viability was estimated by flow cytometry after PI-staining. C. Changes in cell cycle were assessed by flow cytometry. Upper part shows histogram profiles generated with ModFit and the percentages of cells in the G0/G1, S and G2/M phases of cell cycle are indicated. The lower part shows the percentages of cells in subG1. D. Apoptosis is shown as PARP cleavage after 4 and 24 hours of incubation with PN. Equal loading was confirmed by β-actin. E. Percentage of clonogenic outgrowth of PN-treated versus untreated melanoma cells was assessed 3 weeks after stimulation.
PN increases senescence in MITF-Mhigh melanoma cell populations
MITF-M depletion induces either senescence or apoptosis depending on the cellular background [12]. As PN was less efficient in triggering apoptosis in MITF-Mhigh populations, DMBC21 and DMBC17, we assessed whether it induced senescence. Indeed, 20 μM PN induced the hallmarks of senescence, such as (1) the enlargement of cells and increase in cell granularity already after 22 hours (Figure 6A), and (2) senescence-associated β-galactosidase (SA-β-gal) activity at acidic pH (Figure 6B) as shown for DMBC21 population. Similar results were obtained for DMBC17 population (not included). In contrast, not much stronger staining intensity was apparent in PN-treated MITF-Mlow DMBC12 cells than in control cells (bars in Figure 6B). Thus, induction of senescence was accompanied by MITF-M depletion only in MITF-Mhigh melanoma cells. Of note, the basal activity of senescence-associated β-galactosidase was much lower in DMBC12 cells than in DMBC21 cells, and incubation with its substrate had to be prolonged from 4 hours (DMBC21) to 22 hours (DMBC12). Searching for other cell-autonomous differences which might account for lack of PN-induced senescence in DMBC12 population, we examined basal MCL-1 level in untreated melanoma cells. MCL-1 was already shown to reduce susceptibility of cancer cells to drug-induced senescence [47]. MITF-Mhigh populations, DMBC21 and DMBC17 had low levels of MCL-1, which might create the conditions suitable for PN-induced senescence, whereas high level of MCL-1 protein in DMBC11 and DMBC12 populations might restrict induction of senescence (Figure 6C). Of note, the expression of MCL-1 in DMBC21 cells was not deficient as this protein was accumulated in the presence of bortezomib (Figure 3E).
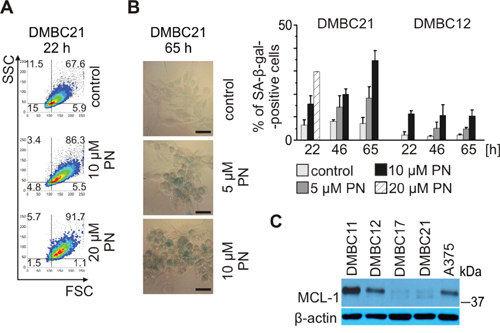
Figure 6: PN induces senescence in melanoma cells expressing MITF-M at high level. PN was used at indicated concentrations. A, B. Senescence shown as (A) enlargement of cells (FSC) and increase in cell granularity (SSC) after 22 hours of treatment with PN and (B) changes in senescence-associated β-galactosidase (SA-β-gal) activity evaluated under the phase-contrast microscope (scale bar = 50 μm) and quantified (right). C. Basal levels of MCL-1 protein in melanoma cell populations analyzed by immunoblotting. Equal loading was confirmed by β-actin.
DISCUSSION
MITF-M is a transcription factor specific for melanocytes and melanoma [8, 10, 12]. NF-κB is constitutively activated in many tumors [48, 49], and is involved in the cross talk with several transcription factors determining the cellular fate in response to stress [50]. The reduction of MITF expression has been reported as the result of the stimulation of melanoma cells with interleukin-1α or 1β suggesting that this process is NF-κB-dependent [51]. Moreover, the gene expression reciprocity between NF-κB and MITF in melanoma and a transition between phenotypes MITF-Mhigh/NF-κBlow and MITF-Mlow/NF-κBhigh as a part of melanoma plasticity in response to therapies targeting the BRAF/MEK/ERK pathway have been proposed [37]. The hypothesis of opposing regulatory networks operating through these two transcription factors prompted us to investigate the effect of PN, an inhibitor of NF-κB [16], on MITF-M expression in melanoma cells. Our results demonstrate, however, that PN very efficiently depletes MITF-M, both in the nucleus and in the cytoplasm. Furthermore, existence of the cell population that has MITF-Mhigh/NF-κBhigh phenotype (DMBC21) indicates that NF-κB not always antagonizes MITF expression in BRAFV600E-mutant melanomas. As (i) there was no tight inverse correlation between the level of MITF-M and phosphorylated p65 in untreated melanoma cells, and (ii) PN simultaneously reduced levels of both MITF-M and phosphorylated p65, a suppressive role of the NF-κB signaling on MITF-M protein level seems not plausible, at least for some melanomas. There are other examples of drugs simultaneously reducing MITF and NF-κB activities in melanoma cells [52, 53].
Senescence is recognized as an important process in the context of aging, wound healing and tumor suppression [54, 55]. In response to BRAFV600E mutation, melanocytes form growth-arrested nevi that are characterized by expression of several markers of senescence [56]. In BRAFV600E melanoma cells, vemurafenib induces features of senescence in addition to apoptosis [57]. In the present study, the induction of senescence by PN coincides with inhibition of MITF-M in MITF-Mhigh cells, whereas cell death was more efficiently induced in MITF-Mlow cells. MITF suppression was already reported as accompanying a lineage-specific senescence program in melanoma cells [58]. It was also shown that cellular senescence is associated with activation of NF-κB, which mediates the proinvasive capacity of the senescence-associated secretory phenotype (SASP), and downregulation of NF-κB can reduce proinvasive properties of this secretome [59]. Thus, PN by simultaneous downregulation of MITF-M and NF-κB might induce senescence without triggering these deleterious effects, which might be beneficial for melanoma therapy. Chemotherapy-induced senescence was reported to be inhibited by MCL-1 [47]. Our results showing that senescence can be efficiently induced only in MCL-1low melanoma cells support this finding.
PN was reported to specifically deplete HDAC1 protein in breast cancer cells without affecting other class I/II HDACs [32]. Our study has shown for the first time that PN can markedly decrease the HDAC1 level also in melanoma. MITF-M expression was already reported to be suppressed in melanocytes and melanoma cells by several HDAC inhibitors (HDACi), and this MITF depletion did not reduce melanocyte viability [36, 60]. Moreover, combined treatment with MAPK pathway and HDAC inhibitors suppressed MITF expression and melanoma resistance offering a novel clinical strategy to achieve more durable control of some BRAFV600E melanomas [60]. Furthermore, a phase I clinical study of HDAC inhibitor panobinostat (LBH589) with ipilimumab with unresectable III/IV melanoma is currently recruiting participants (ClinicalTrials.gov; NCT02032810). Although the mechanisms of MITF downregulation by HDACi are poorly understood, they probably involve the interference with upstream transcriptional regulator(s) of MITF-M. Expression, stability and activity of MITF-M are dynamically controlled on multiple levels by several pathways, whose activities are determined by genetic background and the microenvironment-dependent physiological context [11, 12, 13]. In the present study, PN downregulates MITF-M expression level similarly to vorinostat, an HDAC1 inhibitor, and regardless of RAS/RAF/MEK/ERK pathway activity status. This effect is observed in both wild type BRAF and BRAFV600E, and inhibition of MEK by GSK1120212 (trametinib) and induction of ERK1/2 activity by PN itself do not interfere with PN-triggered depletion of MITF-M. Several studies indicate the close relationship between WNT/β-catenin signaling and MITF-M expression and stability [44, 52, 61]. We have reported previously that the microenvironment-driven suppression of the WNT/β-catenin pathway is accompanied by downregulation of MITF in MITFhigh patient-derived melanoma cell populations [38]. Interestingly, the basal expression of LEF1, one of the MITF-M upstream regulators and effector of WNT signaling, was much higher in MITF-Mhigh than in MITF-Mlow populations, and PN markedly reduced the mRNA level of LEF1 (not shown). As we excluded the influence of PN on proteasomal turnover or caspase-mediated MITF-M degradation, further studies are needed to delineate the mechanism(s) responsible for PN-driven MITF-M downregulation.
Our findings that PN efficiently reduces the levels of MITF-M and HDAC1 in melanoma cells, especially when combined with the previous results on its inhibitory effect on NF-κB activity, might have important implications for the clinics. PN exerts, however, low solubility and bioavailability as shown in a phase I dose escalation trial [62]. It was demonstrated that the solubility could be improved by using the fumarate salt of dimethyloamino parthenolide (DMAPT) [63, 64]. Another direction is to develop an efficient PN delivery system for cancer treatment and the work is ongoing [65]. But it should be also considered that this natural drug has been used for centuries as a bioactive component of feverfew (Tanacetum parthenium) to treat fever, migraine, rheumatoid arthritis and menstrual irregularities, and in this form is efficient and of low toxicity. Therefore, the present study strongly suggests that PN/feverfew could be considered as a part of prophylactic treatment or combined treatment when simultaneous inhibition of NF-κB, MITF-M and HDAC1 is needed. As targeting NF-κB enhances response to RAF inhibitors [66] and targeting MITF along with HDAC prevents cAMP/MITF-driven resistance to MAPK-pathway inhibitors [60], PN might be considered as a part of combined therapy for melanoma patients with BRAFV600E-driven melanomas.
MITF protein levels vary between melanoma specimens [67], which is also reflected in the present study performed in patient-derived populations. Both high and low MITF-M expression levels have been linked with melanoma development. Alterations in the MITF-M level have been shown to induce changes in melanoma phenotype and function [13]. Inter- and intraindividual heterogeneity of melanomas results in the differential response to drugs [2, 68]. Our previous and present studies provide evidence that the character and intensity of cellular effects of PN can be diverse in different melanomas, and MITF-M level can be one of the determinants. The outcome of treatment with PN, cell death or senescence, might also depend on other molecules crucial for melanoma proliferation and survival such as MCL-1, and therefore melanoma tumors have to be molecularly characterized to select appropriate drugs for combined treatment. Taken together, the results of the present study provide data for a model (Figure 7) in which the possible pleiotropic effects of PN are narrowed by the molecular context exhibited in the present study as MITF-M and NF-κB levels. PN-induced inhibition of HDAC1 seems to be a common mechanism for all melanomas.
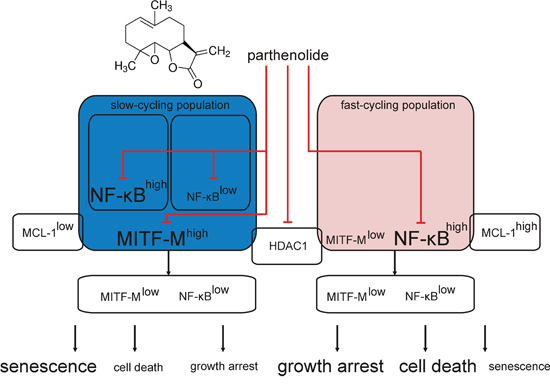
Figure 7: Schematic model of parthenolide (PN) activity in MITF-Mhigh and MITF-Mlow patient-derived melanoma cell populations. The present results clearly indicate that PN decreases MITF-M on the transcript and protein levels in MITF-Mhigh melanoma cell populations. Independently on the basal MITF-M expression level, PN inhibits the activity of p65/NF-κB and decreases HDAC1 level. Considering previous reports showing the MITF-M dependence on HDAC1 activity [36, 60] and PN capacity to suppress HDAC1 [32], we hypothesize that PN might influence the MITF-M level by inhibition of HDAC1. Diverse cellular effects of PN treatment are predefined by molecular characteristics of melanoma cell populations. In MITF-Mhigh melanoma cells either NF-κBhigh or NF-κBlow (blue background) PN induces cellular senescence with minor cytotoxic effects, while in MITF-Mlow populations (light red background) cell death is the dominant cellular outcome. Other cell-autonomous differences e.g., in the MCL-1 might also contribute. PN can be developed as a part of combination therapy against melanoma when simultaneous inhibition of MITF-M, NF-κB and HDAC1 is needed.
MATERIALS AND METHODS
Drugs and chemicals
Parthenolide (PN) was purchased from Biomol, Z-VAD-fmk from Promega (Madison, WI), Z-DEVD-fmk from BD Biosciences, chloroquine (CQ) from Sigma-Aldrich, bortezomib (BOR), vorinostat (VOR) and trametinib (TRA) from Selleck Chemicals LLC. Chemical structure of PN was prepared in ChemOffice 15.0.
Tumor tissues
Melanoma specimens were obtained during surgical procedures. Permission was granted by Ethical Commission of Medical University of Lodz, and all patients consented to participate in the study.
In vitro cell culture
Cells from tumor samples were isolated as described previously [69]. Briefly, tumor fragments were minced and incubated in Hank’s balanced salt solution (Sigma-Aldrich) with 3 mmol/l calcium chloride, 1 mg/ml collagenase IV and 10 μg/ml DNase I at 37°C. Isolated cells were grown for one day in RPMI medium supplemented with 10% fetal bovine serum (FBS). Then, they were cultured in stem cell medium (SCM), consisting of DMEM/F12 low osmolality medium (Lonza), B-27 supplement (Gibco), growth factors: 10 ng/ml bFGF and 20 ng/ml EGF (BD Biosciences), insulin (10 μg/ml), heparin (1 ng/ml) and antibiotics (100 IU/ml penicillin, 100 μg/ml streptomycin). Medium was exchanged twice a week.
Viability assay
Viability was assessed by propidium iodide staining according to standard procedures and analyzed using a FACSVerse flow cytometer (Becton Dickinson).
Acid phosphatase activity (APA) assay
To assess relative changes in the viable cell number, the activity of acid phosphatase was measured colorimetrically [69]. Doubling time (DT) was calculated using the formula: DT = (t – t0)log2 / (logA – logA0), in which t and t0 are the times at which the cells were assessed and A and A0 are the absorbance at times t and t0, respectively.
Flow cytometry analysis of MITF- and Melan-A-positive cells
The following antibodies were used: anti-MITF (Abcam) along with APC-conjugated goat anti-rabbit (Santa Cruz Biotechnology) and anti-Melan-A (DAKO) along with FITC-conjugated goat anti-mouse (BD Pharmingen). Typically, 30,000 cells/sample were analyzed. Appropriate isotype controls were used. To exclude dead cells from the analysis, LIVE/DEAD® Fixable Violet Dead Cell Stain Kit (Invitrogen) was used. Acquisition was performed using FACSVerse flow cytometer (Becton Dickinson) and analyzed using BD Cell Quest software.
Cell cycle analysis
Melanoma cells were treated with PN for 24 h. Cells were collected and fixed with 70% (w/v) ethanol at -20°C. After washing with PBS, cells were resuspended in PI Staining Buffer containing RNase (Becton Dickinson). Following incubation for 30 min at room temperature, cells were analysed using a FACSVerse flow cytometer. ModFit LT 3.0 software (Verify Software) was used to calculate the percentages in each cell cycle phase and FACSuite software (BD Biosciences) to calculate the percentages of cells in subG1.
Preparation of cell lysates/fractions and immunoblotting
Preparation of cell lysates and immunodetection were described previously [70]. Briefly, melanoma cells were lysed in RIPA buffer (50 mmol/l Tris-HCl pH 8.0, 150 mmol/l NaCl, 1% Triton X-100, 0.5% sodium deoxycholate, 0.1% SDS) supplemented with freshly added protease and phosphatase inhibitors. To obtain cellular fractions, cells were homogenized in hypotonic buffer containing 10 mM HEPES, 1.5 mM MgCl2, 10 mM KCl, 0.2 mM PMSF and 0.5 mM DTT and cytosolic fraction was separated from nuclei that were lysed in RIPA buffer. Cell lysates and fractions were diluted in 2x Laemmli buffer and protein samples (15 μg each) were loaded on standard 7% SDS-polyacrylamide gel. The proteins were transferred onto an Immobilon-P PVDF membrane (Millipore). The membrane was incubated in a blocking solution: 5% nonfat milk in PBS-Tween 0.05% or 5% phosphoBLOCKER (Cell Biolabs) in PBS-Tween 0.05%. Primary antibodies detecting PARP, MCL-1, HDAC1, lamin B were from Santa Cruz Biotechnology, MITF, p-p65 (Ser536), p65, p-ERK1/2 (Thr202/Tyr204), ERK1/2 from Cell Signaling Technology. BRAFV600E antibodies recognizing V600E-mutated, but not wild-type BRAF were from Biomol. Quantitative analysis of the results was performed by using NIH ImageJ software.
RNA isolation and real-time PCR (qRT-PCR)
Total RNA isolation and qRT-PCR were described previously [71]. Briefly, RNA was isolated and purified using Total RNA Isolation kit (A&A Biotechnology). cDNA was subsequently synthesized by using random primers (Promega) and SuperScript II Reverse Transcriptase (Invitrogen). The amplification was performed by using KAPA SYBR FAST qPCR 2x Master Mix (Kapa Biosystems) and Rotor-Gene 3000 Real-Time DNA analysis system (Corbett Research). RPS17 was used as a reference gene. The relative mRNA expression was calculated based on the expression ratio of the target gene versus reference gene, and correction of amplification efficiency of the individual transcripts was included as described by Pfaffl [72]. Sequences of primers used in qRT-PCR were shown elsewhere [38].
Senescence assay
Senescence staining kit (Sigma-Aldrich) was used according to the manufacturer protocol. Cells were incubated with staining mixture for 4 hours (DMBC21) or 22 hours (DMBC12) and observed under a microscope (Olympus BX41; Olympus Optical). At least 200 cells were counted to calculate the frequency of senescence-associated β-galactosidase (SA-β-gal)-positive cells.
Soft agar colony formation assay
Cells were incubated with PN for 4 hours and 1 x 10³ viable cells were transferred to plates containing agar as described previously [19]. Colonies were counted under the microscope 3 weeks later. PN-induced change in colony-forming capacity was expressed as % of control.
ACKNOWLEDGMENTS
We thank Dr. Anna Gajos-Michniewicz for cell culture propagation, Dr. Markus Duechler for stimulating discussion and suggestions and Ewa Wlazlowicz for administrative and technical support.
FINANCIAL DISCLOSURE
This work was financially supported by 2012/06/M/NZ2/00109 from National Science Centre (Poland).
CONFLICTS OF INTEREST
The authors state no conflict of interest.
REFERENCES
1. Shtivelman E, Davies MQ, Hwu P, Yang J, Lotem M, Oren M, Flaherty KT, Fisher DE. Pathways and therapeutic targets in melanoma. Oncotarget. 2014; 5: 1701-1752. doi: 10.18632/oncotarget.1892.
2. Roesch A. Tumor heterogeneity and plasticity as elusive drivers for resistance to MAPK pathway inihibition in melanoma. Oncogene. 2015; 34: 2951-2957.
3. Ho AW, Tsao H. Targeted therapies in melanoma: translational research at its finest. J Invest Dermatol. 2015; 135: 1929-1933.
4. Slominski AT, Carlson JA. Melanoma resistance: a bright future for academicians and a challenge for patients advocates. Mayo Clin Proc. 2014; 89: 429-433.
5. Cirenajwis H, Ekedahl H, Lauss M, Harbst K, Carneiro A, Enoksson J, Rosengren F, Werner-Hartman L, Törngren T, Kvist A, Fredlund E, Bendahl PO, Jirström K, et al. Molecular stratification of metastatic melanoma using gene expression profiling: Prediction of survival outcome and benefit from molecular targeted therapy. Oncotarget. 2015; 6: 12297-12309. doi: 10.18632/oncotarget.3655.
6. Curiel-Olmo S, García-Castaño A, Vidal R, Pisonero H, Varela I, León-Castillo A, Trillo E, González-Vela C, García-Diaz N, Almaraz C, Moreno T, Cereceda L, Madureira R, et al. Individualized strategies to target specific mechanisms of disease in malignant melanoma patients displaying unique mutational signatures. Oncotarget. 2015; 6: 25452-25465. doi: 10.18632/oncotarget.4545.
7. Roider EM, Fisher DE. The impact of MITF on melanoma development: news from bench and bedside. J Invest Dermatol. 2014; 134: 16-17.
8. Garraway LA, Widlund HR, Rubin MA, Getz G, Berger AJ, Ramaswamy S, Beroukhim R, Milner DA, Granter SR, Du J, Lee C, Wagner SN, Li C, et al. Integrative genomic analyses identify MITF as a lineage survival oncogene amplified in malignant melanoma. Nature. 2005; 436: 117-122.
9. Slominski A, Tobin DJ, Shibahara S, Wortsman J. Melanin pigmentation in mammalian skin and its hormonal regulation. Physiol Rev. 2004; 84: 1155-1228.
10. Roh E, Yun CY, Young Yun J Park D, Doo Kim N, Yeon Hwang B, Jung SH, Park SK, Kim YB, Han SB, Kim Y. cAMP-binding site of PKA as a molecular target of bisabolangelone against melanocyte-specific hyperpigmented disorder. J Invest Dermatol. 2013; 133: 1072-1079.
11. Hartman ML, Czyz M. Pro-survival role of MITF in melanoma. J Invest Dermatol. 2015; 135: 352-358.
12. Wellbrock C, Arozarena I. Microphthalmia-associated transcription factor in melanoma development and MAP-kinase pathway targeted therapy. Pigment Cell Melanoma Res. 2015; 28: 390-406.
13. Hartman ML, Czyz M. MITF in melanoma: mechanisms behind its expression and activity. Cell Mol Life Sci. 2015; 72: 1249-1260.
14. Lauss M, Haq R, Cirenajwis H, Phung B, Harbst K, Staaf J, Rosengren F, Holm K, Aine M, Jirström K, Borg Å, Busch C, Geisler J, et al. Genome-wide DNA methylation analysis in melanoma reveals the importance of CpG methylation in MITF regulation. J Invest Dermatol. 2015; 135: 1820-1828.
15. Haq R, Shoag J, Andreu-Perez P, Yokoyama S, Edelman H, Rowe GC, Frederick DT, Hurley AD, Nellore A, Kung AL, Wargo JA, Song JS, Fisher DE, et al. Oncogenic BRAF regulates oxidative metabolism via PGC1alpha and MITF. Cancer Cell. 2013; 23: 302-315.
16. Ghantous A, Sinjab A, Herceg Z, Darwiche N. Parthenolide: from plant shoots to cancer roots. Drug Discov Today. 2013; 18: 894-905.
17. Wen J, You KR, Lee SY, Song CH, Kim DG. Oxidative stress-mediated apoptosis. The anticancer effect of the sesquiterpene lactone parthenolide. J Biol Chem. 2002; 277: 38954-38964.
18. Guzman ML, Rossi RM, Karnischky L, Li X, Peterson DR, Howard DS, Jordan CT. The sesquiterpene lactone parthenolide induces apoptosis of human acute myelogenous leukemia stem and progenitor cells. Blood. 2005; 105: 4163-4169.
19. Czyz M, Koprowska K, Sztiller-Sikorska M. Parthenolide reduces the frequency of ABCB5-positive cells and clonogenic capacity of melanoma cells from anchorage independent melanospheres. Cancer Biol Ther. 2013; 14: 135-145.
20. Diamanti P, Cox CV, Moppett JP, Blair A. Parthenolide eliminates leukemia-initiating cell populations and improves survival in xenografts of childhood acute lymphoblastic leukemia. Blood. 2013; 121: 1384-1393.
21. Liao K, Xia B, Zhuang QY, Hou MJ, Zhang YJ, Luo B, Qiu Y, Gao YF, Li XJ, Chen HF, Ling WH, He CY, Huang YJ, et al. Parthenolide inhibits cancer stem-like side population of nasopharyngeal cells via suppression of the NF-kB/COX-2 pathway. Theranostics. 2015; 5: 302-321.
22. Won YK, Ong CN, Shi X, Shen HM. Chemopreventive activity of parthenolide against UVB-induced skin cancer and its mechanisms. Carcinogenesis. 2004; 25: 1449-58.
23. Hehner SP, Hofmann TG, Droge W, Schmitz ML. The anti-inflammatory sesquiterpene lactone parthenolide inhibits NF-kappa B by targeting the I kappa B kinase complex. J Immunol. 1999; 163: 5617-5623.
24. Zunino SJ, Ducore JM, Storms DH Parthenolide induces significant apoptosis and production of reactive oxygen species in high-risk pre-B leukemia cells. Cancer Lett. 2007; 254: 119-127.
25. Garcia-Pineres AJ, Lindenmeyer MT, Merfort I. Role of cysteine residues of p65/NF-kappaB on the inhibition by the sesquiterpene lactone parthenolide and N-ethyl maleimide, and on its transactivating potential. Life Sci. 2004; 75: 841-856.
26. Zhang YC, Ye H, Zeng Z, Chin E, Huang YN, Fu GH. The NF-κB p65/miR-23a-27a-24 cluster is a target for leukemia treatment. Oncotarget. 2015; 6: 33554-33567. doi: 10.18632/oncotarget.5591.
27. Gou WF, Shen DF, Yang XF, Zhao S, Liu YP, Sun HZ, Su RJ, Luo JS, Zheng HC. ING5 suppresses proliferation, apoptosis, migration and invasion, and induces autophagy and differentiation of gastric cancer cells: a good marker for carcinogenesis and subsequent progression. Oncotarget. 2015; 6: 19552-19579. doi: 10.18632/oncotarget.3735.
28. Saadane A, Eastman J, Berger M, Bonfield TM. Parthenolide inhibits ERK and AP-1 which are dysregulated and contribute to excessive IL-8 expression and secretion in cystic fibrosis cells. J Inflamm. 2011; 8: 26.
29. Carlisi D, D’Anneo A, Angileri L, Lauricella M, Emanuele S, Santulli A, Vento R, Tesoriere G. Parthenolide sensitizes hepatocellular carcinoma cells to TRAIL by inducing the expression of death receptors through inhibition of STAT3 activation. J Cell Physiol. 2011; 226: 1632-1641.
30. Nakshatri H, Rice SE, Bhat-Nakshatri P. Antitumor agent parthenolide reverses resistance of breast cancer cells to tumor necrosis factor-related apoptosis-inducing ligand through sustained activation of c-Jun N-terminal kinase. Oncogene. 2004; 23: 7330-7344.
31. Gopal YN, Chanchorn E, Van Dyke MW. Parthenolide promotes the ubiquitination of MDM2 and activates p53 cellular functions. Mol Cancer Ther. 2009; 8: 552-562.
32. Gopal YN, Arora TS, Van Dyke MW. Parthenolide specifically depletes histone deacetylase 1 protein and induces cell death through ataxia telangiectasia mutated. Chem Biol. 2007; 14: 813-823.
33. Lesiak K, Koprowska K, Zalesna I, Nejc D, Düchler M, Czyz M. Parthenolide, a sesquiterpene lactone from the medical herb feverfew, shows anticancer activity against human melanoma cells in vitro. Melanoma Res. 2010; 20: 21-34.
34. Czyz M, Lesiak-Mieczkowska K, Koprowska K, Szulawska-Mroczek A, Wozniak M. Cell context-dependent activities of parthenolide in primary and metastatic melanoma cells. Br J Pharmacol. 2010; 160: 1144-1157.
35. D’Anneo A, Carlisi D, Lauricella M, Emanuele S, Di Fiore R, Vento R, Tesoriere G. Parthenolide induces caspase-independent and AIF-mediated cell death in human osteosarcoma and melanoma cells. J Cell Physiol. 2012; 228: 952-967.
36. Yokoyama S, Feige E, Poling LL, Levy C, Widlund HR, Khaled M, Kung AL, Fisher DE. Pharmacological suppression of MITF expression via HDAC inhibitors in the melanocyte lineage. Pigment Cell Melanoma Res. 2008; 21: 457-463.
37. Konieczkowski DJ, Johannessen CM, Abudayyeh O, Kim JW, Cooper ZA, Piris A, Frederick DT, Barzily-Rokni M, Straussman R, Haq R, Fisher DE, Mesirov JP, Hahn WC, et al. A melanoma cell state distinction influences sensitivity to MAPK pathway inhibitors. Cancer Discov. 2014; 4: 816-827.
38. Hartman ML, Talar B, Noman Z, Gajos-Michniewicz A, Chouaib S, Czyz M. Gene expression profiling identifies microphthalmia-associated transcription factor (MITF) and Dickkopf-1 (DKK1) as regulators of microenvironment-driven alterations in melanoma phenotype. PLoS One. 2014; 9: e95157.
39. Sztiller-Sikorska M, Hartman ML, Talar B, Jakubowska J, Zalesna I, Czyz M. Phenotypic diversity of patient-derived melanoma populations in stem cell medium. Lab Invest. 2015; 95: 672-683.
40. Hartman ML, Talar B, Gajos-Michniewicz A, Czyz M. MCL-1, BCL-XL and MITF are diversely employed in adaptive response melanoma cells to changes in microenvironment. PLoS One. 2015; 10: e0128796.
41. Hodis E, Watson IR, Kryukov GV, Arold ST, Imielinski M, Theurillat JP, Nickerson E, Auclair D, Li L, Place C, Dicara D, Ramos AH, Lawrence MS, et al. A landscape of driver mutations in melanoma. Cell. 2012; 150: 251-263.
42. Xu W, Gong L, Haddad MM, Bischof O, Campisi J, Yeh ET, Medrano EE. Regulation of microphthalmia-associated transcription factor MITF protein levels by association with the ubiquitin-conjugating enzyme hUBC9. Exp Cell Res. 2000; 255: 135-143.
43. Lee CS, Park M, Han J, Lee JH, Bae IH, Choi H, Son ED, Park YH, Lim KM. Liver X receptor activation inhibits melanogenesis through the acceleration of ERK-mediated MITF degradation. J Invest Dermatol. 2013; 133: 1063-1071.
44. Ploper D, Taelman VF, Robert L, Perez BS, Titz B, Chen HW, Graeber TG, von Euw E, Ribas A, De Robertis EM. MITF drives endolysosomal biogenesis and potentiates Wnt signaling in melanoma cells. Proc Natl Acad Sci U S A. 2015; 112: E420-429.
45. Larribere L, Hilmi C, Khaled M, Gaggioli C, Bille K, Auberger P, Ortonne JP, Ballotti R, Bertolotto C. The cleavage of microphthalmia-associated transcription factor, MITF, by caspases plays an essential role in melanocyte and melanoma cell apoptosis. Genes Dev. 2005; 19: 1980-1985.
46. Ghantous A, Saikali M, Rau T, Gali-Muhtasib H, Schneider-Stock R, Darwiche N. Inhibition of tumor promotion by parthenolide: epigenetic modulation of p21. Cancer Prev Res. 2012; 5: 1298-1309.
47. Bolesta E, Pfannenstiel LW, Demelash A, Lesniewski ML, Tobin M, Schlanger SE, Nallar SC, Papadimitriou JC, Kalvakolanu DV, Gastman BR. Inhibition of Mcl-1 promotes senescence in cancer cells: implications for preventing tumor growth and chemotherapy resistance. Mol Cell Biol. 2012; 32: 1879-1892.
48. Perkins ND. The diverse and complex roles of NF-kB subunits in cancer. Nat Rev Cancer. 2012; 12: 121-132.
49. Prabhu L, Mundade R, Korc M, Loehrer PJ, Lu T. Critical role of NF-κB in pancreatic cancer. Oncotarget. 2014; 5: 10969-10975. doi: 10.18632/oncotarget.2624.
50. Tergaonkar V. p53 and NFkappaB: fresh breath in the cross talk. Cell Res. 2009; 19: 1313-1335.
51. Kholmanskikh O, van Baren N, Brasseur F, Ottaviani S, Vanacker J, Arts N, van der Bruggen P, Coulie P, De Plaen E. Interleukins 1alpha and 1beta secreted by some melanoma cell lines strongly reduce expression of MITF-M and melanocyte differentiation antigens. Int J Cancer. 2010; 127: 1625-1636.
52. Syed DN, Afaq F, Maddodi N, Johnson JJ, Sarfaraz S, Ahmad A, Setaluri V, Mukhtar H. Inhibition of human melanoma cell growth by the dietary flavonoid fisetin is associated with disruption of Wnt/b-catenin signaling and decreased Mitf levels. J Invest Dermatol. 2011; 131: 1291-1299.
53. Pal HC, Sharma S, Strickland LR, Katiyar SK, Ballestas ME, Athar M, Elmets CA, Afaq F. Fisetin inhibits human melanoma cell invasion through promotion of mesenchymal to epithelial transition and by targeting MAPK and NFκB signaling pathways. PLoS One. 2014; 9: e86338.
54. Berman AE, Leontieva OV, Natarajan V, McCubrey JA, Demidenko ZN, Nikiforov MA. Recent progress in genetics of aging, senescence and longevity: focusing on cancer-related genes. Oncotarget. 2012; 3: 1522-1532. doi: 10.18632/oncotarget.889.
55. Sharpless NE, Sherr CJ. Forging a signature of in vivo senescence. Nat Rev Cancer. 2015; 15: 397-408.
56. Michaloglou C, Vredeveld LC, Soengas MS, Denoyelle C, Kuilman T, van der Horst CM, Majoor DM, Shay JW, Mooi WJ, Peeper DS. BRAFE600-associated senescence-like cell cycle arrest of human naevi. Nature. 2005; 436: 720-724.
57. Haferkamp S, Borst A, Adam C, Becker TM, Motschenbacher S, Windhövel S, Hufnagel AL, Houben R, Meierjohann S. Vemurafenib induces senescence features in melanoma cells. J Invest Dermatol. 2013; 133: 1601-1609.
58. Giuliano S, Cheli Y, Ohanna M, Bonet C, Beuret L, Bille K, Loubat A, Hofman V, Hofman P, Ponzio G, Bahadoran P, Ballotti R, Bertolotto C. Microphthalmia-associated transcription factor controls the DNA damage response and a lineage-specific senescence program in melanomas. Cancer Res. 2010; 70: 3813-3822.
59. Ohanna M, Giuliano S, Bonet C, Imbert V, Hofman V, Zangari J, Bille K, Robert C, Bressac-de Paillerets B, Hofman P, Rocchi S, Peyron JF, Lacour JP, et al. Senescent cells develop a PARP-1 and nuclear factor-{kappa}B-associated secretome (PNAS). Genes Dev. 2011; 25: 1245-1261.
60. Johannessen CM, Johnson LA, Piccioni F, Townes A, Frederick DT, Donahue MK, Narayan R, Flaherty KT, Wargo JA, Root DE, Garraway LA. A melanocyte lineage program confers resistance to MAP kinase pathway inhibition. Nature. 2013; 504: 138-142.
61. Saito H, Yasumoto K, Takeda K, Takahashi K, Yamamoto H, Shibahara S. Microphthalmia-associated transcription factor in the Wnt signaling pathway. Pigment Cell Res. 2003; 16: 261–265.
62. Curry EA, Murry DJ, Yoder C, Fife K, Armstrong V, Nakshatri H, O'Connell M, Sweeney CJ. Phase I dose escalation trial of feverfew with standardized doses of parthenolide in patients with cancer. Invest New Drugs. 2004; 22: 299-305.
63. Guzman ML, Rossi RM, Neelakantan S, Li X, Corbett CA, Hassane DC, Becker MW, Bennett JM, Sullivan E, Lachowicz JL, Vaughan A, Sweeney CJ, Matthews W, et al. An orally bioavailable parthenolide analog selectively eradicates acute myelogenous leukemia stem and progenitor cells. Blood. 2007; 110: 4427-4435.
64. Shanmugam R, Kusumanchi P, Cheng L, Crooks P, Neelakantan S, Matthews W, Nakshatri H, Sweeney CJ. A water-soluble parthenolide analogue suppresses in vivo prostate cancer growth by targeting NFkappaB and generating reactive oxygen species. Prostate. 2010; 70: 1074-1086.
65. Baranello MP, Bauer L, Jordan CT, Benoit DSW. Micelle delivery of parthenolide to acute myeloid leukemia cells. Cell Mol Bioeng. 2015; 8: 455-470.
66. Shao Y, Le K, Cheng H, Aplin AE. NF-κB regulation of c-FLIP promotes TNFα-mediated RAF inhibitor resistance in melanoma. J Invest Dermatol. 2015; 135: 1839-1848.
67. Flaherty KT, Hodi FS, Fisher DE. From genes to drugs: targeted strategies for melanoma. Nat Rev Cancer. 2012; 12: 349-361.
68. Gray ES, Reid AL, Bowyer S, Calapre L, Siew K, Pearce R, Cowell L, Frank MH, Millward M, Ziman M. Circulating melanoma cell subpopulations: their heterogeneity and differential responses to treatment. J Invest Dermatol. 2015; 135: 2040-2048.
69. Sztiller-Sikorska M, Koprowska K, Jakubowska J, Zalesna I, Stasiak M, Duechler M, Czyz ME. Sphere formation and self-renewal capacity of melanoma cells is affected by the microenvironment. Melanoma Res. 2012; 22: 215-224.
70. Koprowska K, Hartman ML, Sztiller-Sikorska M, Czyz ME. Parthenolide enhances dacarbazine activity against melanoma cells. Anticancer Drugs. 2013; 24: 835-845.
71. Sztiller-Sikorska M, Koprowska K, Majchrzak K, Hartman M, Czyz M. Natural compounds’ activity against cancer stem-like or fast-cycling melanoma cells. PloS One. 2014; 9: e90783.
72. Pfaffl MW. A new mathematical model for relative quantification in real-time RT-PCR. Nucleic Acids Res. 2001; 29: e45.