
Introduction
The phosphatidylinositol 3-kinase (PI3K) pathway is often induced in breast cancer through loss of the tumor suppressor Phosphatase and TENsin homolog (PTEN) or through activating mutations in PIK3CA, the catalytic subunit of PI3K [1-3]. A large body of evidence points to similar as well as distinct effects of Pten loss versus PIK3CA mutations on cancer progression and response to therapy [3-7]. Yet, a direct comparison of closely related tumors driven by alterations in these genes in a biologically relevant system is lacking.
Our laboratories have generated mice that develop mammary tumors following conditional Pten deletion or PIK3CAH1047R mutation each induced by the same MMTV-Cre transgenic line [8, 9]. Pten∆ tumors from MMTV-Cre:Ptenf/f mice as well as from WAP-Cre:Ptenf/f mice grouped closely with certain Wnt-Brca1-p53 tumors and with normal-like tumors, whereas PIK3CAH1047R tumors were classified as two subtypes: squamous-likeEx, and class14Ex with a ‘luminal’ expression profile [9, 10]. Here we used cluster analysis, Gene set enrichment analysis and pathway activity analysis to compare and contrast Pten∆ and PIK3CAH1047R mammary tumors. Remarkably, we found that Pten∆ tumors cluster only with class14Ex but not with squamous-likeEx PIK3CAH1047R tumors. Furthermore, class14Ex tumors from both models, while substantially similar in gene set expression and multiple signalling pathways, show important differences: Pten∆ tumors exhibit high PI3K signalling activity, whereas PIK3CAH1047R tumors have elevated EGFR signalling. These differences may underlie tumor progression and response to therapy in Pten∆ versus PIK3CAH1047R breast cancers.
Results
Cluster analysis reveals that Pten∆ mammary tumors group together with class14Ex PIK3CAH1047R mammary tumors
To compare Pten∆ and PIK3CAH1047R mammary tumors by RNA profiling, we integrated microarray data from Pten∆ tumors with the classifier in Ref. [10], which includes PIK3CAH1047R mammary tumors, using Distance Weighted Discrimination (DWD) algorithm as described [9]. As expected, unsupervised hierarchical clustering grouped PIK3CAH1047R tumors on two separate leafs denoted squamous-likeEx and class14Ex (Figure 1). Strikingly, most Pten∆ (15/18) tumors clustered closely with the class14Ex subset (5/12) (Figure 1; red box), and none clustered closely with the squamous-likeEx PIK3CAH1047R tumors (Figure 1; blue box), indicating that at least using this classifier, PIK3CAH1047R tumors show greater molecular diversity than Pten∆ tumors.
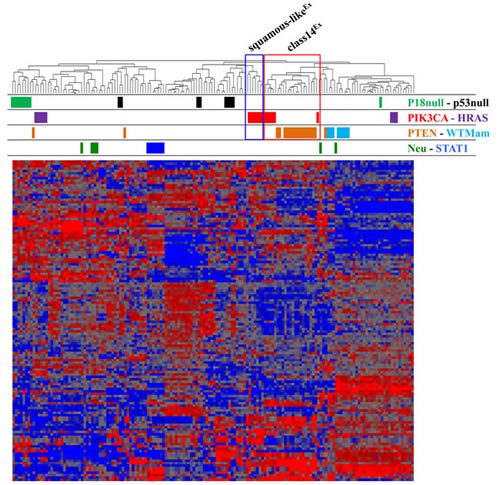
Figure 1: Unsupervised cluster analysis of Pten∆ and PIK3CAH1047R tumors with other mouse models of breast cancer (Ref. [10]). Most Pten∆ tumors - derived from both MMTV-Cre:Ptenf/f and WAP-Cre:Ptenf/f mice - clustered with ~half of PIK3CAH1047R tumors previously classified as class14Ex (red box). The cluster of PIK3CAH1047R tumors immediately left to the red box represents squamous-likeEx tumors (blue box).
GSEA analysis demonstrates enrichment of highly similar as well as unique gene sets in class14Ex Pten∆ and PIK3CAH1047R mammary tumors
To identify shared and unique biological pathways that are significantly altered in tumors from MMTV-Cre:Ptenf/f and MMTV-Cre:Pik3caLSL-H1047R mice, we performed Gene Set Enrichment Analysis (GSEA) on those that clustered together (Figure 1, red box). We first compared each tumor type to control mammary glands analyzed on the same platform, and then identified pathways that were induced or repressed in each group relative to controls. Remarkably, most altered pathways were comparably induced (red) or repressed (blue) in both Pten∆ and PIK3CAH1047R-driven tumors (Figure 2). These included Basal/Erbb2 Breast Cancer and Ovarian Cancer, Transcription/Translation and Mammary Stem Cell pathways that were induced, and Luminal Breast Cancer, Histone Methylation, Mitochondria and other metabolic as well as Cancer Associated pathways that were repressed (Supplemental Table 1). Thus, both tumors are more basal/less luminal, and less dependent on mitochondria, glucose, fatty acid and amino-acid metabolism relative to normal mammary glands. Notably most repressed cancer pathways are designated as “repressed in cancer”, indicating that they are activated in Pten∆ and PIK3CAH1047R tumors.
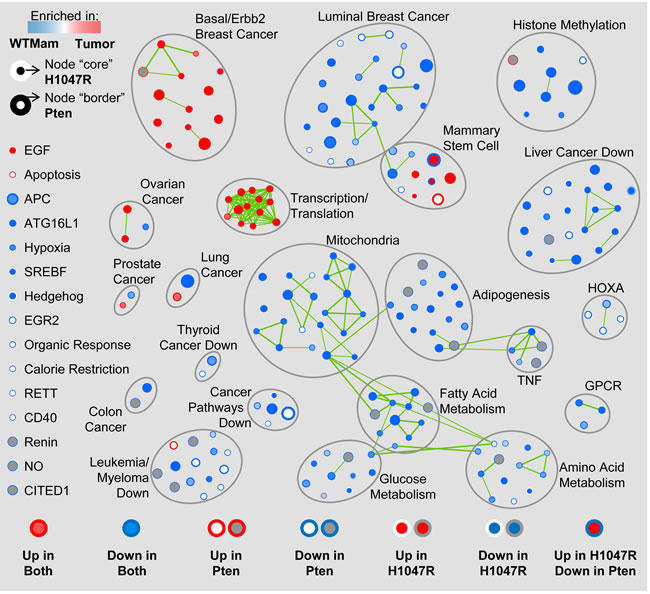
Figure 2: Gene Set Enrichment Analysis (GSEA) map of Pten∆ and PIK3CAH1047R-driven class14Ex tumors. Only tumors from MMTV-Cre:Ptenf/f and MMTV-Cre:Pik3caLSL-H1047R mice grouped together in Figure 1 (red box) were used in this analysis. Circles represent pathways/nodes; clusters of nodes are grouped together; green lines connecting two or more pathways/nodes in a cluster reflect shared genes.
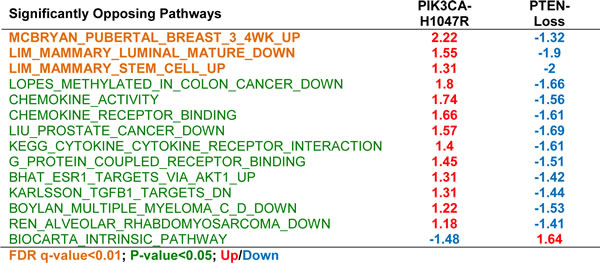
At the high stringent False Discovery Rate (FDR) used here (q < 0.01), several pathways were unique, i.e. induced or suppressed only in Pten∆ or only in PIK3CAH1047R-driven tumors; and 3 pathways were strongly induced in opposite directions: MCBRYAN_PUBERTAL_BREAST_3_4WK_UP - from the Basal/Erbb2 cluster, and LIM_MAMMARY_LUMINAL_MATURE_DN and LIM_MAMMARY_STEM_CELL_UP from the Mammary Stem Cell cluster (Table 1; Supplemental Table 1). Overall, of 219 significant pathways in Pten∆ and PIK3CAH1047R-driven tumors, 194 showed the same trend, 20 were unique (with NA/not applicable in one of the columns in Supplemental Table 1), and 3 were strongly contrasting. At lower stringency, p < 0.05, 11 additional pathways in the opposing directions were observed (Table 1).
Table 1: Significantly opposing pathways by GSEA
Pathway activity analysis reveals a significant increase in PI3K signalling in Pten∆ mammary tumors and an increase in EGFR signalling in PIK3CAH1047R class14Ex tumors
To further dissect differences between Pten∆ and PIK3CAH1047R tumors, we determined signature activities for all 18 signalling pathways described by Gatza et al. [11]. Strikingly, only PI3K and EGFR pathways were significantly altered: the PI3K pathway was induced in Pten∆ relative to PIK3CAH1047R tumors (P = 8.72E-05 by ANOVA), while EGFR signaling was induced in PIK3CAH1047R- versus Pten∆-tumors (P = 0.0048; Figure 3). These differences were not only seen when comparing Pten∆ to PIK3CAH1047R class14Ex tumors, but also when comparing Pten∆ to PIK3CAH1047R squamous-likeEx lesions (Figure 3B).
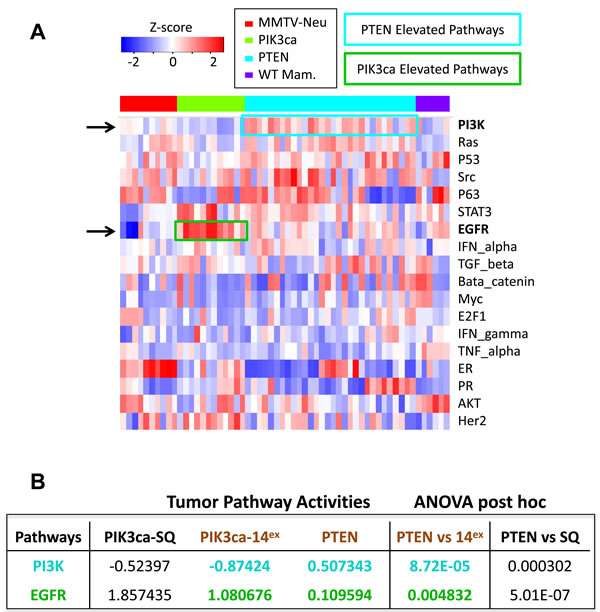
Figure 3: Pathway activity analysis of 18 oncogenic signalling in Pten∆ and PIK3CAH1047R-driven class14Ex tumors. A. Pathway activities of individual samples were calculated as described by Gatza et al. [11]. Heat map of the 18 signalling pathways in Pten∆ and PIK3CAH1047R-tumors as well as control normal mammary glands and MMTV-Her2/Neu tumors. The differentially expressed PI3K and EGFR pathways are highlighted. B. ANOVA with Tukey post hoc analysis of Pten∆ tumors and the 2 subtypes of PIK3CAH1047R tumors, revealing a significant increase in PI3K pathway signature in Pten∆ tumors, and a significant increase in EGFR signalling in PIK3CAH1047R tumors.
mRNA expression of secreted factors involved in EGFR signalling is similar in Pten∆ and PIK3CAH1047R-tumors
Multiple mechanisms may account for the observed differences in PI3K and EGFR signalling between Pten∆ and PIK3CAH1047R-tumors (Discussion). One possibility is suggested by a recent observation by the Arteaga group, that activating PIK3CA mutations (E545K and H1047R) in human breast cell lines alter expression of secreted proteins, cell surface receptors and ECM-interacting proteins leading to induction of EGFR signaling [12]. Of these proteins, 72 were detected in both E545K- and H1047R-over-expressing cell lines relative to controls (43 upregulated and 29 down-regulated), and a fraction of these were up- or down-regulated at the mRNA level [12]. We asked whether these genes are also similarly up- or down-regulated in Pten∆ tumors, or whether elevated autocrine/paracrine EGFR signalling is unique to PIK3CA-driven tumors. We therefore compared the expression of these genes in mouse Pten∆ versus PIK3CAH1047R-class14Ex mammary tumors. In the mouse data set, 13 genes were upregulated and 16 were downregulated in the same direction as the human PIK3CA-altered proteins. Remarkably, 12 of 13 upregulated genes in PIK3CAH1047R-tumors including integrins (ITGB4, ITGA2), laminins (LAMA3, LAMC2), FAT Tumor Suppressor Homolog 1, and peroxidasin (PXDN) were upregulated, and 9 of 16 were down-regulated in Pten∆ tumors, with overall correlation of 0.53 (P = 0.000295) (Figure 4). While proteomic analysis is required to confirm these observations, our results suggest that Pten loss may induce EGFR signalling as seen in human PIK3CA tumors, and therefore may not explain the differences between PIK3CA mutant and PTEN-deficient tumors.
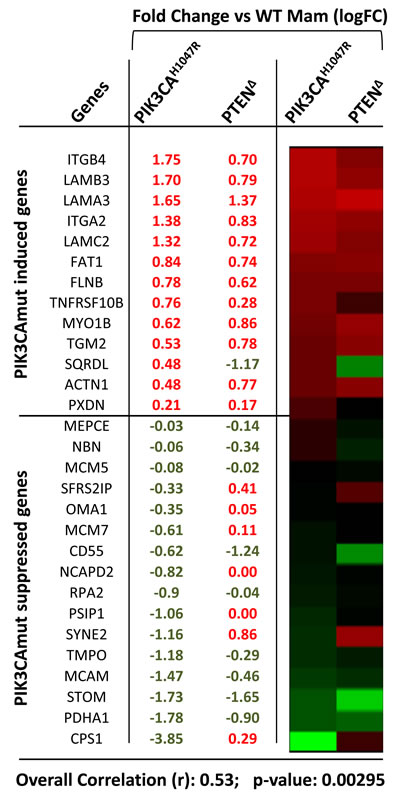
Figure 4: Relative expression (values and heat map) and correlation analysis of PI3KCA-regulated genes associated with EGFR activation in Pten∆ and PIK3CAH1047R mammary tumors.
DISCUSSION
We report that Pten-loss driven mammary tumors exhibit elevated PI3K pathway activity and reduced EGFR activity compared to PIK3CA mutant tumors. In concordance with these findings, a recent analysis of invasive lobular adenocarcinomas has demonstrated that PI3K/AKT signalling is more highly elevated in PTEN-deficient tumors than in PIK3CA mutants [13]. Thus, within closely related tumors driven by alterations in these genes, PTEN-loss has overtly distinct effects on cancer signalling compared to PI3K mutations. In contrast, analysis of divergent breast cancer cell lines revealed that mutations in PIK3CA but not PTEN loss coincide with increased sensitivity to mTOR inhibitors [2]. The latter report on the opposite differential sensitivity may reflect the different breast cancer subtypes in which PIK3CA mutations and PTEN loss usually occur (luminal vs. basal-like, respectively), and the effect of cooperating oncogenic signalling on PI3K/PKB-AKT/mTOR activity in the different subtypes of breast cancer. In contrast, both our results and the abovementioned study (Ref. [13]) analyzed the effects of PIK3CA mutations versus PTEN loss in closely related breast cancer subtypes, and the differences observed may truly reflect different effects these genes have on PI3K pathway activity.
A multitude of possibilities may underlie the observed differences in pathway activation. Likely, the differences reflect inherent differences in the effects of PTEN-loss vs PIK3CA mutation on breast epithelial cells. Indeed, while these proteins have opposing effects on phosphatidylinositol (3, 4, 5)-trisphosphate signaling, they also have additional unique functions. For example, PTEN can dephosphorylate certain proteins, and can enter and function within the nucleus in a phosphatase-independent manner or be secreted from cells to affect their neighbors [14-19]. A future challenge would be to define the unique functions of PIK3CA and PTEN underlying their differential affects on EGFR and PI3K signaling.
In conclusions, our results demonstrate that PIK3CAH1047R induces two molecularly distinct tumor subtypes: class14Ex, which is also induced by Pten-loss, and squamous-likeEx, which is uniquely induced by PIK3CAH1047R. Within the closely related Pten∆ and PIK3CAH1047R class14Ex tumors, GSEA analysis revealed that most enriched gene sets are shared by the two tumor types, yet, some differences were noted. Using pathway signature analysis of 18 oncogenic signalling, we found that PI3K and EGFR signalling were significantly different in Pten∆ vs. PIK3CAH1047R- tumors. These pathways may account for differences in drug sensitivity between Pten∆ vs. PIK3CAH1047R tumors [5]. The different response to therapy may also reflect different oncogenic events that cooperate with each gene, leading to distinct tumor subtypes in the course of cancer progression. The latter possibility is illustrated by squamous-likeEx tumors observed in PIK3CAH1047R but not Pten∆ lesions (Figure 1). Moreover, in human breast cancer, PTEN-loss is most frequent in basal-like breast cancer, whereas the spectrum of PI3K mutation is wider and most frequently observed in luminal tumors [20]. Therapeutic strategies should therefore be designed with the recognition that oncogenic signalling through PIK3CA-mutation and PTEN-loss are distinct, and should be based on comprehensive mutational analysis, tumor subtyping, identification of cooperating oncogenic events and ultimately direct assessment of tumor response to anti-PI3K/AKT/mTOR and anti-RAS/MAPK therapies.
Materials and Methods
Tumor samples and microarray analysis
Microarray analysis with PTEN∆ mouse tumor models (GSE39955) and wild-type mammary glands (GSE62016) were carried out using Affymetrix Mouse Gene 1.0 ST. Microarray data were normalized using RMA method via Partek software, and log2-transformed gene expression values were obtained. Normalized expression data for tumors with PIK3CAH1047R mutation and corresponding wild-type mammary glands were downloaded from GSE42640.
Molecular subtype classification
“Distance Weighted Discrimination” (DWD) was used to integrate data from the mouse models with a reference dataset containing human breast cancer subtypes pre-determined by PAM50 (GSE18229). Unsupervised hierarchical clustering (complete linkage) with the intrinsic genes signature (Herschkowitz et al, 2007) was used to group tumor samples for subtype classification.
Gene set enrichment analysis
Differential gene expressions comparing: 1) PIK3CAH1047R vs WT mammary glands; and 2) PTEN∆ vs WT mammary glands; were calculated by Moderate T test using limma package in R. Genes were ordered using the t-values corresponding to each pair-wise comparison as rank files for Gene Set Enrichment Analysis (GSEA, [21] with 1000 permutations and gene-sets size between 8 and 500. The gene-sets included in the GSEA analyses were obtained from KEGG, MsigDB-c2, NCI, Biocarta, IOB, Netpath, Human Cyc, Reactome and the Gene Ontology (GO) databases, updated March 2012 (http://baderlab.org/GeneSets). An enrichment map (version 1.2 of Enrichment Map software [22] was generated for each comparison using enriched gene-sets with a nominal p-value <0.05 and the overlap coefficient set to 0.5 as described [23, 24].
Pathway activities
Pathway activities of individual samples were calculated from microarray data as described [11], and normalized by z-score. Heat map was generated by the function heatmap.2 in gplots package in R. ANOVA with Tukey post hoc was used to determine the significance of differences between Pten∆ tumors and the 2 subtypes of PIK3CAH1047R tumors, squamous-like and class14EX.
Statistic analysis
Correlation analysis was performed comparing logFC (log2 of fold change) values of PIK3CAH1047R vs WT mammary glands with values of PTEN∆ vs WT mammary glands by the function corr.test in psych package in R that calculates both the correlation coefficient (r) and significance (p-value).
Acknowledgments
Funding for this project was provided by the Canadian Breast Cancer Foundation (CBCF, Ontario) and Canadian Cancer Society Research Institute (CCSRI) to EZ as well as the Terry Fox Foundation to SEE and EZ.
Conflicts of interest
The authors declare no conflict of interest.
REFERENCES
1. Cully M, You H, Levine AJ and Mak TW. Beyond PTEN mutations: the PI3K pathway as an integrator of multiple inputs during tumorigenesis. Nature reviews Cancer. 2006; 6:184-192.
2. Adams JR, Schachter NF, Liu JC, Zacksenhaus E and Egan SE. Elevated PI3K signaling drives multiple breast cancer subtypes. Oncotarget. 2011; 2:435-447. doi: 10.18632/oncotarget.285.
3. Davis NM, Sokolosky M, Stadelman K, Abrams SL, Libra M, Candido S, Nicoletti F, Polesel J, Maestro R, D’Assoro A, Drobot L, Rakus D, Gizak A, Laidler P, Dulinska-Litewka J, Basecke J, et al. Deregulation of the EGFR/PI3K/PTEN/Akt/mTORC1 pathway in breast cancer: possibilities for therapeutic intervention. Oncotarget. 2014; 5:4603-4650. doi: 10.18632/oncotarget.2209.
4. Yuan TL and Cantley LC. PI3K pathway alterations in cancer: variations on a theme. Oncogene. 2008; 27:5497-5510.
5. Weigelt B, Warne PH and Downward J. PIK3CA mutation, but not PTEN loss of function, determines the sensitivity of breast cancer cells to mTOR inhibitory drugs. Oncogene. 2011; 30:3222-3233.
6. Stambolic V. Cancer: Precise control of localized signals. Nature. 2015; 522:38-40.
7. Wheler JJ, Moulder SL, Naing A, Janku F, Piha-Paul SA, Falchook GS, Zinner R, Tsimberidou AM, Fu S, Hong DS, Atkins JT, Yelensky R, Stephens PJ and Kurzrock R. Anastrozole and everolimus in advanced gynecologic and breast malignancies: activity and molecular alterations in the PI3K/AKT/mTOR pathway. Oncotarget. 2014; 5:3029-3038. doi: 10.18632/oncotarget.1799.
8. Adams JR, Xu K, Liu JC, Agamez NM, Loch AJ, Wong RG, Wang W, Wright KL, Lane TF, Zacksenhaus E and Egan SE. Cooperation between Pik3ca and p53 mutations in mouse mammary tumor formation. Cancer research. 2011; 71:2706-2717.
9. Liu JC, Voisin V, Wang S, Wang DY, Jones RA, Datti A, Uehling D, Al-awar R, Egan SE, Bader GD, Tsao M, Mak TW and Zacksenhaus E. Combined deletion of Pten and p53 in mammary epithelium accelerates triple-negative breast cancer with dependency on eEF2K. EMBO molecular medicine. 2014; 6:1542-1560.
10. Pfefferle AD, Herschkowitz JI, Usary J, Harrell JC, Spike BT, Adams JR, Torres-Arzayus MI, Brown M, Egan SE, Wahl GM, Rosen JM and Perou CM. Transcriptomic classification of genetically engineered mouse models of breast cancer identifies human subtype counterparts. Genome biology. 2013; 14:R125.
11. Gatza ML, Lucas JE, Barry WT, Kim JW, Wang Q, Crawford MD, Datto MB, Kelley M, Mathey-Prevot B, Potti A and Nevins JR. A pathway-based classification of human breast cancer. Proc Natl Acad Sci U S A. 2010; 107:6994-6999.
12. Young CD, Zimmerman LJ, Hoshino D, Formisano L, Hanker AB, Gatza ML, Morrison MM, Moore PD, Whitwell CA, Dave B, Stricker T, Bhola NE, Silva GO, Patel P, Brantley-Sieders DM, Levin M, et al. Activating PIK3CA Mutations Induce an Epidermal Growth Factor Receptor (EGFR)/Extracellular Signal-regulated Kinase (ERK) Paracrine Signaling Axis in Basal-like Breast Cancer. Molecular & cellular proteomics. 2015; 14:1959-1976.
13. Ciriello G, Gatza ML, Beck AH, Wilkerson MD, Rhie SK, Pastore A, Zhang H, McLellan M, Yau C, Kandoth C, Bowlby R, Shen H, Hayat S, Fieldhouse R, Lester SC, Tse GM, et al. Comprehensive Molecular Portraits of Invasive Lobular Breast Cancer. Cell. 2015; 163:506-519.
14. Shi Y, Wang J, Chandarlapaty S, Cross J, Thompson C, Rosen N and Jiang X. PTEN is a protein tyrosine phosphatase for IRS1. Nature structural & molecular biology. 2014; 21:522-527.
15. Song MS, Salmena L and Pandolfi PP. The functions and regulation of the PTEN tumour suppressor. Nature reviews Molecular cell biology. 2012; 13:283-296.
16. Bassi C, Ho J, Srikumar T, Dowling RJ, Gorrini C, Miller SJ, Mak TW, Neel BG, Raught B and Stambolic V. Nuclear PTEN controls DNA repair and sensitivity to genotoxic stress. Science. 2013; 341:395-399.
17. Zhang S, Huang WC, Li P, Guo H, Poh SB, Brady SW, Xiong Y, Tseng LM, Li SH, Ding Z, Sahin AA, Esteva FJ, Hortobagyi GN and Yu D. Combating trastuzumab resistance by targeting SRC, a common node downstream of multiple resistance pathways. Nat Med. 2011; 17:461-469.
18. Song MS, Carracedo A, Salmena L, Song SJ, Egia A, Malumbres M and Pandolfi PP. Nuclear PTEN regulates the APC-CDH1 tumor-suppressive complex in a phosphatase-independent manner. Cell. 2011; 144:187-199.
19. Hopkins BD, Fine B, Steinbach N, Dendy M, Rapp Z, Shaw J, Pappas K, Yu JS, Hodakoski C, Mense S, Klein J, Pegno S, Sulis ML, Goldstein H, Amendolara B, Lei L, et al. A secreted PTEN phosphatase that enters cells to alter signaling and survival. Science. 2013; 341:399-402.
20. Network TCGA. Comprehensive molecular portraits of human breast tumours. Nature. 2012; 490:61-70.
21. Subramanian A, Tamayo P, Mootha VK, Mukherjee S, Ebert BL, Gillette MA, Paulovich A, Pomeroy SL, Golub TR, Lander ES and Mesirov JP. Gene set enrichment analysis: a knowledge-based approach for interpreting genome-wide expression profiles. Proc Natl Acad Sci U S A. 2005; 102:15545-15550.
22. Merico D, Isserlin R, Stueker O, Emili A and Bader GD. Enrichment map: a network-based method for gene-set enrichment visualization and interpretation. PLoS One. 2011; 5:e13984.
23. Liu JC, Egan SE and Zacksenhaus E. A Tumor initiating cell-enriched prognostic signature for HER2+:ERalpha- breast cancer; rationale, new features, controversies and future directions. Oncotarget. 2013; 4:1317-1328. doi: 10.18632/oncotarget.1170.
24. Liu JC, Voisin V, Bader GD, Deng T, Pusztai L, Symmans WF, Esteva FJ, Egan SE and Zacksenhaus E. Seventeen-gene signature from enriched Her2/Neu mammary tumor-initiating cells predicts clinical outcome for human HER2+:ERalpha- breast cancer. Proceedings of the National Academy of Sciences of the United States of America. 2012; 109:5832-5837.