
INTRODUCTION
Esophageal cancer (EC) is a leading cause of cancer-related death that is especially prevalent in China [1, 2]. Esophageal squamous cell carcinoma (ESCC) and esophageal adenocarcinoma (EA) are the two main types of esophageal carcinoma. However, in China, 90% of cases involve squamous cell carcinoma [2]. EC is difficult to cure unless it is diagnosed at a very early stage, before metastasis. The five-year survival rate of EC patients remains very poor despite rapid advances in surgical techniques and therapies [3, 4]. There is an urgent need to identify new molecular markers and independent risk factors that are associated with EC development and progression to improve diagnosis, prevention and treatment.
Long non-coding RNAs (lncRNAs) are non-coding RNAs of more than 200 nucleotides (nt) in length and are characterized by diverse and complex sequences and mechanisms of action [5]. Some studies using deep transcriptome sequencing and microarrays have shown that 70-90% of the human genome is estimated to be transcribed into non-protein-coding RNA [6]. Recent studies indicate that lncRNAs are involved in a variety of biological processes and diseases in humans [5–8]. Notably, some lncRNAs serve as pivotal regulators in the development and progression of EC [9–11]. However, the expression, function, and molecular mechanism of lncRNA, including lncRNA TP73-AS1, in EC remain unclear.
Ours is the first comprehensive analysis of lncRNA TP73-AS1 in EC. We utilized lncRNA microarrays to analyze the expression profile of lncRNAs in ESCC. We investigated the function of lncRNA TP73-AS1 in the proliferation and apoptosis of ESCC cell lines, and we evaluated the expression and relevance of lncRNA TP73-AS1 in clinical ESCC. The contribution of lncRNA TP73-AS1 to ESCC malignancy and the molecular mechanisms underlying its action were also investigated. Our findings demonstrate that lncRNA TP73-AS1 could be a potential prognostic marker and therapeutic target for the treatment of EC.
RESULTS
LncRNA TP73-AS1 is upregulated in ESCC
To identify unique genes involved in ESCC, lncRNA microarray analysis was performed using total RNA isolated from three ESCC tissue samples, and the corresponding adjacent normal esophageal tissues as the control. A fold change of >5.0 was set as the threshold for upregulated genes, and a fold change of <0.25 was set as the threshold for downregulated genes. The data were expressed as the mean ± SD. Relative to normal tissue, tumor tissue displayed differentially upregulated and downregulated lncRNAs (Figure 1A, Tables 1 & 2). We validated four lncRNAs microarray results using quantitative RT-PCR, including two upregulated lncRNAs (lncRNA TP73-AS1 and lncRNA LOC345051) and two downregulated lncRNAs (lncRNA XLOC_008700 and lncRNA TMEM71), in 60 pairs of primary ESCC tissues and their corresponding adjacent normal esophageal tissues. LncRNA TP73-AS1 and LOC345051 expression was significantly higher in ESCC tissues as compared to controls (P<0.05, Figure 1B & 1C), whereas that of lncRNA XLOC_008700 was significantly reduced (P<0.05, Figure 1D). No significant difference in the expression of lncRNA TMEM71 was observed (P>0.05, Figure 1E). A strong correlation between the results of quantitative RT-PCR and Agilent lncRNA microarray profiles was observed. Among the four lncRNAs examined, only the results for lncRNA TMEM71 did not match between the two methods (P>0.05).
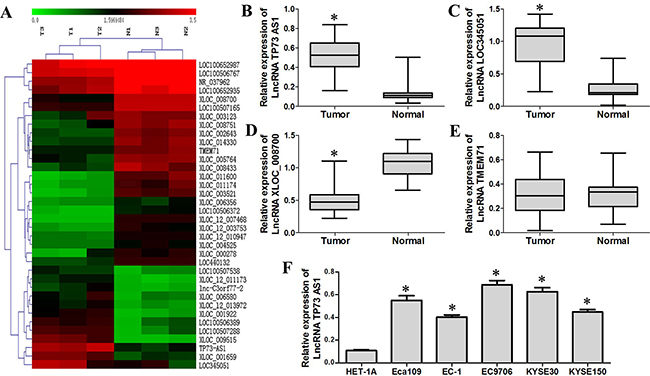
Figure 1: LncRNA TP73-AS1 is upregulated in EC. A. LncRNA microarray analysis was performed on total RNA isolated from three esophageal squamous cell carcinoma tissue samples and corresponding adjacent normal esophageal tissues. T: tumor, N: normal. B. & C. qRT-PCR results show that LncRNA TP73-AS1 and LOC345051 levles in EC tissues was increased as compared to adjacent non-cancerous tissues. D. LncRNA XLOC_008700 expression in EC tissues was decreased as compared to adjacent non-cancerous tissues E. No significant difference was observed for lncRNA TMEM71 between EC tissues and corresponding adjacent normal esophageal tissues F. LnRNA TP73-AS1 expression was generally upregulated in EC cell lines (Eca109, EC-1, EC9706, KYSE30 and KYSE150) compared with the normal esophageal cell line, HET-1A. (*P < 0.05)
Table 1: Important LncRNAs upregulated in esophageal cancer tissues
LncRNA Name (GeneSymbol) |
Regulation |
chr |
Foldchange |
|---|---|---|---|
LOC_009515 |
Up |
chr11 |
56.88932665 |
LOC100508287 |
Up |
chr19 |
50.65416524 |
XLOC_003940 |
Up |
chr4 |
33.61186757 |
LOC100507288 |
Up |
chr15 |
29.47021948 |
XLOC_l2_012175 |
Up |
chr5 |
28.404181 |
XLOC_008441 |
Up |
chr10 |
25.94510375 |
XLOC_001659 |
Up |
chr2 |
20.90140762 |
XLOC_008604 |
Up |
chr10 |
20.7259683 |
XLOC_l2_011327 |
Up |
chr4 |
19.56286412 |
XLOC_001922 |
Up |
chr2 |
18.0051049 |
LOC100506389 |
Up |
chr6 |
17.1631327 |
TP73-AS1 |
Up |
Chr1 |
15.43420213 |
XLOC_000984 |
Up |
chr1 |
14.26167571 |
XLOC_003457 |
Up |
chr4 |
11.30667087 |
LOC345051 |
Up |
chr4 |
10.8862842 |
LOC100505535 |
Up |
chr19 |
9.731238977 |
LOC100288728 |
Up |
chr17 |
8.323208628 |
XLOC_l2_011173 |
Up |
chr4 |
7.565944009 |
LOC100506791 |
Up |
chr5 |
7.066572332 |
XLOC_000768 |
Up |
chr1 |
6.62576346 |
XLOC_l2_013972 |
Up |
chr7 |
5.982766676 |
XLOC_006580 |
Up |
chr7 |
5.833858119 |
XLOC_013154 |
Up |
chr19 |
5.829168883 |
XLOC_012095 |
Up |
chr17 |
5.428283614 |
lnc-C3orf77-2 |
Up |
chr3 |
5.420727934 |
LOC100507118 |
Up |
chr15 |
5.176895871 |
XLOC_010348 |
Up |
chr13 |
5.161127603 |
LOC100507538 |
Up |
chr7 |
5.154945589 |
LOC100507546 |
Up |
chr5 |
5.078538224 |
Table 2: Important LncRNAs downregulated in esophageal cancer tissues
LncRNA Name (GeneSymbol) |
Regulation |
chr |
Foldchange |
|---|---|---|---|
XLOC_003057 |
Down |
chr3 |
0.249757395 |
LOC100652987 |
Down |
chr14 |
0.246677494 |
XLOC_013794 |
Down |
chr20 |
0.245043248 |
LOC100506965 |
Down |
chr15 |
0.244963091 |
XLOC_006356 |
Down |
chr7 |
0.243994579 |
LOC100506965 |
Down |
chr15 |
0.243475481 |
XLOC_l2_010555 |
Down |
chr4 |
0.240849695 |
XLOC_004525 |
Down |
chr5 |
0.23899544 |
XLOC_l2_009303 |
Down |
chr22 |
0.23479824 |
LOC100506948 |
Down |
chr15 |
0.231482655 |
LOC100506767 |
Down |
chr14 |
0.226170865 |
XLOC_010572 |
Down |
chr13 |
0.214910906 |
NR_033708 |
Down |
chr1 |
0.205847239 |
NR_037962 |
Down |
chr1 |
0.196268697 |
LOC100506948 |
Down |
chr15 |
0.193894798 |
XLOC_001508 |
Down |
chr2 |
0.193804544 |
LOC440132 |
Down |
chr13 |
0.170180059 |
XLOC_001699 |
Down |
chr2 |
0.169704767 |
LOC100652867 |
Down |
chr1 |
0.161978327 |
XLOC_l2_010947 |
Down |
chr4 |
0.15706701 |
XLOC_005910 |
Down |
chr6 |
0.154877739 |
LOC100506372 |
Down |
chr16 |
0.136250705 |
TMEM71 |
Down |
chr8 |
0.128252246 |
SDIM1 |
Down |
chr6 |
0.1267782 |
LINC00403 |
Down |
chr13 |
0.124328358 |
LOC100652935 |
Down |
chr10 |
0.121165174 |
XLOC_005530 |
Down |
chr6 |
0.118259755 |
XLOC_006734 |
Down |
chr8 |
0.113602855 |
LOC100507165 |
Down |
chr11 |
0.095550485 |
XLOC_007085 |
Down |
chr8 |
0.090350118 |
LOC100507008 |
Down |
chr10 |
0.078132901 |
XLOC_005764 |
Down |
chr6 |
0.071876751 |
XLOC_000625 |
Down |
chr1 |
0.067898838 |
XAGE-4 |
Down |
chrX |
0.065780332 |
XLOC_l2_003753 |
Down |
chr13 |
0.065250732 |
XLOC_011470 |
Down |
chr15 |
0.063513893 |
XLOC_l2_012023 |
Down |
chr5 |
0.062435021 |
XLOC_003123 |
Down |
chr3 |
0.062402559 |
LOC100507165 |
Down |
chr11 |
0.051852056 |
XLOC_008390 |
Down |
chr10 |
0.050919081 |
XLOC_l2_007468 |
Down |
chr2 |
0.050499374 |
XLOC_011174 |
Down |
chr15 |
0.049276821 |
XLOC_000278 |
Down |
chr1 |
0.049040072 |
XLOC_014330 |
Down |
chr22 |
0.04852727 |
XLOC_008700 |
Down |
chr10 |
0.047007051 |
XLOC_002643 |
Down |
chr3 |
0.04692143 |
XLOC_003786 |
Down |
chr4 |
0.046616316 |
XLOC_008795 |
Down |
chr10 |
0.046603541 |
XLOC_l2_000037 |
Down |
chr1 |
0.046006394 |
XLOC_004598 |
Down |
chr5 |
0.045762193 |
XLOC_008577 |
Down |
chr10 |
0.045365941 |
XLOC_006870 |
Down |
chr8 |
0.041676401 |
XLOC_000684 |
Down |
chr1 |
0.041671585 |
XLOC_l2_005988 |
Down |
chr17 |
0.038935609 |
XLOC_011603 |
Down |
chr15 |
0.037427881 |
XLOC_005036 |
Down |
chr5 |
0.036159627 |
XLOC_008751 |
Down |
chr10 |
0.035382596 |
XLOC_008433 |
Down |
chr10 |
0.03338041 |
XLOC_011600 |
Down |
chr15 |
0.030349173 |
XLOC_003521 |
Down |
chr4 |
0.025289366 |
We selected lncRNA TP73-AS1 located at 1p36.32 as our subsequent study candidate because of its high levels and similar expression patterns in different clinical specimens. We further examined lncRNA TP73-AS1 expression in the normal esophageal cell line, HET-1A, and EC cell lines Eca109, EC-1, EC9706, KYSE30 and KYSE150. LncRNA TP73-AS1 expression was generally upregulated in EC cell lines (Eca109, EC-1, EC9706, KYSE30, and KYSE150) (Figure 1F).
LncRNA TP73-AS1 knockdown inhibits ESCC proliferation and induces apoptosis
Higher lncRNA TP73-AS1 levels in both EC tissues and cell lines as compared to non-cancer controls suggested that lncRNA TP73-AS1 might play an important role in EC tumorigenesis. We designed lncRNATP73-AS1 siRNA1 and siRNA2, which we transfected into EC9706 and KYSE30 cells using a recombinant lentivirus. qRT-PCR analysis showed that transfection of lncRNATP73-AS1 siRNA1 or siRNA2 into EC9706 and KYSE30 cells reduced lncRNA TP73-AS1 levels (Figure 2A). CCK-8 and colony formation assay were utilized to evaluate cell proliferation. The results showed that 24, 48 and 72 hours after transfection, EC9706 (Figure 2B) and KYSE30 cells (Figure 2C) that received lncRNATP73-AS1 siRNA1 or siRNA2 had reduced proliferation rates as compared to un-transfected (Blank) and nonsense siRNA transfected (NC) cells. LncRNATP73-AS1 siRNA also clearly suppressed colony formation (Figure 2D).
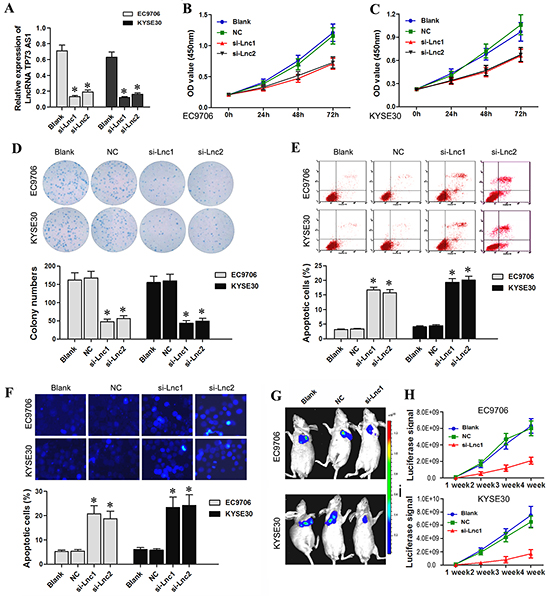
Figure 2: LncRNA TP73-AS1 siRNA inhibits EC cell proliferation and induces apoptosis. A. qRT-PCR results showed that LncRNA TP73-AS1 expression was downregulated in EC9706 and KYSE30 cells transfected with lncRNA TP73-AS1 siRNA1 or siRNA2. B. As measured by CCK-8 assay, statistically significant decrease in EC9706 cell proliferation in the si-lnc1 and si-lnc2 groups was observed compared to the blank and NC groups C. A statistically significant decrease in KYSE30 cell proliferation in the si-lnc1 and si-lnc2 groups was observed. D. LncRNA TP73-AS1 siRNA1 or siRNA2 transfection of EC9706 and KYSE30 cells reduced colony formation. E. LncRNA TP73-AS1 siRNA induces EC9706 and KYSE30 apoptosis as assessed by flow cytometry. F. Hoechst 33342 staining showed that lncRNA TP73-AS1 siRNA1 or siRNA2 transfection led to a significant increase in EC9706 and KYSE30 cell apoptosis. G. LncRNATP73-AS1 siRNA attenuates the proliferation of EC cells in vivo. Tumor size was significantly lower in si-Lnc1 nude mice as compared to control mice H. Luciferase signal was significantly lower in si-Lnc1 nude mice as compared to control mice. Blank: un-transfected cells. NC: cells were transfected with nonsense siRNA. si-Lnc1: cells were transfected with lncRNATP73-AS1 siRNA1. si-Lnc2: cells were transfected with lncRNATP73-AS1 siRNA2. *P<0.05 compared to the control group.
We also examined apoptosis with flow cytometry using the FITC Annexin V Apoptosis Detection Kit I (BestBio, Shanghai, China). The results showed that the number of early and late apoptotic cells at 48–96 hours post-siRNA-transfection was significantly higher in EC9706 and KYSE30 cells (Figure 2E) compared to controls. LncRNA TP73-AS1 knockdown also clearly induced apoptosis in EC9706 and KYSE30 cells as indicated by the Hoechst 33342 staining assay (Figure 2F).
To confirm the growth inhibitory effect of lncRNATP73-AS1 siRNA on EC in vivo, a xenograft tumor growth assay was performed. Tumor size and luciferase signal were significantly reduced in the lncRNATP73-AS1 siRNA mice group (EC9706 and KYSE30 cells transfected with lncRNATP73-AS1 siRNA1) as compared to control mice (NC and Blank groups) at the fourth week (P<0.05, Figure 2G & 2H). Our results showed that downregulation of lncRNA TP73-AS1 attenuated EC cell proliferation both in vitro and in vivo.
LncRNA TP73-AS1 knockdown inhibits BDH2 expression in EC9706 and KYSE30 cells
To explore the molecular mechanisms of lncRNA TP73-AS1 in tumorigenesis, mRNA microarray analysis was performed using EC9706 and KYSE30 cells transfected with lncRNATP73-AS1 siRNA or nonsense siRNA. BDH2 expression was significantly decreased in EC9706 and KYSE30 cells transfected with lncRNATP73-AS1 siRNA compared to the control (P<0.05; Figure 3A).
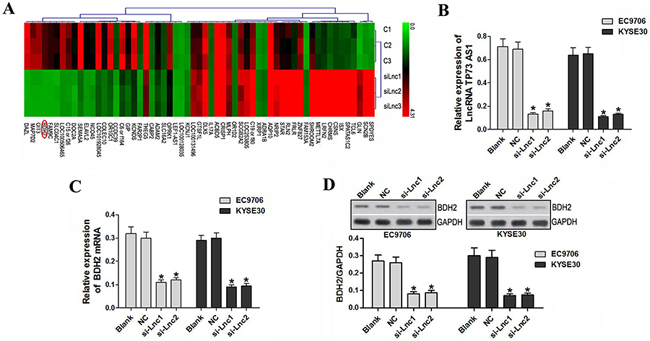
Figure 3: LncRNA TP73-AS1 knockdown inhibited BDH2 expression. A. mRNA microarray analysis was performed using EC9706 and KYSE30 cells transfected with lncRNATP73-AS1 siRNA and nonsense siRNA. C1: EC9706 transfected with nonsense siRNA; C2: EC9706 transfected with nonsense siRNA; C3: KYSE30 transfected with nonsense siRNA; siLnc1: EC9706 transfected with lncRNATP73-AS1 siRNA1; siLnc2: EC9706 transfected with lncRNATP73-AS1 siRNA2; siLnc3: KYSE30 transfected with lncRNATP73-AS1 siRNA1. B. qRT-PCR results show that lncRNA TP73-AS1 expression was downregulated in EC9706 and KYSE30 cells transfected with lncRNATP73-AS1 siRNA1 or siRNA2. C. BDH2 expression was also decreased in lncRNATP73-AS1 siRNA1 and siRNA2 transfected cells. D. Western blot analysis showed that BDH2 protein was reduced in lncRNATP73-AS1 siRNA1 or siRNA2-transfected cells. (*P<0.05). Blank: un-transfected cells. NC: cells were transfected with nonsense siRNA. si-Lnc1: cells were transfected with lncRNATP73-AS1 siRNA1. si-Lnc2: cells were transfected with lncRNATP73-AS1 siRNA2. *P<0.05 compared to the control group.
BDH2 is a novel cytosolic-type 2-hydroxybutyrate dehydrogenase that plays a pivotal role in the utilization of cytosolic ketone bodies in the mitochondria, as well as the tricarboxylic acid cycle [12]. Guo, et al. identified BDH2 as a short-chain dehydrogenase/reductase family member, originally named DHRS6 [12]. Yang, et al. reported that BDH2 overexpression reduces overall survival and decreases patient response to intensive induction chemotherapy. Furthermore, the mechanism by which BDH2 works as an anti-apoptotic factor is mediated by survivin via the caspase-3 independent pathway [13].
To verify the effect of lncRNATP73-AS1 siRNA on BDH2, lncRNA TP73-AS1 (Figure 3B) and BDH2 mRNA levels were measured in EC9706 and KYSE30 cells by qRT-PCR. BDH2 expression was reduced in lncRNA TP73-AS1 siRNA1- or siRNA2-transfected cells (P<0.05; Figure 3C). Western blot analysis showed that the BDH2 protein levels were also significantly reduced (P<0.05; Figure 3D) in siRNA-transfected cells.
BDH2 knockdown inhibits EC cell proliferation and induces apoptosis
BDH2 protein and mRNA levels were significantly decreased in BDH2 siRNA1- or siRNA2-transfected EC9706 and KYSE30 cells as compared to controls (Figure 4A). CCK-8 assay results showed that at 24, 48 and 72 h hours post-transfection, BDH2 siRNA-transfected cells exhibited significantly reduced proliferation (Figure 4B & 4C). These results suggested that BDH2 might function as a tumor suppressor in EC cells in vitro.
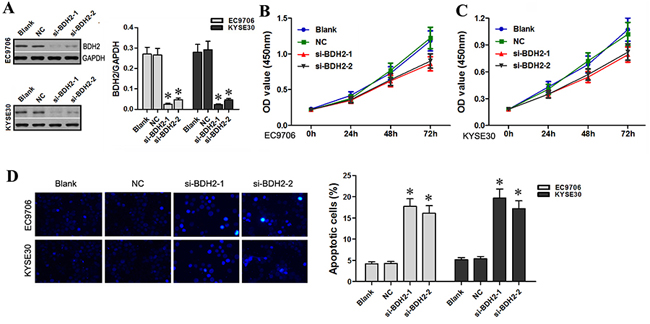
Figure 4: BDH2 knockdown inhibits EC cell proliferation and induces apoptosis. A. Western blot and qRT-PCR analyses showed that protein and mRNA levels of BDH2 were lower in BDH2 siRNA1 or siRNA2 transfected EC9706 and KYSE30 cells. B. & C. As measured by CCK-8 assay, decreased EC9706 and KYSE30 cell proliferation was observed in BDH2 siRNA1 or siRNA2 transfected cells. D. Hoechst 33342 staining assay showed that BDH2 siRNA induced apoptosis in EC9706 and KYSE30 cells (*P<0.05). Blank: un-transfected cells. NC: cells were transfected with nonsense siRNA. si-BDH2-1: cells were transfected with BDH2 siRNA1. si-BDH2-2: cells were transfected with BDH2 siRNA2. *P<0.05 compared to the control group.
Next, we evaluated apoptosis using Hoechst 33342 staining. The number of apoptotic cells post-BDH2 siRNA transfection significantly increased in EC9706 and KYSE30 cells as compared to controls (Figure 4D). These results suggest that BDH2 knockdown inhibits EC cell proliferation and induces apoptosis, which is similar to the effects of lncRNA TP73-AS1 siRNA on EC cells. The results of our study are in agreement with the findings of Yang, et al. that BDH2 works as an anti-apoptotic factor [13].
BDH2 or lncRNA TP73-AS1 knockdown activates apoptosis protein expression and enhances chemosensitivity to 5-FU and cisplatin
We have shown that both BDH2 siRNA and lncRNATP73-AS1 siRNA induce apoptosis. To explore the molecular mechanisms involved, we transfected EC9706 and KYSE30 cells with lncRNATP73-AS1 siRNA1 or BDH2 siRNA1. Western blot was used to confirm expression of related proteins. BDH2 expression significantly decreased in EC9706 and KYSE30 cells after BDH2 siRNA1 or lncRNATP73-AS1 siRNA1 transfection (Figure 5A & 5B).Levels of cleaved caspase-3 and cleaved caspase-9 proteins were enhanced in BDH2 siRNA1 or lncRNATP73-AS1 siRNA1-transfected cells. However, levels of Bcl-2, Bax and pro-caspase-9 were not significantly different following transfection (Figure 5A & 5B).
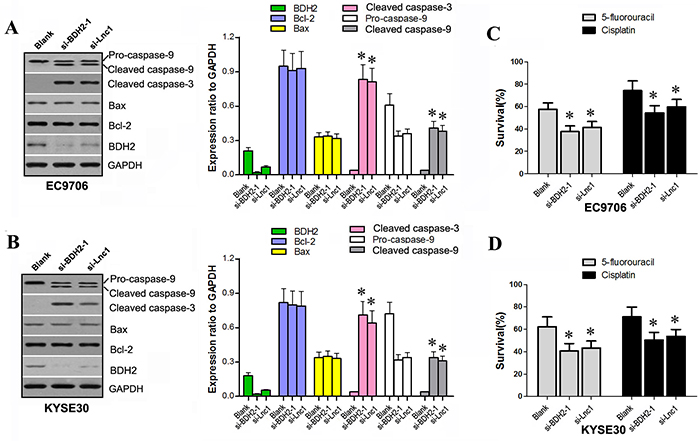
Figure 5: BDH2 or lncRNA TP73-AS1 knockdown activates apoptosis protein expression and enhances chemo-sensitivity to 5-FU or cisplatin in EC cells. A. & B. Western blot analysis showed that BDH2 or lncRNATP73-AS1 knockdown enhanced expression of cleaved caspase-3 and cleaved caspase-9 in EC9706 and KYSE30 cells. C. & D. Knockdown of BDH2 or lncRNA TP73-AS1 also enhanced chemo-sensitivity to 5-FU or cisplatin in EC9706 and KYSE30 cells. (*P<0.05). Blank: un-transfected cells. si-BDH2-1: cells were transfected with BDH2 siRNA1. si-Lnc1: cells were transfected with lncRNATP73-AS1 siRNA1.
Previous studies have described two distinct but convergent pathways that initiate apoptotic responses: the death receptors and mitochondrial pathways [14–16]. The mitochondrial apoptosis pathway is regulated by caspase-9 [15–19]. Initiators of caspase-9 ultimately lead to increased mitochondrial permeability, thereby facilitating the release of cytochrome c (Cyt-c) from the inter-mitochondrial membrane space into the cytosol [20–22]. Cyt-c in turn activates caspase-9 through the apoptosome, triggering the activation of caspase-3, thereby resulting in apoptosis. Therefore, both activated caspase-8 (death receptor pathway) and caspase-9 (mitochondrial pathway) mobilize caspase-3 (the key executioner caspase), which in turn causes cellular apoptosis [23–25]. Our results suggest that BDH2 siRNA and lncRNATP73-AS1 siRNA induce apoptosis via a caspase-3 dependent pathway. Apoptosis likely contributes to inhibition of growth in BDH2 or lncRNA TP73-AS1 knockdown EC cells.
To determine the effect of BDH2 siRNA and lncRNATP73-AS1 siRNA on ESCC cells sensitivity to the chemotherapeutics, 5-FU and cisplatin, cell survival rates were measured. Transfection of EC9706 and KYSE30 cells with BDH2 siRNA1 or lncRNATP73-AS1 siRNA1 resulted in decreased cell survive rates following treatment with 5-FU or cisplatin (P<0.05; Figure 5C & 5D). Therefore, knockdown of BDH2 or lncRNATP73-AS1 enhanced the chemosensitivity of EC cells to 5-FU and cisplatin.
BDH2 overexpression partially rescues proliferation rates and suppresses apoptosis in lncRNATP73-AS1 downregulated cells
We constructed the expression vector, pcDNA3.1-BDH2, which we then transfected into EC9706 and KYSE30 cells. Western blot analysis showed that transfection increased BDH2 expression (Figure 6A).
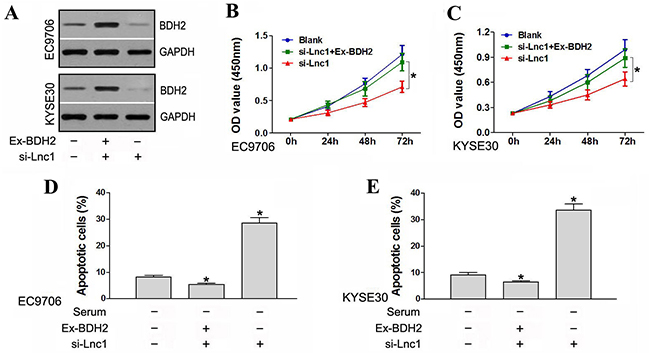
Figure 6: BDH2 overexpression partially rescued cell proliferation and suppressed apoptosis in lncRNA TP73-AS1 downregulated cells. A. Transfection with pcDNA3.1-BDH2 increased BDH2 expression. Ex-BDH2: pcDNA3.1-BDH2. si-Lnc1: lncRNATP73-AS1 siRNA1. B. & C. BDH2 overexpression partially rescued proliferation rates in lncRNATP73-AS1 downregulated EC9706 and KYSE30 cells. Blank: un-transfected cells. si-Lnc1: cells were transfected with lncRNATP73-AS1 siRNA1. si-Lnc1+Ex-BDH2: cells were transfected with lncRNATP73-AS1 siRNA1 and pcDNA3.1-BDH2. D. & E. BDH2 overexpression suppresed apoptosis in lncRNA TP73-AS1 downregulated EC9706 and KYSE30 cells. (*P<0.05).
A CCK-8 assay was conducted to evaluate cell proliferative capacity. LncRNATP73-AS1 siRNA1-transfected cells again exhibited a reduced proliferation rate as compared to controls. However, when lncRNATP73-AS1 downregulated cells were co-transfected with pcDNA3.1-BDH2, overexpression of BDH2 was found to partly rescue proliferation rates (Figure 6B & 6C). Apoptosis assays indicated that lncRNA TP73-AS1 knockdown increased apoptosis induced by serum starvation in EC9706 and KYSE30 cells. However, co-transfection with pcDNA3.1-BDH2 suppressed apoptosis in lncRNA TP73-AS1 downregulated cells (Figure 6D & 6E). Thus, BDH2 overexpression partially rescued proliferation rates and suppressed apoptosis in lncRNA TP73-AS1 downregulated cells.
LncRNATP73-AS1 and BDH2 expression are related to EC TNM stage
To study BDH2 and lncRNA TP73-AS1 levels in EC tissues, western blot and real-time PCR analyses were conducted in 60 primary EC tissues and 60 normal esophageal tissues adjacent to tumors. The relationship between lncRNATP73-AS1 and BDH2 levels and clinicopathologic characteristics in EC patients is summarized in Table 3. LncRNA TP73-AS1 and BDH2 levels were significantly upregulated in EC tissues (Figure 7A, 7D & 7E).
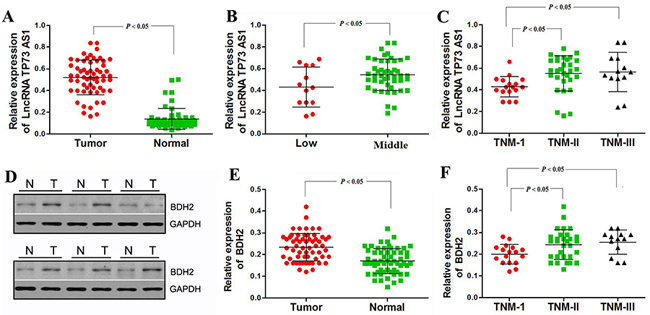
Figure 7: LncRNA TP73-AS1 and BDH2 expression correlate with TNM stage in EC. A. As shown by real-time PCR analysis, relative expression of lncRNA TP73-AS1 was significantly upregulated in EC tissues. B. Relative expression of lncRNA TP73-AS1 was downregulated in low tumor locations. C. LncRNA TP73-AS1 expression was lower in TNM stage I tumors. D. Western blot analysis showed that BDH2 protein was significantly upregulated in EC tissues. E. Real-time PCR analysis showed that BDH2 mRNA was upregulated in EC tissues. F. BDH2 expression was lower in TNM stage I tumors.
Table 3: Expression of LncRNA and BDH2 in ESCC cases
Parameter |
n |
LncRNA |
BDH2 |
||
|---|---|---|---|---|---|
Expression level |
P value |
Expression level |
P value |
||
Gender |
|||||
Male |
39 |
0.53±0.179 |
0.611 |
0.23±0.068 |
0.390 |
Female |
21 |
0.51±0.118 |
0.24±0.053 |
||
Age(years) |
|||||
<60 |
21 |
0.49±0.171 |
0.297 |
0.23±0.066 |
0.941 |
≥60 |
39 |
0.54±0.153 |
0.23±0.63 |
||
Location |
|||||
Low |
13 |
0.43±0.183 |
0.022* |
0.23±0.066 |
0.609 |
Middle |
47 |
0.54±0.145 |
0.24±0.062 |
||
Differentiation |
|||||
Well |
17 |
0.50±0.181 |
0.760 |
0.24±0.071 |
0.799 |
Moderate |
32 |
0.52±0.135 |
0.23±0.060 |
||
Poor |
11 |
0.55±0.199 |
0.24±0.064 |
||
TNM stage |
|||||
I |
17 |
0.43±0.095 |
0.017* |
0.20±0.045 |
0.024* |
II |
30 |
0.52±0.163 |
0.24±0.069 |
||
III |
13 |
0.57±0.181 |
0.26±0.061 |
||
Lymph node metastasis |
|||||
Negative |
40 |
0.51±0.161 |
0.430 |
0.23±0.063 |
0.977 |
Positive |
20 |
0.54±0.158 |
0.23±0.065 |
||
*Indicated statistical significance (P<0.05)
LncRNA TP73-AS1 expression was also strongly correlated with tumor location and TNM stage, but not with gender, age, differentiation or lymph metastasis (Table 3). BDH2 expression was strongly correlated to TNM stage only. LncRNA TP73-AS1 expression was lower in low EC locations and during stage I, whereas middle EC locations and stages II–III exhibited higher levels, which were indicative of a significant correlation between lncRNA TP73-AS1 level and clinicopathologic stage (Figure 7B & 7C, Table 3). Similarly, BDH2 expression was lower during stage I, whereas stages II–III showed higher levels, indicating a correlation between BDH2 expression and TNM stage (Figure 7F, Table 3). These results provide strong evidence that lncRNA TP73-AS1 and BDH2 expression are closely related to the TNM stage of EC.
DISCUSSION
In recent years, there has been rapid progress in both the experimental technologies and computational prediction algorithms for lncRNA discovery. So far 58,648 lncRNA genes have been identified [26, 27]. Current studies have shown that lncRNAs play key roles in diverse biological processes such as embryonic development, cell growth and tumorigenesis by regulating gene expression at the transcriptional and post-transcriptional levels [28–34]. LncRNA TP73-AS1 is located on human chromosomal band 1p36.32. TP73-AS1 is the antisense of the coding gene TP73, which encodes a product that shares structural and functional characteristics with TP53 [35]. Global genomic analysis has shown that up to 70% of protein-coding transcripts have antisense partners, and the perturbation of the antisense RNA alters the expression of the sense gene [36]. TP73-AS1 covers substantial portions of TP73, suggesting that TP73-AS1 may function by posttranscriptional regulation of TP73 gene expression [37]. To the best of our knowledge, information on lncRNA TP73-AS1 in ESCC is still limited.
Our study serves as the first comprehensive analysis of lncRNA TP73-AS1 in EC. We selected lncRNA TP73-AS1 as the target gene based on lncRNA profiles, and then designed lncRNA TP73-AS1 siRNA to block TP73-AS1 expression, and thus attenuate proliferation and invasion of ESCC. We found that lncRNA TP73-AS1 siRNA inhibits EC cell proliferation and induces cell apoptosis by regulating BDH2. Our results also suggest that downregulation of lncRNA TP73-AS1 and BDH2 induced apoptosis via a caspase-3 dependent pathway. These results are in agreement with the findings of Yang, et al. that BDH2 works as an anti-apoptotic factor [13]. It is also possible that there are other factors that could contribute to the regulation of this protein. Yu, et al. reported that lnRNA TP73-AS1 is significantly downregulated in non-small cell lung cancer as compared to normal lung tissues (P<0.001), but it is strongly upregulated in large-cell carcinoma specimens compared to adenocarcinoma, small-cell lung cancer and squamous cell carcinoma tissues [37]. These findings indicate that lnRNA TP73-AS1 may play an important role in the development and progression of various tumors.
Our results demonstrated that lncRNA TP73-AS1 could be a novel prognostic biomarker and a potential target for the treatment of EC. In ESCC, altered expression of lncRNAs has previously been reported. Guifeng Wei, et al. identified the potential tumor suppressor lncRNA Epist in ESCC, and provided a basis for future efforts to identify functional lncRNAs for therapeutic targeting [38]. Zhang X, et al. provided the first evidence that there is correlation between CCAT2 expression and poor survival in ESCC [39]. These studies indicate that deregulation of lncRNAs may promote ESCC carcinogenesis.
Caspase activation plays a central role in cell apoptosis. Caspase-3 and caspase-9 are the most frequently activated cell death proteases, and catalyze the specific cleavage of various key cellular proteins [24]. Our western blot assay showed that cleaved caspase-3 and cleaved caspase-9 protein levels were enhanced in BDH2 and lncRNA TP73-AS1 knockdown cell lines, respectively. However, expression of Bcl-2, Bax and pro-caspase-9 did not significantly differ following siRNA transfection. We inferred that knockdown of lncRNA TP73-AS1 or BDH2 induced cell apoptosis via a caspase-3 dependent apoptosis pathway.
Previous reports have described response rates ranging from 25% to 60% for chemotherapy in the treatment of solid tumors, in particular those of the head and neck [40–43]. Preoperative chemotherapy using cisplatin or 5-FU in combination with radiation therapy has also been used for the treatment of ESCC. Cisplatin and 5-FU are thought to induce radiosensitization in these tumors [37]. We found that BDH2 or lncRNA TP73-AS1 knockdown enhanced chemosensitivity to 5-FU or cisplatin in EC cells.
In summary, our study serves as a first comprehensive analysis of lncRNA TP73-AS1 function in EC, and provides strong evidence that lncRNA TP73-AS1 may be a novel prognostic biomarker and a potential therapeutic target for the treatment of EC.
MATERIALS AND METHODS
Patients and tissue samples
Sixty primary esophageal squamous cell cancer tissue samples and the adjacent normal esophageal tissues were collected. All samples were obtained from patients who were treated at the First Affiliated Hospital of Zhengzhou University and the Henan Tumor Hospital of Zhengzhou University in Zhengzhou, China between 2010 and 2013. The age distribution of patients was 63.2 ± 7.2 years. After the frozen specimens were stained with hematoxylin and eosin and examined by surgical pathologists, they were then snap frozen in liquid nitrogen. Normal esophageal tissues adjacent to the tumors were used as controls. None of the cancer patients in the present study had received preoperative radiation or chemotherapy. Informed consent was obtained from each of the patients. The Research Ethics Committee of Zhengzhou University approved the present study.
LncRNA expression microarray analysis
Three pairs of primary ESCC tissues and corresponding adjacent normal esophageal tissues were analyzed by lncRNA microarray analysis (SurePrint Human Gene Expression Microarray Kit, Agilent Technologies, Santa Clara, CA, USA). Microarray analysis was performed using 5 μg of total RNA extracted from histologically confirmed cancer and corresponding adjacent normal tissues. The BROAD Institute database was used in the development of the array. After hybridization and washing, processed slides were scanned with an Agilent Microarray Scanner (Agilent Technologies, Santa Clara, CA, USA). Raw data were extracted as pair files using the Feature Extraction software 10.7 (Agilent Technologies). The data were expressed as the mean ± SD. Raw data were normalized using a Quantile algorithm provided by Gene Spring Software 11.0 (Agilent Technologies).
Cell culture
The human esophageal cell line, HET-1A, and EC cell lines Eca109, EC-1, EC9706, KYSE30 and KYSE150 were purchased from the Type Culture Collection of the Chinese Academy of Sciences (Shanghai, China). The cell lines were cultured in RPMI-1640 medium supplemented with 10% fetal bovine serum (FBS, Gibco, Australia), 100 U/mL penicillin, and 50 μg/mL streptomycin, and were kept in incubators with humidified atmospheres of 5% CO2 and 95% air at 37°C.
Lentiviral constructs and transfections
Recombinant lentiviral vectors carrying lncRNA TP73-AS1 siRNA1, TP73-AS1 siRNA2, BDH2 siRNA1 or BDH2 siRNA2 were constructed with standard molecular techniques. EC9706 and KYSE30 cells were infected with the recombinant lentivirus to generate stably transfected cells. Concentrated lentiviruses were transfected at a multiplicity of infection (MOI) of 40 in RPMI-1640 without FBS. The supernatant was replaced with complete culture medium after 24 hours. The expression of lncRNA TP73-AS1 and BDH2 in infected cells was validated by quantitative real-time polymerase chain reaction (qRT-PCR). LncRNA TP73-AS1 and BDH2 siRNA sequences are in Supplementary Table S1.
qRT-PCR
Total RNA was extracted from EC tissue samples and adjacent non-tumor tissue samples using the TRIzol reagent (Invitrogen, Carlsbad, CA, USA), according to the manufacturer’s instructions. Approximately 1 μg of RNA was used to synthesize cDNA. The expression levels of BDH2 and lncRNA TP73-AS1 were determined by qPCR (ABI 7500fast system, Applied Biosystems, CA, USA), using GAPDH as the endogenous control. qRT-PCR results were expressed relative to the ratio of lncRNA TP73-AS1 or BDH2 and GAPDH expression. The forward and reverse primer sequences for LnRNATP73-AS1 are 5′ CCGGTTTTCCAGTTCT TGCAC 3′ and 5′GCCTCACAGGGAAACTTCATGC3′, respectively. For BDH2: forward 5′ TTCCAGCGTCAAAGGAGTTGT 3′, reverse 5′ TTCCTGGGCA CACACAGTTG 3′.
Western blot analysis
Total protein was extracted from the cells using RIPA buffer containing phenylmethanesulfonylfluoride (PMSF). Total protein concentrations were measured by using a BCA Protein Assay Kit (Pierce, Rockford, IL). Thirty μg of the protein lysate was subjected to sodium dodecyl sulfate-polyacrylamide gel electrophoresis (SDS-PAGE) and transferred onto PVDF membranes. The PVDF membranes were blocked with 5% BSA in 0.05% Tween 20-TBS for 1 hour and incubated with the corresponding primary antibody diluted in blocking buffer overnight at 4°C. Dilutions for primary antibodies were as follows: anti-BDH2 (1:1,000, Santa Cruz Biotech, Dallas, TX, USA), anti-BCL-2 (1:400, Santa Cruz Biotech), anti-BAX (1:1,000, Santa Cruz Biotech), anti-cleaved-caspase-9 (1:1,000, Santa Cruz Biotech), anti-pro-caspase-9 (1:1000, Santa Cruz Biotech), and anti-cleaved caspase-3 (1:1,000, Santa Cruz Biotech). After extensive washing with TBST, anti-rabbit IgG-HRP secondary antibody (1:5,000, Santa Cruz Biotech) was added. Signals were determined using a chemiluminescence detection kit (Amersham Pharmacia Biotech, Piscataway, NJ, USA).
Cell proliferation assay
Esophageal cancer cells were transferred into 96-wells plates at a density of 1×10⁴ cells/well, with five replicate wells per group. The relative number of viable cells was detected using Cell Counting Kit-8 reagents (CCK-8; Dojindo, Japan) at 0, 24, 48 and 72 hours. Results were recorded using a microplate reader (Elx800; BioTek, VT, USA) at a wavelength of 450 nm. Experiments were conducted in triplicate.
Colony formation assay
ESCC cells were seeded and transfected with lncRNA TP73-AS1. Cells were suspended in RPMI-1640 containing 0.35% low-melting agarose and plated onto 0.6% agarose in six-well culture plates at a density of 1×10⁵ cells per dish. The plates were incubated for two weeks at 37°C in a 5% CO2 incubator, and the number of colonies was counted after staining with 0.1% crystal violet solution. Colonies with more than 50 cells were manually counted. Experiments were done in triplicate.
Flow cytometry
Cell apoptosis was detected by flow cytometry. Human EC cells were harvested at 48 hours post-transfection by trypsinization. Tumor cells were resuspended in binding buffer at a density of 1×10⁶ cells/mL. After double-staining with FITC-Annexin V and propidium iodide (PI) using the FITC Annexin V Apoptosis Detection Kit I (BestBio, Shanghai, China), the cells were analyzed using a FACScan® flow cytometer equipped with Cell Quest software (BD Biosciences, San Jose, CA, USA) according to manufacturer’s instructions. Experiments were performed in triplicate.
Hoechst 33342 staining
EC9706 and KYSE30 cells were treated with different concentrations of a1-PDX for 48 hours, washed twice with cold PBS, and then incubated in the dark in 5 μL of Hoechst/PI staining buffer for 15 min at 25°C. Images were captured under a microscope with a digital camera. For quantification of Hoechst 33342 staining, the percentage of Hoechst-positive nuclei per optical field (at least 50 fields) was calculated. Experiments were performed in triplicate.
In vivo tumor growth assay
6-week-old female BALB/c nude mice were purchased from Henan Experimental Animals Centre Zhengzhou, China. EC9706 and KYSE30 cells were stably transfected with luciferase. The mice were randomly divided into three groups for each cell line, and each group consisted of five mice. Group si-lnc1: cells were transfected with lncRNATP73-AS1 siRNA1; Group NC: cells were transfected with nonsense siRNA; Group Blank: un-transfected cells. EC9706 and KYSE30 cells transfected with lncRNA TP73-AS1 siRNA1 were injected subcutaneously at 5×10⁷ cells. At 7, 14, 21, or 28 days, mice were injected intraperitoneally with D-luciferin (150 mg/kg) and analyzed using the Xenogen-IVIS Imaging System. The luciferase area of the xenograft tumor was defined as the region of interest (ROI), and the total signal in the ROI was quantified using the software, Living Image 3D (Xenogen). The Zhengzhou University Animal Care and Use Committee approved these protocols.
Statistical analyses
All statistical analyses were performed using the SPSS 17.0 software. A student’s t-test or one-way ANOVA was conducted for normally distributed data. Pearson Χ2 test was used to determine the correlation between lncRNA TP73-AS1 and BDH2 expression and the clinicopathologic features of patients. All data were expressed as the mean ± SD. Statistical significance was set at P<0.05.
CONFLICTS OF INTEREST
The authors have declared that no competing interest exists.
GRANT SUPPORT
This study was supported by the National Natural Science Foundation of China (81272188; 81301726).
REFERENCES
1. Torre LA, Bray F, Siegel RL, Ferlay J, Lortet-Tieulent J, Jemal A. Global cancer statistics. 2012. CA Cancer J Clin. 2015; 65: 87-108.
2. Chen W, Zheng R, Zeng H, Zhang S, He J. Annual report on status of cancer in China. 2011. Chin J Cancer Res. 2015; 27: 2-12.
3. Rustgi AK,El-Serag HB. Esophageal carcinoma. N Engl J Med. 2014; 371: 2499-2509.
4. Enzinger PC, Mayer RJ. Esophageal cancer. N Engl J Med. 2003; 349: 2241-2252.
5. Ponting CP, Oliver PL, Reik W. Evolution and functions of long noncoding RNAs. Cell. 2009; 136:629-641.
6. Gibb EA, Brown CJ, Lam WL. The functional role of long non-coding RNA in human carcinomas. Mol Cancer. 2011; 10:38-55.
7. Khalil AM, Guttman M, Huarte M, Garber M, Raj A, Rivea Morales D, Thomas K, Presser A, Bernstein BE, van Oudenaarden A, Regev A, Lander ES, Rinn JL. Many human large intergenic noncoding RNAs associate with chromatin-modifying complexes and affect gene expression. Proc Natl Acad Sci U S A. 2009; 106:11667-11672.
8. Endo H, Shiroki T, Nakagawa T, Yokoyama M, Tamai K, Yamanami H, Fujiya T, Sato I, Yamaguchi K, Tanaka N, Iijima K, Shimosegawa T, Sugamura K, et al. Enhanced expression of long non-coding RNA HOTAIR is associated with the development of gastric cancer. PLoS One. 2013; 8:e77070.
9. Li JY, Ma X, Zhang CB. Overexpression of long non-coding RNA UCA1 predicts a poor prognosis in patients with esophageal squamous cell carcinoma. Int J Clin Exp Pathol. 2014; 7:7938-44.
10. Tong YS, Zhou XL, Wang XW, Wu QQ, Yang TX, Lv J, Yang JS, Zhu B, Cao XF. Association of decreased expression of long non-coding RNA LOC285194 with chemoradiotherapy resistance and poor prognosis in esophageal squamous cell carcinoma. J Transl Med. 2014; 12: 233-242.
11. Hao Y, Wu W, Shi F, Dalmolin RJ, Yan M, Tian F, Chen X, Chen G, Cao W. Prediction of long noncoding RNA functions with co-expression network in esophageal squamous cell carcinoma. BMC Cancer. 2015; 15:168-178.
12. Guo K, Lukacik P, Papagrigoriou E, Meier M, Lee WH, Adamski J, Oppermann U. Characterization of human DHRS6, an orphan short chain dehydrogenase/reductase enzyme: a novel, cytosolic type 2 R-beta-hydroxybutyrate dehydrogenase. J Biol Chem. 2006; 281:10291-10297.
13. Yang WC, Tsai WC, Lin PM, Yang MY, Liu YC, Chang CS, Yu WH, Lin SF. Human BDH2, an anti-apoptosis factor, is a novel poor prognostic factor for de novo cytogenetically normal acute myeloid leukemia. J Biomed Sci. 2013; 20:58-73.
14. Ashkenazi A, Dixit VM. Death receptors: Signaling and modulation. Science. 1998; 281:1305-1308.
15. Jung JY, Kim WJ. Involvement of mitochondrial- and Fas-mediated dual mechanism in CoCl2-induced apoptosis of rat PC12 cells. Neurosci. Lett. 2004; 371: 85-90.
16. Orrenius, S. Mitochondrial regulation of apoptotic cell death. Toxicol. Lett. 2004; 149: 19-23.
17. Crow MT, Mani K, Nam YJ, Kitsis RN. The mitochondrial death pathway and cardiac myocyte apoptosis. Circ. Res. 2004; 95: 957-970.
18. Wang C, Youle RJ. The role of mitochondria in apoptosis. Annu. Rev. Genet. 2009; 43: 95-118.
19. Norberg E, Orrenius S, Zhivotovsky B. Mitochondrial regulation of cell death: Processing of apoptosis-inducing factor (AIF). Biochem. Biophys. Res. Commun. 2010; 396: 95-100.
20. Yang J, Liu X, Bhalla K, Kim CN, Ibrado AM, Cai J, Peng TI, Jones DP, Wang X. Prevention of apoptosis by Bcl-2: Release of cytochrome c from mitochondria blocked. Science. 1997; 275: 1129-1132.
21. Scorrano L, Korsmeyer SJ. Mechanisms of cytochrome c release by proapoptotic BCL-2 family members. Biochem. Biophys. Res. Commun. 2003; 304: 437-444.
22. Jiang X, Wang X. Cytochrome C-mediated apoptosis. Annu. Rev. Biochem. 2004; 73: 87-106.
23. Nalepa G, Zukowska-Szczechowska E. Caspases and apoptosis: Die and let live. Wiad Lek. 2002; 55: 100-106.
24. Cho SG, Choi EJ. Apoptotic signaling pathways: Caspases and stress-activated protein kinases. J. Biochem. Mol. Biol. 2002; 35: 24-27.
25. Zhang XJ, Mei WL, Tan GH, Wang CC, Zhou SL, Huang FR, Chen B, Dai HF, Huang FY. Strophalloside induces apoptosis of SGC-7901 cells through the mitochondrion-dependent caspase-3 pathway. Molecules. 2015; 20: 5714-28.
26. Chen X. Predicting lncRNA-disease associations and constructing lncRNA functional similarity network based on the information of miRNA. Sci Rep. 2015; 5:13186.
27. Iyer MK, Niknafs YS, Malik R, Singhal U, Sahu A, Hosono Y, Barrette TR, Prensner JR, Evans JR, Zhao S, Poliakov A, Cao X, Dhanasekaran SM, et al. The landscape of long noncoding RNAs in the human transcriptome. Nat Genet. 2015; 47:199-208.
28. Lu KH, Li W, Liu XH, Sun M, Zhang ML, Wu WQ, Xie WP, Hou YY. Long non-coding RNA MEG3 inhibits NSCLC cells proliferation and induces apoptosis by affecting p53 expression. BMC Cancer. 2013; 13: 461-472.
29. Fatima R, Akhade VS, Pal D, Rao SM. Long noncoding RNAs in development and cancer: potential biomarkers and therapeutic targets. Mol Cell Ther. 2015; 3:5-24.
30. Zang W, Wang T, Huang J, Li M, Wang Y, Du Y, Chen X, Zhao G. Long noncoding RNA PEG10 regulates proliferation and invasion of esophageal cancer cells. Cancer Gene Ther. 2015; 22:138-44.
31. Wu Y, Liu H, Shi X, Yao Y, Yang W, Song Y. The long non-coding RNA HNF1A-AS1 regulates proliferation and metastasis in lung adenocarcinoma. Oncotarget. 2015; 6:9160-72. doi: 10.18632/oncotarget.3247.
32. Tang J, Jiang R, Deng L, Zhang X, Wang K, Sun B. Circulation long non-coding RNAs act as biomarkers for predicting tumorigenesis and metastasis in hepatocellular carcinoma. Oncotarget. 2015; 6:4505-15. doi: 10.18632/oncotarget.2934.
33. Xue Y, Ma G, Zhang Z, Hua Q, Chu H, Tong N, Yuan L, Qin C, Yin C, Zhang Z, Wang M. A novel antisense long noncoding RNA regulates the expression of MDC1 in bladder cancer. Oncotarget. 2015; 6:484-93. doi: 10.18632/oncotarget.2861.
34. Di Gesualdo F, Capaccioli S, Lulli M. A pathophysiological view of the long non-coding RNA world. Oncotarget. 2014; 5:10976-96. doi: 10.18632/oncotarget.2770.
35. Lin ZY, Chuang WL. Genes responsible for the characteristics of primary cultured invasive phenotype hepatocellular carcinoma cells. Biomed Pharmacother. 2012; 66:454-458.
36. Huang D, Yu B, Deng Y, Sheng W, Peng Z, Qin W, Du X. SFRP4 was overexpressed in colorectal carcinoma. J Cancer Res Clin Oncol. 2010; 136:395-401.
37. Yu H, Xu Q, Liu F, Ye X, Wang J, Meng X. Identification and validation of long noncoding RNA biomarkers in human non-small-cell lung carcinomas. J Thorac Oncol. 2015; 10:645-54.
38. Wei G, Luo H, Sun Y, Li J, Tian L, Liu W, Liu L, Luo J, He J, Chen R. Transcriptome profiling of esophageal squamous cell carcinoma reveals a long noncoding RNA acting as a tumor suppressor. Oncotarget. 2015 10; 6: 17065-80. doi: 10.18632/oncotarget.4185.
39. Zhang X, Xu Y, He C, Guo X, Zhang J, He C, Zhang L, Kong M, Chen B, Zhu C. Elevated expression of CCAT2 is associated with poor prognosis in esophageal squamous cell carcinoma. J Surg Oncol. 2015; 111:834-9.
40. Coonley CJ, Bains M, Hilaris B, Chapman R, Kelsen DP. Cisplatin and bleomycin in the treatment of esophageal carcinoma: a final report. Cancer. 1984; 54:2351-5.
41. Kelsen D, Fein R, Coonley C, Heelan R, Bains M. Cisplatin, vindesine and mitoguazone in the treatment of esophageal cancer. Cancer Treat Rep. 1986; 70:255-9.
42. Kies MS, Rosen ST, Tsang TK. Cisplatin and 5-fluorouracil in the primary management of squamous esophageal cancer. Cancer. 1987; 60:2156-60.
43. Mac Farlane SD, Hill LD, Jolly DC, Kozarek RA, Anderson RP. Improved results of surgical treatment for esophageal and gastro-esophageal junction carcinoma after pre-operative combined chemotherapy and radiation. Thorac Cardiouasc Surg. 1988; 95:415-22.