
INTRODUCTION
For almost 30 years gene amplifications have been known in the development of amphibians and flies [1]. We recently reported gene amplifications during differentiation in human and mouse neural stem and progenitor cells [2, 3]. These studies raise the questions if gene amplification is a fundamental and widespread mechanism during the differentiation process. To further address this issue we searched for amplification during the differentiation of the skeletal muscle. Previously it was hypothesized that a strong increase of alpha-actin gene expression during chicken myoblast differentiation may result from a gene amplification mechanism [4]. Differentiation of skeletal muscle cells is a highly organized process with myoblasts differentiating from mononucleate cells to multinucleate myotubes and finally to mature myotubes. C2C12 cells derived from a mouse myoblast cell line [5, 6] were used in many studies that analyzed myogenic differentiation [7–9]. These cells differentiate rapidly, form contractile myotubes and produce characteristic muscle proteins. During early myogenesis there is evidence for double strand breaks of unknown origin in C2C12 cells [10]. Fork collapse at stalled replication forks play a role in the formation of double strand breaks [11] and both double strand breaks and fork collapse are likely accompanying the amplification process.
Here, we analyzed amplification during the differentiation of skeletal muscle. Our previous studies on gene amplification in non-malignant mammalian cells indicated that physiological amplification events may not only be restricted to small time windows but also to small number of cells. In the light of this finding, we used fluorescence in situ hybridization (FISH) to detect gene amplifications on single cell level. In addition, we used qPCR to monitor amplification over a time window of several days. The extended time window was selected to cover myogenic differentiation steps. A study from Hayward et al 1986 on primary chicken embryo myoblasts distinguished between prefusion stage (0-36h), fusion stage (48-72) and postfusion stage (more than 72h) [12]. In mouse C2C12 myoblasts maximal fusion is detectable between 24h and 36h and fusion is essentially completed after 72h to 96h [13]. In addition to the detection of amplification we searched for accompanying double strand break repair during myogenesis. We further set out to confirm our results on primary human myoblasts and in vivo on mouse cryosection.
RESULTS
Amplification of ACTA1, NUP133, MYO18B and CDK4 in single cells during mouse myogenesis
We analyzed C2C12 cells (ATCC), which represent a subclone generated from a mouse myoblast cell line [5, 6]. To search for gene amplification in single cells we used fluorescence in situ hybridization (FISH) on cells differentiating to myotubes over a period of seven days. We selected chromosome regions that harbor genes that were previously shown to be involved in myogenesis and/or to specifically show increased expression during myogenic differentiation. The chromosomal regions included 8qE2 containing ACTA1/NUP133, 5qF containing MYO18B and 10qD3 containing CDK4. It was previously shown that alpha-actin (ACTA1) and MYO18B expression increased during myogenic differentiation [13, 14]. CDK4 was reported as amplified in tumors of myogenic origin [15]. In detail, the following BACs were used for FISH analysis: BAC RP23-446H16 containing genes ACTA1 and NUP133, RP23-6J9 containing MYO18B and RP23-432F11 containing CDK4. In addition, as reference we used BAC RP23-132P5 that contained TERT which was previously not associated with myogenic processes. We define a copy number of the test gene as normal when both the number of signals corresponded to the genome ploidy and its fluorescence spot size equaled the spot size of the reference gene. An amplified copy number is defined by an increased signal number and/or by an increased fluorescence spot size of a test gene compared to the reference gene. FISH analysis on undifferentiated C2C12 cells revealed 3 signals for ACTA1/NUP133, 4 signals for MYO18B, 4-5 signals for CDK4, and 4 signals for TERT gene. Representative hybridization results of undifferentiated C2C12 nuclei are shown in Figures 1a and 2a. These results are consistent with the known near-tetraploid karyotype of C2C12 cells [16]. For amplification analysis we performed FISH on C2C12 cells at days 3-7 following differentiation inductions. The above time points were selected to span the mouse myoblasts fusion process that starts with the prefusion stage (0-36h), followed by the fusion stage (48-72), and that is completed after 72h to 96h [12, 13].
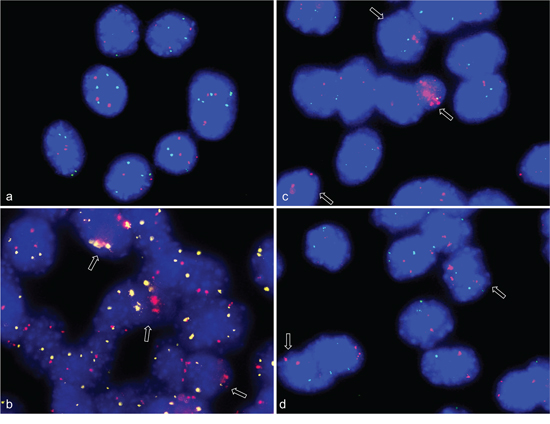
Figure 1: Gene amplifications on chromosomes 8qE2 and 5qF in differentiation induced C2C12 mouse myoblast cells. FISH was used to analyze gene amplifications of two chromosomal loci (MYO18B in BAC RP23-6J9 and ACTA1/NUP133 in BAC RP23-446H16) in nuclei from differentiation induced C2C12 mouse myoblast cells. In keeping with the known near tetraploid C2C12 karyotype, the undifferentiated C2C12 cells show tetraploid copy number for MYO18B(green) and triploid copy number for ACTA1/NUP133 (pink) a. After four days of differentiation induction C2C12 cells show MYO18B (yellow) and ACTA1/NUP133 (pink) gene amplification b. After 7 days of differentiation induction C2C12 cells show ACTA1/NUP133 (pink) gene amplification and three to four signals for MYO18B (green) c, d. Representative cells with amplifications are marked by arrow. Nuclei were counterstained with DAPI.
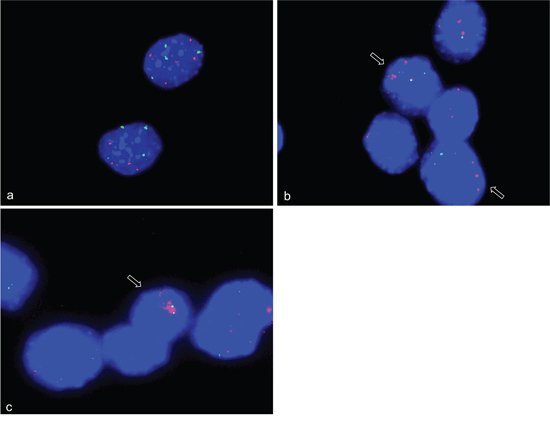
Figure 2: CDK4 gene amplifications on chromosome 10qD3 in differentiation induced C2C12 myoblast cells. FISH was used to analyze gene amplifications of CDK4 (RP23-432F11) in nuclei from differentiation induced C2C12 mouse myoblast cells. TERT (RP23-132P5) was used as reference. Undifferentiated C2C12 cells show a tetraploid copy number for TERT (green) and five copies for CDK4 (pink) a. After three days of differentiation induction C2C12 cells show CDK4 gene amplification (pink) and four signals for TERT b, c. Representative cells with amplifications are marked by arrow. Nuclei were counterstained with DAPI.
In the FISH analysis BAC NUP133/ACTA1 identified a strong amplification in C2C12 myoblasts four days and seven days after induction of differentiation (Figure 1b–1d). Amplification of MYO18B was detected in C2C12 cells four days after differentiation induction (Figure 1b), and amplification of CDK4 three days after differentiation induction (Figure 2b,c). Amplification frequencies of CDK4, NUP133, and MYO18B have been determined by analyzing 100 nuclei each (Table 1).
Table 1: Amplification frequencies from 100 nuclei analyzed by FISH
celltype |
CDK4 |
NUP133 |
MYO18B |
MDM2 |
|---|---|---|---|---|
C2C12 (mouse) |
3-4% |
5% |
1-2% |
n.a. |
HSkM (human) |
3% |
1-10% |
n.a. |
5-10% |
n.a.: not analyzed, variation depends on differentiation time
Amplification of ACTA1, NUP133, MYO18B and CDK4 identified by qPCR during mouse myogenesis
After having identified gene amplifications in single cells, we used qPCR analysis (TaqMan) for the detection of amplification in DNA isolated from cells at two time points before differentiation induction (day zero and day 2) and seven time points after differentiation induction (1-7days) (Figure 3). The two time points before differentiation induction were included to identify possible gene amplification during normal cell culture i.e. cell culture without induction of differentiation. Since our FISH analysis showed amplifications only in smaller numbers of cells, qPCR, which analyzes all cells at each time point indicates such amplifications by a comparable small increase of copy numbers. There was a copy number increase of CDK4 as compared to other genes prior to differentiation induction indicating an additional chromosome 10. This is consistent with our FISH results in undifferentiated cells that revealed 4-5 signals for CDK4. Following differentiation induction CDK4 showed a constant increase in copy number from day 1 to day 4. At day 5 there was a decrease in copy number of CDK4 back to the level that was found prior to the differentiation induction. A less pronounced but still detectable copy number increase was found for the gene NUP133. Here, the copy number increase was detectable after 2 days of differentiation induction and remained at moderate levels through days 3 to 7. PCR did not indicate copy number increase for MYO18B. While the FISH analysis detected a MYO18B amplification, the number of cells that harbor this amplification was apparently too low for a detection of an overall increased copy number by qPCR.
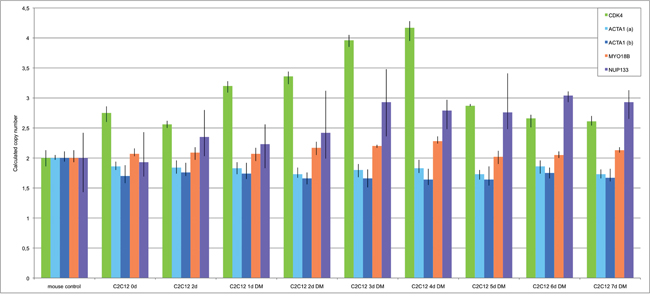
Figure 3: Amplification analysis of CDK4, ACTA1, MYO18B and NUP133 in differentiation induced C2C12 myoblast cells using qPCR. Amplification of CDK4, ACTA1, MYO18B and NUP133 was analyzed by qPCR using TaqMan copy number assays. TERT was used as reference gene in the Taqman assays and mouse genomic DNA served as standard for normal diploid copy number. Copy numbers are shown as mean from four technical replicates with vertical lines indicating the range. Undifferentiated C2C12 cells were analyzed at two time points e.g. at time point zero and after two days in cell culture medium. Differentiation induced C2C12 cells were analyzed at seven time points after differentiation induction. These time points are indicated with DM (differentiation medium). ACTA1 showed no amplifications in two independent TaqMan assays (light blue and dark blue). Likewise, MYO18B showed no amplifications (orange). CDK4 showed a copy number gain after one day of differentiation induction and the highest copy number gain after 4 days of differentiation induction (green). NUP133 showed a copy number gain at days 3, 4, 5, 6, and 7 after differentiation induction (purple).
For ACTA1 we found no evidence for amplification but a slight copy number decrease both in undifferentiated cells and throughout the differentiation process. This finding was confirmed by two ACTA1 specific TaqMan assays. The reduced copy number likely reflects a lower chromosome 8q number, which was also indicated by three fluorescence signals per nucleus in FISH experiments as compared to the four fluorescence signals per nucleus in FISH experiments of the reference TERT on mouse chromosome 13qC1.
Amplification of NUP133, CDK4 and MDM2 in primary human myoblasts during myogenesis
To confirm gene amplifications in an independent species we analyzed primary human myoblasts (HSkM; Invitrogen) by FISH. We used BAC RP4-679K16 that includes NUP133 and ACTA1 both of which are localized on human chromosome 1, BAC RP11-571M6 that includes CDK4, and BAC RP11-611O2 that includes MDM2. Both CDK4 and MDM2 are localized on human chromosome 12. Alpha-centromere probes from chromosome 1 (D1Z5) and chromosome 12 (D12Z3) were used as references for non-amplified sequences. Representative hybridizations results for NUP133, CDK4 and MDM2 with corresponding centromere probe are shown in Figure 4 a-c. We found trisomy for chromosome 1 in 50% of the undifferentiated primary myoblasts (4b). Amplifications of CDK4 were detected after 2 days of differentiation induction (Figure 4d), amplifications of NUP133 after 3 days of differentiation induction (Figure 4e), and amplifications of MDM2 after 2 days of differentiation induction (Figure 4f). The amplification frequencies of CDK4, NUP133, and MDM2 have been determined by analyzing 100 nuclei each (Table 1).
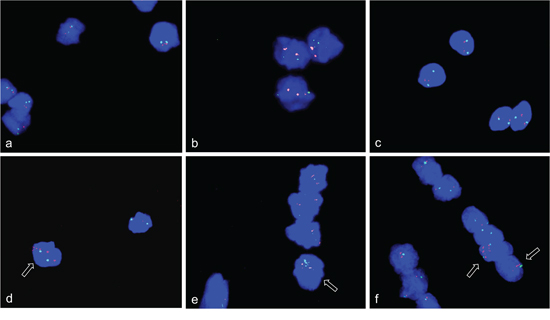
Figure 4: Gene amplifications on chromosomes 12q14-15 and 1q42.13 in differentiation induced HSkM human myoblast cells. FISH was used to analyze CDK4 (Rp11-571M6), MDM2 (RP11-611O2) and NUP133 (RP4-679K16) gene amplification in differentiation induced HSkM myoblast cells. Undifferentiated HSkM cells show two signals each for CDK4 (pink) and the alpha centromere probe on chromosome 12 (green) a, three signals for the chromosome alphacentromere probe on chromosome 1 (red) and NUP133 (green) in 50% of the cells indicating a gain of chromosome 1 b, and two signals each for MDM2 (pink) and the centromere probe from chromosome 12 (green) c. HSkM cells show CDK4 (pink) amplification after 2 days of differentiation induction d. NUP133 (green) amplification after 3 days of differentiation induction e, and MDM2 (pink) amplification after 2 days of differentiation induction f. Representative cells with amplifications are marked by arrow. Nuclei were counterstained with DAPI.
Amplification of NUP133, CDK4 and MDM2 identified by qPCR in primary human myoblasts during myogenesis
We used qPCR analysis for amplification detection in DNA isolated from cells isolated at day zero and at six time points (1d, 2d, 3d, 4d, 5d, 6d) after differentiation induction. In addition, we investigated amplification in cells seeded at a high density after 1 day of differentiation induction. Cells seeded with high density are supposed to differentiate fast following differentiation induction. Normal blood lymphocytes (PB) served as control standard for a diploid karyotype. As indicated above, qPCR, which analyzes all cells at each time points indicates amplifications of few cells by a comparable small overall increase of copy numbers. A copy number increase was detectable for all genes (NUP133, CDK4 and MDM2) after one day of differentiation induction (Figure 5). NUP133 revealed the highest copy number increase after 1d of differentiation induction when seeded at high density. CDK4 revealed a copy number increase after 1, 5 and 6 days. MDM2 revealed the highest copy number increase of all genes tested.
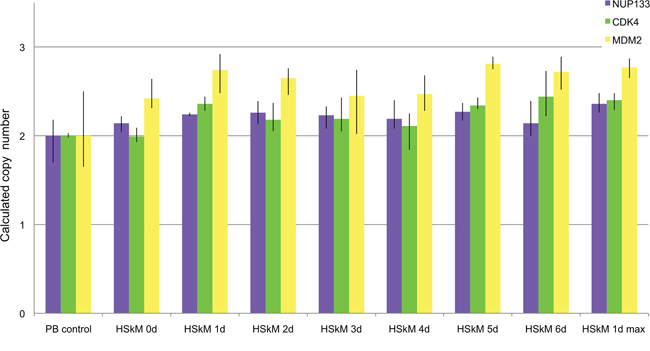
Figure 5: Amplification analysis of CDK4, MDM2 and NUP133 using qPCR in differentiation induced HSkM myoblast cells. Amplification of CDK4, MDM2 and NUP133 was analyzed by qPCR using TaqMan copy number assays. TERT was used as reference gene in the Taqman assays and DNA from normal blood lymphocytes (PB) served as standard for normal diploid copy number. Copy numbers are shown as mean from four technical replicates with vertical lines indicating the range. Undifferentiated HSkM cells served as controls at day zero (0d). Differentiation induced HSkM cells were analyzed at six time points after differentiation induction. HSkM cells were also analyzed with a high seeding density after 1 day of differentiation induction (1dmax). CDK4 showed the highest copy number after 6 days of differentiation induction (green). NUP133 showed the highest copy number gain at day one after differentiation induction with cells seeded at high density (1dmax) (blue). MDM2 showed copy number gains in undifferentiated HSkM cells and the highest copy number gain at days one, five and six each after differentiation induction (yellow).
Cellular localization of amplified sequences by using combined FISH and immunofluorescence analysis during mouse myogenesis
Since there is, as of yet, no evidence for persistent gene amplification in differentiated mammalian cells, the fate of amplifications that occur during differentiation remains to be elucidated. Using the combined analysis of alpha-actin as differentiation marker and interphase FISH of BACs for the above identified amplifications, we localized amplified sequences during myogenic differentiation. We found amplified gene signals not only within the nucleus but also amplifications that localized outside the nucleus. The signals in the cytoplasm that stained positive for alpha-actin were found for genes ACTA1/NUP133 (Figure 6a and 6c). These cytoplasm signals were found specifically at days 3, 4, and 5 after differentiation induction. The presence of DNA outside the nucleus was confirmed by DAPI staining (Figure 6b and 6d). These data provide evidence that cells can eliminate amplifications from the nucleus during myogenesis.
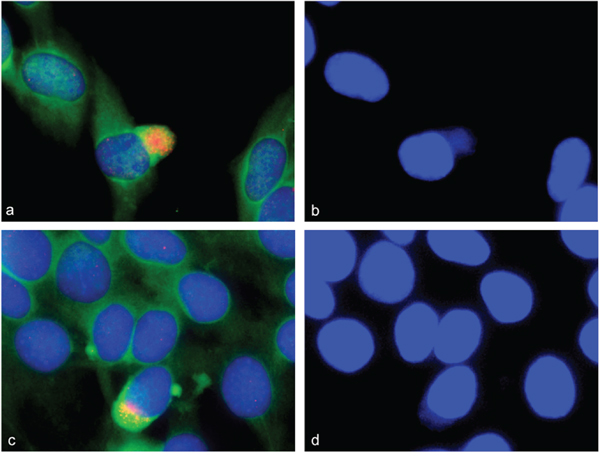
Figure 6: Gene amplification in alpha-actin expressing C2C12 cells. Combined immunofluorescence and fluorescence in situ hybridization was used to confirm gene amplifications in differentiating myotubes. C2C12 cells stained positive for alpha-actin 4 days after differentiation induction (green). NUP133 amplifications were found both inside and outside the nucleus a, c. Enhanced picture of a DAPI stain is shown to show DNA outside the nucleus b, d.
Using simultaneous FISH with ACTA1/NUP133-BAC and MYO18B-BAC again revealed strong fluorescence signals for ACTA1/NUP133 outside the nucleus (Figure 7a) while less pronounced signal for ACTA1/NUP133 were found in the nucleus. Likewise, strong fluorescence signals outside and weak signals inside the nucleus were found for CDK4. The signal of the reference probes MYO18B (green) (Figure 7a) and ANO4 (green) (Figure 7b) were only found in the nucleus. Given that ANO4 and CDK4 were localized on the same chromosome, the finding of strong CDK4 signals outside with ANO4 signals remaining in the nucleus argues against a random exclusion of DNA material.
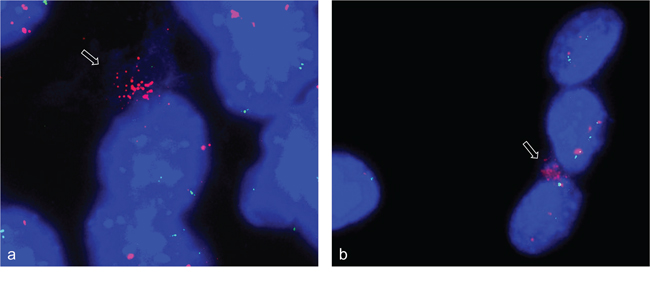
Figure 7: Gene amplifications outside the nucleus of C2C12 cells. FISH was used to analyze NUP133 and CDK4 gene amplification 3 and 5 days after differentiation induction. A cluster of strong fluorescence signals was detected for NUP133 outside the nucleus of C2C12 cells at day five after differentiation induction (pink). a. Likewise a cluster of strong fluorescence signals was detected outside the nucleus for CDK4 at day 3 after differentiation induction (pink) b. The signals indicate amplified NUP133 and CDK4 outside the nuclei. Weak and single signals indicating not-amplified NUP133 and CDK4 were detected in the nuclei. Weak and single signals were also found for MYO18B (green) (a) and ANO4 (green) (b) both of which were not amplified. Nuclei were counterstained with DAPI.
Detection of double strand breaks, repair and single-stranded DNA during myogenic differentiation
There is evidence for double strand breaks detected by gamma-H2AX foci in C2C12 cells [10]. We detected gamma-H2AX foci in C2C12 at days 1, 2, 3, 4 and 5 after differentiation induction with a decrease in frequency after 4 days. Previous studies found disappearance of gamma-H2AX foci after 2 days [10]. Evidence for DNA repair in gamma-H2AX foci is indicated by localization of 53BP1 protein in those foci [17]. We found 53BP1-containing gamma-H2AX foci that are indicative for double strand break repair after 2, 3 and 5 days of differentiation induction in C2C12 cells. Representative immunofluorescence (IF) staining for gamma-H2AX and 53BP1 in undifferentiated C2C12 cells (a, b) and after 3 days of differentiation induction (c, d) are shown in Figure 8. Representative immunofluorescence staining for gamma-H2AX and 53BP1 in undifferentiated primary human myoblast cells (a,b) and after 2 days of differentiation induction (c,d) are shown in Figure 9. The detection of amplification and gamma-H2AX foci during myogenic differentiation is consistent with the hypothesis that gene amplification/rereplication might be responsible for double strand breaks, repair and replication stress.
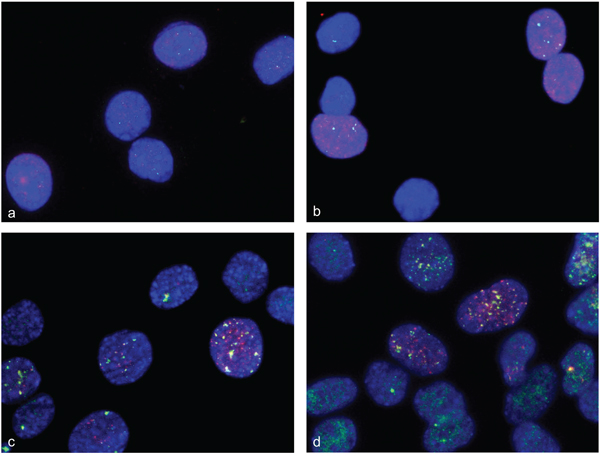
Figure 8: Double strand breaks and DNA repair in differentiation induced C2C12 cells. Immunofluorescence assays were used to simultaneously analyze gamma-H2AX foci and 53BP1 protein in differentiation induced C2C12. Gamma-H2AX foci are shown in red fluorescence and 53BP1 protein specific foci are shown in green. Undifferentiated C2C12cells show a weak stain for gamma-H2AX and for 53BP1 a, b. After 3 days of differentiation induction, C2C12cells show both strong 53BP1 signals and gamma-H2AX foci, indicating double strand break repair c, d. Nuclei were counterstained with DAPI.
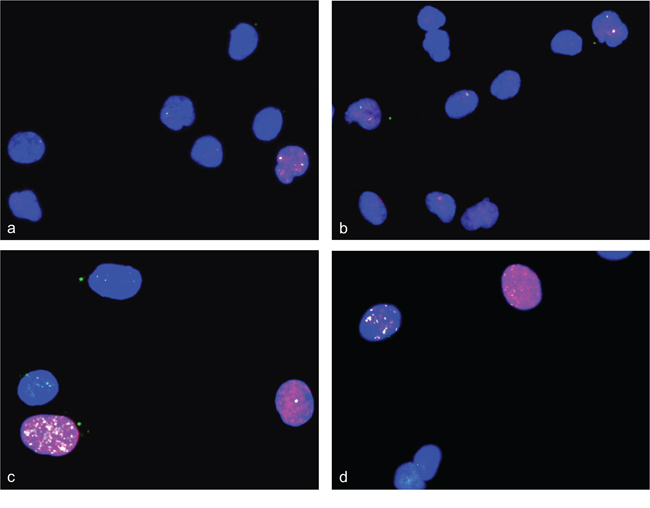
Figure 9: Double strand breaks and DNA repair in differentiation induced HSkM cells. Immunofluorescence assays were used to simultaneously analyze gamma-H2AX foci and 53BP1 protein in differentiation induced HSkM cells. Gamma-H2AX foci are shown in red fluorescence and 53BP1 protein specific foci are shown in green fluorescence. Undifferentiated cells show a weak stain for gamma-H2AX and 53BP1 a, b. Two days after differentiation induction HSkM cells show both strong 53BP1 signals and gamma-H2AX foci indicating double strand break repair c, d. Nuclei were counterstained with DAPI.
Correlation of gene amplification and double strand breaks
Using a combined FISH-IF protocol, we analyzed whether C2C12 cells bearing gene amplifications also show an increased number of double strand breaks. C2C12 cells were differentiation induced for 4 days and first stained for gamma-H2AX. Subsequently, slides were used for FISH analysis with BAC-probes specific for ACTA1/NUP133 and CDK4. Representative gamma-H2AX foci are shown in an overview picture with the results of FISH analysis shown in enlarged display windows. We found an overlap of cells with gamma-H2AX foci and cells with gene amplifications (Figure 10).
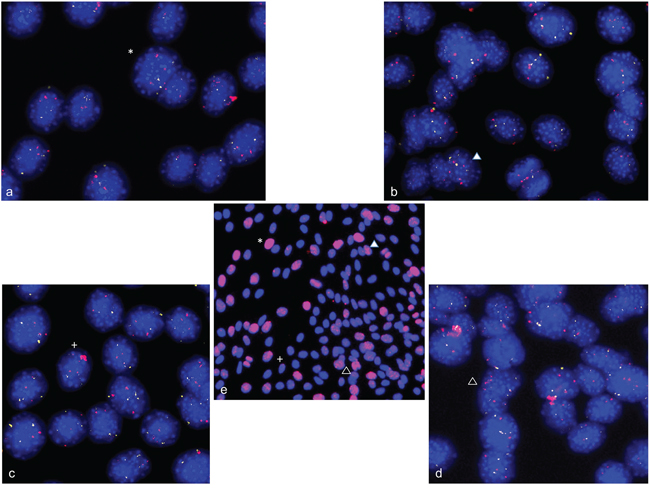
Figure 10: Double strand breaks and gene amplification in differentiation induced C2C12 cells. Combined immunofluorescence assays and FISH were used to analyze the correlation between double strand breaks and amplification in C2C12 cells at day four after differentiation induction. Gamma-H2AX foci are shown in red in the overview picture (e) in the center of the figure. FISH analysis of NUP133 (pink) and CDK4 (white) is shown in the four outer pictures a-d, that represent enlarged portions of the overview picture with each position indicated by a separate symbol (cross, asterisk, filled and empty triangle). There is an overlap of cells with gamma-H2AX foci and cells with strong signals for NUP133 (pink) and/or CDK4 gene indicating amplifications of these genes. Nuclei were counterstained with DAPI.
In vivo analysis of gene amplification
To provide further evidence for a physiological role of gene amplification, we analyzed ACTA1/NUP133 and CDK4 for in vivo amplifications in mouse embryos. On the basis of dermomyotome development with myoblasts and early differentiating muscle cells, we selected embryonic stage E11.5 for the amplification analysis. Using FISH on cryosections from the mouse embryo we found evidence for an amplification of both ACTA1/NUP133 and CDK4 in the dermomyotome (Figure 11).
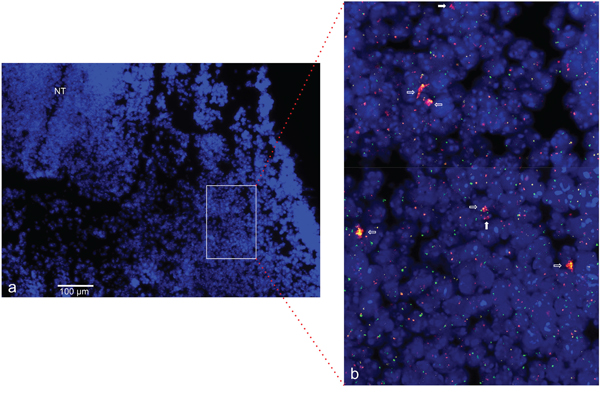
Figure 11: CDK4 and NUP133 amplification in mouse embryo stage E11.5. FISH was used to analyze CDK4 and NUP133 amplification in vivo on transversal cryosection from mouse abdominal region. The transversal cryosection is displayed as DAPI-stained overview with the neural tube indicated (NT) a. The results of FISH experiments are visible in the enlarged section b. Amplification of CDK4 (pink) and/or NUP133 (yellow) is indicated by enlarged signals and/or multiple signals for CDK4 and NUP133. TERT was used as reference (green). Filled arrows indicate nuclei with NUP133 amplifications and open arrows nuclei with co-amplifications of NUP133 and CDK4. Individual cells with amplifications were detected in multiple regions of the developing myotome. Nuclei were counterstained with DAPI. Size calibration bar is 100μm.
DISCUSSION
Gene amplification is well known as mechanism to elevate gene copy numbers during the development of amphibians and flies [1]. Recently we reported gene amplification during neural differentiation providing first evidence that gene amplification as a physiological mechanism is also established in mammals [2, 3]. Previous reports showed strongly increased alpha-actin gene expression during chicken myoblast differentiation [4]. Although the authors suggested gene amplification as likely cause for differential expression of alpha-actin gene during chicken myogenesis they could not reproducibly demonstrate amplification of alpha-actin gene during chicken myogenesis [12]. To follow up these findings, we analyzed gene amplification of alpha-actin (ACTA1) in myoblasts after induction of differentiation. For our FISH analysis we used a BAC probe for a genomic region that harbors the genes ACTA1 and NUP133. While NUP133 was confirmed to be amplified by using qPCR, qPCR failed to confirm the gene amplification of ACTA1 that is localized 10 kb apart from NUP133. The increased gene expression of ACTA1 during myoblast differentiation is likely due to other mechanisms than gene amplification. Nevertheless, our results confirmed the amplification of the genomic region including the genes ACTA1 and NUP133 during myogenic differentiation.
Since gene amplifications in mammals are largely known from tumors, it appeared legitimate to analyze genes, which are amplified in tumors for a possible amplification in a physiological context. Previous studies specifically suggested a relationship between gene amplification during tumor development and gene amplification during differentiation. We recently reported several genes that were amplified both in glioblastoma development and during neuronal progenitor cell differentiation [2]. A recent study reported ERBB2 amplification during extravillous trophoblast differentiation and indicated a similar amplification event in the persistent gestational trophoblastic disease, which is a trophoblast-originating tumor [18, 19].
Here, we tested whether genes that were amplified in tumors of myogenic origin were also amplified during myogenic differentiation. CDK4 and MDM2 were amplified in leiomyosarcoma and rhabdomyosarcoma [15, 20]. We detected CDK4 and MDM2 amplification during myogenesis of human primary myoblast cells (HSkM) and CDK4 amplification during myogenesis of mouse C2C12 cells. As for the scenario that may explain gene amplification both in the tumor and in the physiological context, stem cells or progenitor cells could possibly develop into tumor cells while maintaining their capacity for gene amplification. Alternatively, tumor cells may regain stem cell properties including the ability for gene amplification.
Regarding the mechanism of gene amplification, the process underlying the amplification in normal cells is likely different from the amplification mechanism known for mammalian tumor cells. The breakage-fusion-bridge-cycle model hypothesizes the collection of multiple copies by subsequent cycles in the course of cell divisions [21]. In differentiating cells the copy numbers are increased independent from cell division. The increase in normal cells may be due to multiple firing of replication origins and endocycling as reported for Drosophila [22]. One of the first models of gene amplifications that were hypothesized more than 30 years ago described an "onion-like" structure created by unscheduled re-replication in a replication bubble [23]. In our study, the clusters of frequently enlarged FISH signals in the nucleus suggest a re-replication mechanism. This hypothesis awaits further experimental confirmation.
Recent studies report massive genomic rearrangements in a single event in tumor cells referred to as chromothripsis [24]. This phenomenon is accompanied by DNA breaks, chromosome pulverization, and micronuclei formation [25, 26]. If and to what extend chromothripsis and gene amplification are related remains to be determined. Amplification may occur in the process of chromothripsis or alternatively chromothripsis may result from an unfinished and derailed amplification process at multiple replication origins in tumor cells. Although we have limited information on an overall genome involvement in the amplification process of differentiating myoblasts, we have evidence for a genome-wide amplification in normal neuronal progenitor cells. As of now, there is, however, no evidence for a role of chromothripsis in the amplification process in differentiating myoblasts.
Regarding the fate of amplified gene in physiological processes, amplified chorion DNA is removed by cell death of follicle cells in Drosophila. We did not find evidence for cell death as a general mechanism to remove sequences amplified during C2C12 myogenic differentiation. We found, however, evidence for the removal of amplified DNA from the nucleus. Using simultaneous FISH and IF we identified cells with amplified DNA not only in the nucleus but also in the cytoplasm of differentiation induced C2C12 cells. Specifically, we found intense fluorescence signals for NUP133 and CDK4 but not for the reference genes ANO4 and MYO18B outside the nucleus, arguing for a selective exclusion of amplified sequences.
The determination of the general amplification frequency in differentiating cells remains challenging. First, at present the amplification frequency has been determined only for few genes; second, co-amplifications and heterogeneous cell population complicates an exact calculation. An indirect indication of amplification frequency can be made from cells with double strand breaks. After 4 days of differentiation induction 85% of cells revealed double strand breaks suggesting that these cells are involved in gene amplifications. We also clarify that this is a descriptive analysis and further functional proof is required to support a causative link between amplification and double strand breaks.
Genome wide DNA damage/strand breaks are known to occur during differentiation. Induced reduction of strand break formation leads to complete blockade of differentiation in myoblasts [10]. Our analysis confirmed the presence of double strand breaks (DSB) and provided evidence for DSB repair during myogenic differentiation. In addition, we were able to demonstrate that cells with gene amplifications simultaneously harbor DSBs. Our finding may also help to explain the persistence of amplifications in tumor cells. Tumor cells may have lost the stem cell ability to repair double strand breaks and the ability to exclude amplified DNA from the nucleus. Consistent with this idea is our finding, that genes that are amplified during developmental processes remain amplified in tumors. Examples include CDK4, which is amplified in neural progenitor cells and myoblasts during differentiation and ERBB2, which is amplified in differentiating trophoblasts. These genes were also amplified in tumors of the same origins including glioblastoma, leiomyosarcoma and trophoblast originating tumors. As for now, we are just at the very beginning of an understanding of the complex scenarios of gene amplification processes in a physiological context. A deeper insight into the mechanisms of gene amplification in differentiation processes will in turn help to shed light on the gene amplification mechanisms in tumor cells.
MATERIALS AND METHODS
Cell culture and differentiation
C2C12 (ATCC® CRL-1772TM) cells were grown in DMEM with 10% FCS. Differentiation was induced with change of the growth medium to DMEM supplemented with 2% horse serum. Human primary myoblast cells HSkM (Invitrogen) were grown in DMEM with 10% FCS. Differentiation was induced with change of the growth medium to DMEM supplemented with 2% horse serum. For immunofluorescence and for fluorescence in situ hybridization cells were grown on glass slides.
qPCR analysis
TaqMan Copy Number Assays for genes CDK4 (Mm00305758_cn), NUP133 (Mm00263211_cn), ACTA1 (a: Mm00241646_cn; b: Mm00242070_cn) and MYO18B (Mm00167228_cn) were performed following manufacturers instructions. We used the TERT TaqMan Copy Number reference assay for relative quantitation of copy number of target genes. Mouse genomic DNA (Clontech) was used as control standard for normal diploid copy number.
TaqMan Copy Number Assays for genes CDK4 (Hs00957586_cn), NUP133 (Hs06590418_cn), and MDM2 (Hs00181272_cn) were performed following manufacturers instructions. We used the TERT TaqMan Copy Number reference assay for relative quantitation of copy number of target genes. DNA from human normal blood lymphocytes (PB) was used as control standard for normal diploid copy number.
TaqMan assays were run in four technical replicates and results were analyzed using StepOneTM Software v2.0 and CopyCallerTM software.
Fluorescence in situ hybridization
BAC clones were taken from the RP-11 (http://www.chori.org/bacpac/) libraries of the Welcome Trust Sanger Institute and available from SourceBioSciences, Germany. BAC-DNA (1μg) was either labeled with Alexa-488-dCTP (green fluorescence signals), with Alexa-555-dCTP (yellow fluorescence) or with Alexa-594-dCTP (pink fluorescence signals) using the FISHTag DNA labeling Kit according to the manufacturer's instructions. Differentially labeled probe DNAs (60 ng) were precipitated in the presence of mouse or human Cot-1 DNA. Samples were resuspended in hybridization mix (50% formamide, 2xSSPE, 10% dextrane sulphate and 4% SDS).
Differentiating C2C12 myoblast cells and control non-differentiating C2C12 myoblast cells were grown on glass slides and fixed in ice-cold methanol for 20 minutes. Human primary myoblast cells (HSkM) were treated alike. Slides were washed in PBS for 5 minutes and treated with 0.02% Tween-20 for 5 minutes. Slides were RNase treated (100 μg/ml RNaseA in 2x SSC) for 1h at 37°C and pepsin treated (0.005% in 0.01 M HCl at 37°C) for 10 minutes. Postfixation was performed using 1% formaldehyde/1x PBS for 10 minutes at room temperature. Hybridization and posthybridization washes were as described previously [3].
For simultaneous fluorescence in situ hybridization and immunofluorescence, differentiating C2C12 cells on glass slides were fixed in ice-cold methanol for 20 minutes and permeabilized with 0.2% Tween-20 for 5 minutes. Postfixation was done by 1% formaldehyde/1x PBS for 10 minutes at room temperature. Slides were blocked with goat serum, incubated for 1 h with rabbit antibody monoclonal against muscle-Actin (ab156302, Abcam) and detected using an Alexa-488 coupled secondary antibody (Invitrogen). Finally, slides were dehydrated by an ascending ethanol series (70%/80%/96%) and air-dried. Hybridization and post hybridization washes were as described above.
For immunofluorescence C2C12 cells or human primary myoblast cells (HSkM) were grown on glass slides, fixed and permeabilized as above and incubated with following antibodies: mouse antibody monoclonal against gamma-H2AX (ab26350, Abcam) and rabbit antibody polyclonal against 53BP1 (ab21083, Abcam). Detection was done with an Alexa-488 coupled secondary antibody against rabbit and Alexa-594 coupled secondary antibody against mouse (Invitrogen).
Fluorescence images were captured with an Olympus AX70 microscope using CellSens software from Olympus.
Fluorescence in situ hybridization on mouse embryo cryosections
Transverse cryosections (10 μm) from mouse trunk at embryonic stage E11.5 were treated with Carnoy's fixative for 15 min at 4°C, pepsin-digested and fixed in 4% paraformaldehyde in diethylpyrocarbonate-treated PBS for 10 minutes. Probes were labeled as described above, applied to the section and denatured for 5 min at 80°C. Hybridization was maintained for 2 days at 37°C. Posthybridization washes and DAPI staining were as described above.
ACKNOWLEDGMENTS
We thank A. Grißmer for technical assistance.
CONFLICTS OF INTERESTS
The authors declare no conflict of interests.
GRANT SUPPORT
The “Deutsche Forschungsgemeinschaft” funded this study (Fi644/2-1; Fi644/2-2).
REFERENCES
1. Bostock CJ. Mechanisms of DNA sequence amplification and their evolutionary consequences. Philosophical transactions of the Royal Society of London Series B, Biological sciences. 1986; 312:261-273.
2. Fischer U, Keller A, Voss M, Backes C, Welter C and Meese E. Genome-wide gene amplification during differentiation of neural progenitor cells in vitro. PloS one. 2012; 7:e37422.
3. Fischer U, Backes C, Raslan A, Keller A, Meier C and Meese E. Gene amplification during differentiation of mammalian neural stem cells in vitro and in vivo. Oncotarget. 2015; 6:7023-7039. doi: 10.18632/oncotarget.3248.
4. Schwartz RJ and Rothblum KN. Gene switching in myogenesis: differential expression of the chicken actin multigene family. Biochemistry. 1981; 20:4122-4129.
5. Yaffe D and Saxel O. Serial passaging and differentiation of myogenic cells isolated from dystrophic mouse muscle. Nature. 1977; 270:725-727.
6. Blau HM, Pavlath GK, Hardeman EC, Chiu CP, Silberstein L, Webster SG, Miller SC and Webster C. Plasticity of the differentiated state. Science. 1985; 230:758-766.
7. de Klerk E, Fokkema IF, Thiadens KA, Goeman JJ, Palmblad M, den Dunnen JT, von Lindern M and t Hoen PA. Assessing the translational landscape of myogenic differentiation by ribosome profiling. Nucleic acids research. 2015; 43:4408-4428.
8. Wu R, Li H, Li T, Zhang Y and Zhu D. Myostatin regulates miR-431 expression via the Ras-Mek-Erk signaling pathway. Biochemical and biophysical research communications. 2015; 461:224-229.
9. Garcia-Guerra L, Vila-Bedmar R, Carrasco-Rando M, Cruces-Sande M, Martin M, Ruiz-Gomez A, Ruiz-Gomez M, Lorenzo M, Fernandez-Veledo S, Mayor F, Jr., Murga C and Nieto-Vazquez I. Skeletal muscle myogenesis is regulated by G protein-coupled receptor kinase 2. Journal of molecular cell biology. 2014; 6:299-311.
10. Larsen BD, Rampalli S, Burns LE, Brunette S, Dilworth FJ and Megeney LA. Caspase 3/caspase-activated DNase promote cell differentiation by inducing DNA strand breaks. Proceedings of the National Academy of Sciences of the United States of America. 2010; 107:4230-4235.
11. Zeman MK and Cimprich KA. Causes and consequences of replication stress. Nature cell biology. 2014; 16:2-9.
12. Hayward LJ and Schwartz RJ. Sequential expression of chicken actin genes during myogenesis. The Journal of cell biology. 1986; 102:1485-1493.
13. Bains W, Ponte P, Blau H and Kedes L. Cardiac actin is the major actin gene product in skeletal muscle cell differentiation in vitro. Molecular and cellular biology. 1984; 4:1449-1453.
14. Salamon M, Millino C, Raffaello A, Mongillo M, Sandri C, Bean C, Negrisolo E, Pallavicini A, Valle G, Zaccolo M, Schiaffino S and Lanfranchi G. Human MYO18B, a novel unconventional myosin heavy chain expressed in striated muscles moves into the myonuclei upon differentiation. Journal of molecular biology. 2003; 326:137-149.
15. Ragazzini P, Gamberi G, Pazzaglia L, Serra M, Magagnoli G, Ponticelli F, Ferrari C, Ghinelli C, Alberghini M, Bertoni F, Picci P and Benassi MS. Amplification of CDK4, MDM2, SAS and GLI genes in leiomyosarcoma, alveolar and embryonal rhabdomyosarcoma. Histology and histopathology. 2004; 19:401-411.
16. Zacharaki P, Stephanou G and Demopoulos NA. Comparison of the aneugenic properties of nocodazole, paclitaxel and griseofulvin in vitro. Centrosome defects and alterations in protein expression profiles. Journal of applied toxicology : JAT. 2013; 33:869-879.
17. Kleiner RE, Verma P, Molloy KR, Chait BT and Kapoor TM. Chemical proteomics reveals a gammaH2AX-53BP1 interaction in the DNA damage response. Nature chemical biology. 2015; 11:807-814.
18. Meinhardt G, Kaltenberger S, Fiala C, Knofler M and Pollheimer J. ERBB2 gene amplification increases during the transition of proximal EGFR to distal HLA-G first trimester cell column trophoblasts. Placenta. 2015; 36:803-808.
19. Jelincic D, Hudelist G, Singer CF, Bauer M, Horn LC, Bilek K and Czerwenka K. Clinicopathologic profile of gestational trophoblastic disease. Wiener klinische Wochenschrift. 2003; 115:29-35.
20. Barr FG, Duan F, Smith LM, Gustafson D, Pitts M, Hammond S and Gastier-Foster JM. Genomic and clinical analyses of 2p24 and 12q13-q14 amplification in alveolar rhabdomyosarcoma: a report from the Children's Oncology Group. Genes, chromosomes & cancer. 2009; 48:661-672.
21. Coquelle A, Pipiras E, Toledo F, Buttin G and Debatisse M. Expression of fragile sites triggers intrachromosomal mammalian gene amplification and sets boundaries to early amplicons. Cell. 1997; 89:215-225.
22. Hassel C, Zhang B, Dixon M and Calvi BR. Induction of endocycles represses apoptosis independently of differentiation and predisposes cells to genome instability. Development. 2014; 141:112-123.
23. Stark GR and Wahl GM. Gene amplification. Annual review of biochemistry. 1984; 53:447-491.
24. Stephens PJ, Greenman CD, Fu B, Yang F, Bignell GR, Mudie LJ, Pleasance ED, Lau KW, Beare D, Stebbings LA, McLaren S, Lin ML, McBride DJ, et al. Massive genomic rearrangement acquired in a single catastrophic event during cancer development. Cell. 2011; 144:27-40.
25. Zhang CZ, Spektor A, Cornils H, Francis JM, Jackson EK, Liu S, Meyerson M and Pellman D. Chromothripsis from DNA damage in micronuclei. Nature. 2015; 522:179-184.
26. Crasta K, Ganem NJ, Dagher R, Lantermann AB, Ivanova EV, Pan Y, Nezi L, Protopopov A, Chowdhury D and Pellman D. DNA breaks and chromosome pulverization from errors in mitosis. Nature. 2012; 482:53-58.