
INTRODUCTION
Breast cancer is the most frequently diagnosed cancer in females worldwide; its rate in Western countries has increased since the 1990s [1]. During the same period, mortality from breast cancer has decreased due to early detection and improved treatments [2].
Currently, mammographic screening, followed by invasive core needle biopsies in cases of suspected malignancy, allows early breast cancer diagnosis. Mammographic screening is an accessible but unpleasant and inaccurate test; in 1000 screened women, 15 of these women are estimated to have a biopsy because of a suspicious abnormality, and the biopsy is estimated to diagnose breast cancer in 4 of these 15 women [3].
MicroRNAs (miRNAs) are approximately 22-nucleotide long RNAs that inhibit gene expression by binding to target messenger RNAs (mRNAs) [4]. Currently, more than 2000 mature human miRNAs have been identified, and these miRNAs may regulate up to 60% of human protein-coding genes [5]. miRNAs are involved in multiple biological processes including cell proliferation, differentiation and apoptosis [6, 7]. Their expression is modified in various cancer subtypes, where these miRNAs act as tumor suppressors or oncogenes and play a key role in tumorigenesis [8].
All cell types release miRNAs in peripheral blood under both normal and pathological conditions. These circulating miRNAs are wrapped in 40-to 100-nm lipoprotein vesicles called exosomes, which are membrane-enclosed cell fragments [9]. These miRNAs appear to be protected from endogenous RNase activity by exosomes and are therefore particularly stable in plasma [10]. Therefore, circulating miRNAs are promising biomarkers for the early and minimally invasive diagnosis of breast cancer [11]. Several studies have already explored miRNAs from that perspective, leading to mixed results in terms of performances [12–29]. Very different diagnostic signatures have been obtained, most likely due to the choice of the sample preparation, the technology used and the study design, such as choice of proper normalization and careful validation.
In the present study, to propose new tools for breast cancer screening, we constructed a diagnostic test based on 8 circulating miRNAs and confirmed its performance in a large cohort of primary breast cancer patients and controls. The diagnostic test was also validated in patients with breast cancer in remission, patients with metastatic breast cancer and patients with gynecologic cancer to test for breast cancer specificity and follow-up. Moreover, particular attention was given to normalization and bioinformatic analysis procedures.
RESULTS
Patients and controls
Patients with treatment-naive primary breast cancer (n = 149, median age = 55 yr, range = 26–87 yr), breast cancer in remission (n = 35, median age = 49 yr, range = 28–79 yr, median time follow-up since remission = 33 months), metastatic breast cancer (n = 31, median age = 59 yr, range = 35–79 yr) and gynecologic cancer (n = 30, median age = 62 yr, range = 38–83 yr) were recruited prospectively at CHU of Liège and Clinic Saint-Vincent (Liège, Belgium) from 7/2011 to 9/2014. Gynecologic tumors consisted of non-metastatic endometrial (n = 16), ovarian (n = 10) and cervical (n = 4) cancers. Controls were obtained from 133 cancer-free females of similar age (median age = 51 yr, range = 40–74 yr) with normal mammograms (n = 72), benign calcifications (n = 30) or simple cysts (n = 31). Controls had no history of cancer in the last 5 years.
In total, 378 patients were included in this study.
All breast cancer patients and tumor characteristics are summarized in Table 1.
Table 1: Clinicopathological data and tumor characteristics
Characteristics |
Primary breast cancers – pilot study (n = 18) |
Primary breast cancers – principal study (n = 149) |
Metastatic breast cancers (n = 31) |
Breast cancers in remission (n = 35) |
|---|---|---|---|---|
Median age (range) (y) |
58 (29–70) |
55 (26–87) |
59 (35–79) |
49 (28–79) |
Estrogen receptor [n (%)] |
12 (67) |
117 (79) |
28 (90) |
22 (63) |
Progesterone receptor [n (%)] |
11 (61) |
109 (73) |
22 (71) |
18 (51) |
HER2 [n (%)] |
6 (33) |
30 (20) |
6 (19) |
18 (51) |
Ki67 (median ± SD) (%) |
21 ± 20 |
20 ± 24 |
27 ± 23 |
37 ± 23 |
Initial T staging [n (%)] |
|
|
|
|
NA |
0 (0) |
1 (< 1) |
2 (6) |
0 (0) |
1 |
3 (17) |
62 (42) |
9 (30) |
3 (9) |
2 |
10 (55) |
58 (39) |
12 (19) |
19 (54) |
3 |
2 (11) |
15 (10) |
6 (19) |
5 (14) |
4 |
3 (17) |
13 (9) |
2 (6) |
8 (23) |
Lymph node involvement [n (%)] |
11 (61) |
70 (47) |
17 (55) |
24 (69) |
Tumor node metastasis (TNM) stage [n (%)] |
|
|
|
|
NA |
0 (0) |
1 (< 1) |
0 (0) |
0 (0) |
1 |
2 (11) |
45 (30) |
0 (0) |
0 (0) |
2 |
9 (50) |
73 (49) |
0 (0) |
20 (57) |
3 |
7 (39) |
31 (21) |
0 (0) |
15 (43) |
4 |
0 (0) |
0 (0) |
31 (100) |
0 (0) |
Scarff-Bloom-Richardson grade [n (%)] |
|
|
|
|
NA |
0 (0) |
1 (< 1) |
4 (13) |
0 (0) |
1 |
0 (0) |
7 (5) |
4 (13) |
0 (0) |
2 |
7 (39) |
84 (57) |
12 (39) |
15 (43) |
3 |
11 (61) |
57 (38) |
11 (35) |
20 (57) |
Histologic subtype [n (%)] |
|
|
|
|
NA |
0 (0) |
0 (0) |
2 (6) |
0 (0) |
IDC |
16 (88) |
125 (84) |
22 (71) |
33 (94) |
ILC |
1 (6) |
19 (13) |
7 (23) |
2 (6) |
Others |
1 (6) |
5 (3) |
0 (0) |
0 (0) |
Lymphovascular invasion [n (%)] |
6 (33) |
27 (21) |
12 (39) |
9 (26) |
NA = not assessed; ER = estrogen receptor; PR = progesterone receptor; HER2 = human epidermal growth factor 2; IDC = invasive ductal carcinoma; ILC = invasive lobular carcinoma.
Pilot study
A pilot study that consisted of measuring the expression of 742 plasma miRNAs in 18 primary breast cancer patients was first conducted. In total, 188 miRNAs were chosen based on their expression levels (mean quantification cycle (Cq) value < 36) in the pilot experiment. Clinicopathological data for these patients and the list of the 188 selected miRNAs are summarized in Table 1 and Supplementary Table 1, respectively.
Evaluation of hemolysis
We first evaluated the quality of our sample collection and preparation. Hemolysis leads to the contamination of plasma with RNA from red blood cells. Absorbance at 414 nm (ABS414), the maximum absorbance of hemoglobin, correlates with the degree of hemolysis. ABS414 was measured for all samples using a NanoDrop. The median ABS414 level was 0.19 ± 0.1, with a hemolysis cut-off value fixed at 0.2. Furthermore, the level of a miRNA highly expressed in red blood cells (miR-451) was compared with the level of a miRNA unaffected by hemolysis (miR-23a), with a ΔCq (miR-23a - miR-451) of more than 5 indicating possible erythrocyte miRNA contamination. The median ΔCq (miR-23a - miR-451) was 2.6 ± 1.5 in our cohort (primary breast cancer group = 3 ± 1.5, control group = 2.1 ± 1.2, breast cancer in remission group = 2.5 ± 1.5, metastatic breast cancer group = 2.8 ± 1.2, gynecologic cancer group = 2.3 ± 1.8). Based on these results, no patients were discarded.
miRNA deregulation is observed in primary as well as metastatic breast cancer patients
When comparing the miRNA profiles of newly diagnosed primary breast cancers to control miRNA profiles, 112 miRNAs were found to be significantly deregulated, with a final set of 107 miRNAs after adjusting the P-value for multiple testing. miR-16 and let-7d were the most up- and downregulated miRNAs, respectively. Global upregulation of miRNA expression was observed in primary breast cancer patients compared to controls (1.35-fold change).
In a second analysis, miRNA profiles from the plasma of patients with metastatic breast cancer were compared to those of the controls. Eighty-four miRNAs were found to be significantly deregulated, with a final set of 53 miRNAs after adjusting the P-value for multiple testing. The most significantly upregulated miRNA was miR-148a, and the most significantly downregulated miRNA was miR-15b. As observed in primary breast cancer samples, global upregulation of miRNA expression was observed in metastatic breast cancer patients when compared to healthy subjects (1.1-fold change).
Statistical analyses were also performed to compare both primary and metastatic breast cancer patient plasma miRNA profiles to controls using the Kruskal-Wallis test. Fifty-six miRNAs were significantly modified in the same manner among primary and metastatic breast cancer patient profiles. miR-16 and let-7d were the most co-deregulated miRNAs.
The results of the statistical analysis are available in Supplementary Table 1.
Design and validation of a diagnostic miRNA signature-based model
The analysis and computational methods relied on several steps, which made use of the random forest algorithm. The random forest algorithm is a supervised learning method that operates by building a large ensemble of decision trees, where each tree is trained on a bootstrap sample from the training data by randomizing the features that are selected at each tree node [30].
A methodology somewhat similar to the algorithmic solution proposed by Geurts et al. [31] was used as shown in Figure 1.
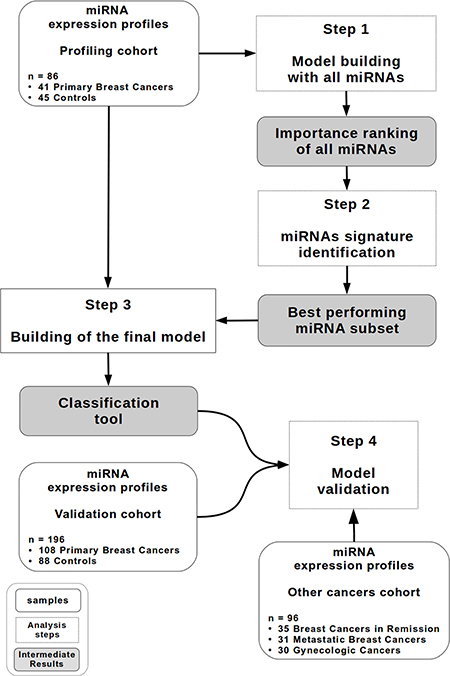
Figure 1: Study design. A diagram describing the random forest-based methodology. The profiling cohort (n = 86) contains 41 patients with primary breast cancer and 45 controls. The validation cohort (n = 196) contains 108 patients with primary breast cancer and 88 controls. The other cancer cohort (n = 96) contains 35 patients with breast cancer in remission, 31 patients with metastatic breast cancer and 30 patients with gynecologic cancer.
1. Model construction and miRNA signature identification
An initial random forests model was built on the profiling cohort (86 samples = 30% of the whole cohort: 41 individuals with primary breast cancer and 45 controls) with the normalized expression values of all 188 miRNAs as features to determine the 25 more discriminant miRNAs. To identify the best miRNA signature, all combinations of miRNAs that can be defined from these 25 miRNAs (33554431 in total) were then evaluated using ten-fold cross-validation on the same profiling cohort (see Materials and methods).
The best miRNA combination is composed of the following 8 miRNAs: miR-16, let-7d, miR-103, miR-107, miR-148a, let-7i, miR-19b, and miR-22*. Figure 2 summarizes the Mann-Whitney U P-values (Figure 2A) and relative expression changes (Figure 2B) for these 8 miRNAs.
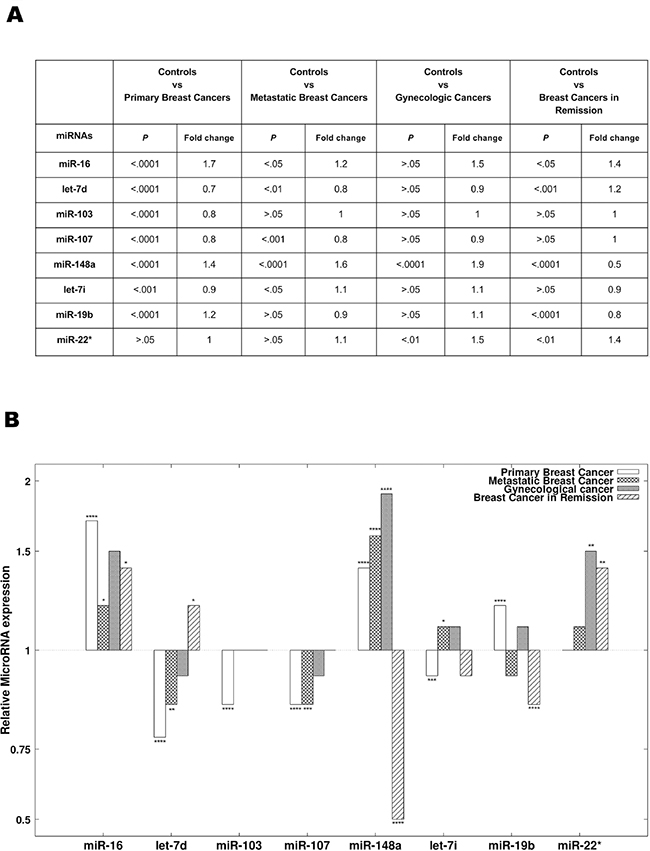
Figure 2: The 8 miRNAs present in the diagnostic signature. (A) The results of statistical analyses comparing the expression of the 8 miRNAs present in the diagnostic signature between different groups. The 8 diagnostic miRNAs were compared between primary breast cancer patients, breast cancer patients in remission, metastatic breast cancer patients, gynecologic cancer patients and the controls. P-values and Benjamini-Hochberg adjusted P-values were obtained using the Mann-Whitney U test. (B) The relative expression (mean fold change) of the 8 diagnostic miRNAs in patients with primary breast cancer, patients with breast cancer in remission, patients with metastatic breast cancer and patients with gynecologic cancer compared to controls.
An area under the curve (AUC) of 0.85 ± 0.02 was obtained when performing the ten-fold cross-validation in the profiling cohort.
A threshold value of 0.68 was chosen to derive a diagnostic rule from the random forest model. The value of 0.68 corresponded to an acceptable trade-off between high sensitivity (> 0.9) and satisfactory specificity (± 0.5).
2. Model validation
The validation of our model in a larger cohort (196 samples = 70% of the whole cohort: 108 individuals with primary breast cancers and 88 controls) yielded an AUC of 0.81 ± 0.01. Figure 3A represents the receiver operating characteristic (ROC) curve obtained by testing the model in the validation cohort.
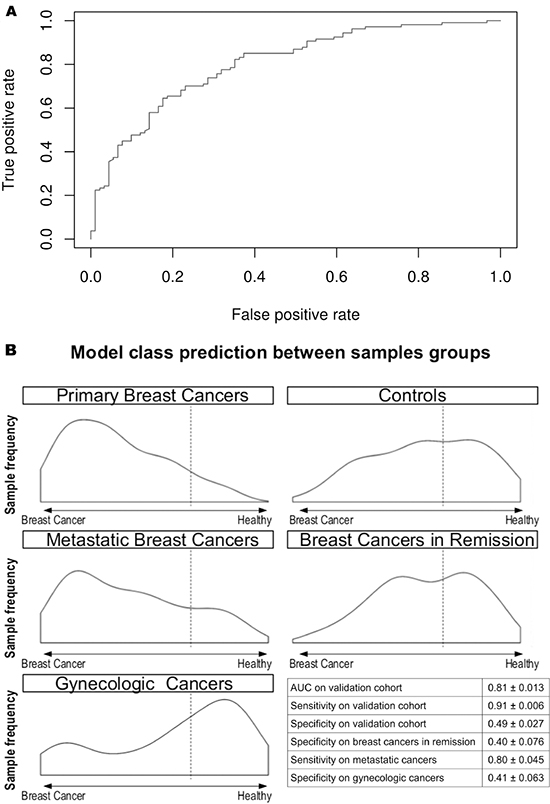
Figure 3: Circulating miRNA-based diagnostic tool performance in the validating cohort. (A) The ROC curve of the diagnostic miRNA model applied to the validating cohort. The AUC obtained is 0.81. (B) Model outcome distributions for the primary breast cancers, controls, metastatic breast cancers, breast cancers in remission, and gynecologic cancers. The x-axis corresponds to the model predictions. The dashed line represents the chosen threshold used to compute the sensitivity and specificity values for each cohort. The table reports the AUC, sensitivity and specificity in the validation cohort and the sensitivity and specificity in the other cancer cohort. The true positive count for the metastatic breast cancers is 25. The true negative count for breast cancers in remission and gynecologic cancers is 14.
With a threshold value of 0.68, a sensitivity value of 0.91 ± 0.01 and a specificity value of 0.49 ± 0.03 were obtained.
The validation of the classification model in the other cancer groups yielded slightly lower values for sensitivity (0.80 ± 0.05 for metastatic breast cancer patients) and specificity (0.40 ± 0.08 for breast cancer patients in remission and 0.41 ± 0.06 for gynecologic cancer patients) (Figure 3B). As shown in Figure 3B, the patients with breast cancer in remission and gynecologic cancer were classified as the control group.
A comparison between the miRNA signature and the established diagnostic methods
Next, we sought to compare the performance of the miRNA signature to mammographic screenings and CA15.3 assays.
The accuracy of mammographic screening is greatly affected by age. Indeed, young women have dense breasts, making the interpretation of mammography more difficult (AUC = 0.69 ± 0.05 for women under the age of 50 yr) [32]. As shown in Figure 4A, the diagnostic accuracy of the miRNA signature does not appear to be affected by age because the AUC remains stable at 0.81 in patients younger than 50 yr.
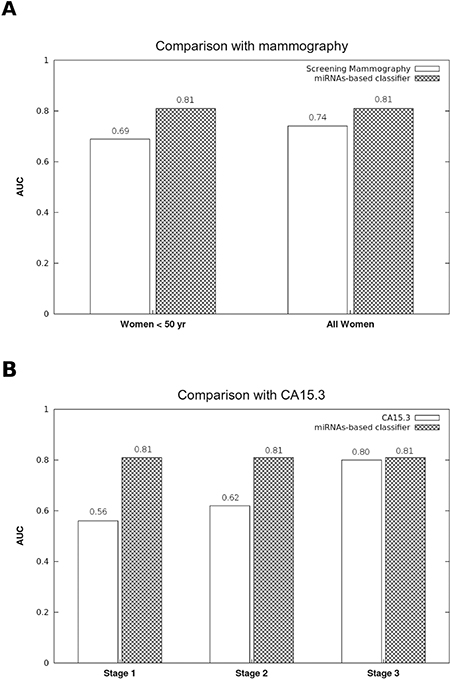
Figure 4: Comparison of the accuracy between the diagnostic miRNA signature, mammographic screenings and CA15.3 assays. (A) While the diagnostic performance of mammographic screenings is weaker in women under 50 yr (32), the AUC of the 8 miRNA-based diagnostic model was stable for women both under and over 50 yr. (B) The CA15.3 assay is not useful for the early diagnosis of breast cancer. While the CA15.3 AUC increases proportionally to the tumor stage (33), our model performance was stable regardless of the tumor stage.
CA15.3 is the only biomarker of breast cancer, and its accuracy is directly influenced by tumor stage, with an AUC ranging from 0.56 in stage I to 0.80 in stage III breast cancers [33]. Therefore, CA15.3 is only useful for the diagnosis of late stage and metastatic breast cancers. Interestingly, tumor stage does not seem to affect the signature miRNA performance, remaining stable at 0.81 from stages I to III (Figure 4B).
miRNA signature does not correlate with breast cancer clinicopathological features
The correlations between the expression of the 8 miRNAs and the following breast cancer clinicopathological markers were computed: estrogen and progesterone receptor expression, HER2 overexpression, tumor size, initial lymph node status, Ki67 index, Scarff-Bloom-Richardson grade and lymphovascular invasion. No significant correlation was obtained using Spearman’s test for continuous variables, and no significant difference was found using the Mann-Whitney U test for binary variables (Supplementary Table 2).
DISCUSSION
Early breast cancer diagnosis is currently possible using mammographic screenings. However, mammographic screening has the following weaknesses: (i) the risk of false positives, with an overdiagnosis rate of up to 19%, exposing women to harmful anti-cancer therapies and affecting their quality of life; (ii) the risk of false negatives, with mammograms missing breast cancer in 17% of cases and in more than 30% of cases for women with dense breasts and for women under hormone replacement therapy; (iii) X-ray radiation from mammograms may be one of the factors that can actually trigger breast cancer in high-risk women, e.g., young women carrying a mutation in the BRCA genes, who require early follow up beginning at 30 years, an age where mammography is less effective, and (iv) mammography performance is operator dependent (34–36).
Thus, a diagnostic test using a blood sample could add useful information. CA15.3, which is the only available biomarker for breast cancer, lacks sensitivity in the case of primary breast tumors [33].
Based on 8 circulating miRNAs, we designed a classification model using a decision tree-based ensemble method, which allows primary breast cancers to be screened with greater accuracy than mammography. Consequently, our 8 circulating miRNA signature may be extremely useful to help clinicians to identify patients with a high probability of breast cancer without using invasive procedures.
The 8 miRNA-based diagnostic model shows the following interesting characteristics for clinical application: (i) this diagnostic test is not affected by age and may be useful for monitoring young women at high risk for breast cancer, in which mammography is not only less effective but also harmful because of irradiation; (ii) unlike CA15.3, this diagnostic model is effective regardless of tumor stage, which allows for detection at an early stage; (iii) this model can detect metastatic breast cancers and shows approximately the same class prediction distribution for breast cancers in remission and for controls (see Figure 3), offering a potential utility for monitoring patients; (iv) this study is the first to validate the robustness of such a classifier tool with respect to gynecologic cancers. Plasma from patients suffering of other prevalent cancers in women (cervix, endometrial and ovary cancers) [1] were used to check if the diagnostic tool could avoid the detection of other types of cancers. Indeed, the test specificity on gynecologic cancers is similar to the specificity of the control group (see Figure 3).
These aspects were overlooked in previous studies that have shown the potential of circulating miRNAs as diagnostic tools for breast cancer detection [12–29]. The signatures that these studies have defined differed greatly from one study to another. These discrepancies can be explained by the use of different analysis methods, sample processing and normalization procedures. In the present paper, we show that the appropriate use of a subset of miRNAs combined with a specific normalization method and classification algorithm yields satisfactory results in multiple cohorts. Although decision tree ensemble methods have been proven to be efficient for the classification of biological samples based on various biomarkers [31], to our knowledge, few studies, and never in the field of breast cancer, have used random forest models with miRNA expression values as input features. Two similar studies have nevertheless shown that random forest perform better than other supervised learning methods using miRNA expression values [37, 38].
A second important concern is the normalization choice because the results of the relative quantification obtained by qPCR are entirely dependent on this process. Most of these studies used miR-16 expression alone as a reference gene [20, 25, 28, 29]. However, miR-16, which is predominantly derived from erythrocytes, has been shown to be prone to artificial elevation by hemolysis [18]. The use of blood cell-derived miRNAs as housekeeping RNA for normalization may be more problematic in cases of anemia, a condition often occurring in breast cancer patients. Meanwhile, global normalization methods have been described to best fit with qPCR analysis [39] but to lead to poor performances in discriminating healthy and cancer patients [17]. In this study, we compared different normalization methods, revealing that the mean of the 50 most expressed plasma miRNAs is more stable than many other normalization methods and allows for good discriminating performances. Interestingly, using this method, our analyses revealed that miR-16 and miR-103, which have been used in other studies as endogenous control genes, are differentially expressed in the plasma from healthy samples and cancer patients [12, 21].
Most of the 8 miRNAs that are part of the diagnostic signature are related to well-described cancer deregulation and were demonstrated to be differentially expressed in breast cancer tumoral tissues [40–44]. However, circulating miRNAs rarely show correlated levels with their tumoral expression [26]. In consequence, the miRNA composition of the diagnostic signature does not allow any conclusion on their biological functions.
Aside from the 8 miRNAs selected for our signature, several other combinations, most of which were composed of more than 8 miRNAs, yielded comparable performances. This finding can be explained by the fact that several miRNAs are often deregulated in the same manner under certain conditions, thus allowing one miRNA to be replaced by another miRNA in a specific signature. Regarding independent validation, it can be noted that, among these alternative combinations, one in particular was made of 11 miRNAs, which were measured in the serum of 54 individuals in another independent study [12]. The performance of a diagnostic model built using this alternative combination has been assessed using both our data (plasma) and the dataset GSE42128 from Chan et al. (serum), yielding close results (respective AUCs of 0.80 ± 0.02 and 0.77 ± 0.07, see Supplementary Table 3). Unfortunately, one of the miRNAs present in our original signature is absent from the data from Chan et al., preventing us from testing the original signature.
Regarding the potential prognostic value of the 8-miRNA signature, the available follow-up of the cohorts is insufficient to determine whether the expression of the miRNAs can be correlated with progression-free or overall survival. Since there is no correlation between the expression of the 8 diagnostic miRNAs and the currently used clinicopathological factors of breast cancer, the prognostic role of the miRNA signature cannot be established on that base.
In conclusion, we established an accurate miRNA-based model for the non-invasive screening of primary breast cancer. This model also allows the identification of metastatic breast cancer and the classification of breast cancer patients in remission in the healthy group and therefore may be useful for monitoring patients. Moreover, the performance of this test is not affected by the age of the patient or by the tumor stage.
MATERIALS AND METHODS
Ethical concerns
Ethic approval was obtained from the Institutional Review Board (Ethical Committee of the Faculty of Medicine of the University of Liège) in compliance with the Declaration of Helsinki. All patients signed a written informed consent form. This work consisted of a prospective study and did not lead to any changes in the treatments of enrolled patients.
Plasma samples
Blood samples were withdrawn in 9 ml EDTA tubes. Plasma was prepared within 1 h by retaining the supernatant after double centrifugation at 4°C (10 min at 815 × g and 10 min at 2500 × g) and was stored at –80°C. The absorbance at 414 nm (ABS414) was measured for all samples using a NanoDrop to evaluate the degree of hemolysis.
RNA extraction and miRNA qRT-PCR
The essential MIQE guidelines were followed during specimen preparation [45].
Circulating miRNAs were purified from 100 μl of whole-plasma using a miRNeasy Mini Kit (Qiagen, Germany) according to the manufacturer’s instructions. The standard protocol was modified based on Kroh’s recommendations [46]. MS2 (Roche, Belgium) was added to the samples as a carrier, and cel-miR-39 and cel-miR-238 were added as spike-ins. RNA was eluted in 50 μl of RNase-free water at the end of the procedure.
Reverse transcription was performed using a miRCURY LNA™ Universal RT microRNA PCR, Polyadenylation and cDNA Synthesis Kit (Exiqon, Denmark). Quantitative PCR was performed according to the manufacturer’s instructions on custom panels of 188 selected miRNAs (Pick-&-Mix microRNA PCR Panels, Exiqon). Controls included the reference genes described in the text, inter-plate calibrators in triplicate (Sp3) and negative controls.
All PCR reactions were performed using an Applied Biosystems 7900HT Real-Time PCR System (Applied Biosystems, USA). miRNAs with Cq values < 36 were considered for analysis.
Data analysis
Analyses were conducted using the 2–ΔCq method (ΔCq = Cqsample – Cqreference gene) for each sample to obtain a normalized expression value [47].
The data were normalized using the ΔCq method as recommended by Mestdagh et al. [39]. The mean Cq of the 50 miRNAs with the highest mean expression as determined in all the patients from all the cohorts was used for normalization because it was the most stable reference gene according to the GeNorm software. The list of the 50 miRNAs and the results of the GeNorm analysis are available in Supplementary Table 4. The whole processes of miRNA signature identification and decision tree building were also conducted on datasets normalized by 12 alternative methods. The best performances were obtained with the normalization by the mean Cq of the 50 most expressed miRNAs. The alternative normalization were: raw data, mean Cq of the 10, 20, 30 or 40 miRNAs with the highest mean expression, the mean Cq of the 50 miRNAs with the highest mean expression minus the four miRNAs that are present in the signature; the mean Cq of the spike-cel-miR-39 and the U6 small RNA; the mean Cq of miR-15b* and miR-125b (the most stable combination according to NormFinder); the global mean Cq; miR-16; the mean Cq of miR-103 and miR-191; and miR-93.
Furthermore, the delta Cq (miR-23a - miR-451) was determined for each sample to evaluate the risk of hemolysis as recommended by Blondal et al. [48].
Finally, data homogeneity was tested to detect outliers. Patients presenting extreme values (mean ± 3 sigma) were discarded. This operation led to the elimination of one patient from the analysis.
Statistical analyses were performed with R version 3.0.1 (R Core Team (2012). R: A language and environment for statistical computing. R Foundation for Statistical Computing, Vienna, Austria. ISBN 3–900051–07–0, URL: http://www.R-project.org/). To compare miRNA expression levels, two-sided Mann-Whitney U tests and Kruskal-Wallis one-way tests were used. To correlate the expression of the 8 diagnostic miRNAs and the clinicopathological markers in primary breast cancer patients, Spearman’s tests were used for continuous variables. Statistical significance was established as *P < 0.05 **P < 0.01 ***P < 0.001 or ****P < 0.0001. All represented values were adjusted for multiple testing using the Benjamini-Hochberg procedure [49]. The results of the statistical analyses for selected miRNAs are summarized in Supplementary Tables 1 and 2.
Study design
For all steps of the method, an R implementation of Breiman’s original random forest algorithm, which was provided in the R package randomForest, was used [50]. A methodology somewhat similar to the algorithmic solution proposed by Geurts et al. was used [31] as shown in Figure 1. The different steps are described in detail below.
1. Model building with all miRNAs
An initial random forests model was built on the profiling cohort (86 samples: 41 individuals with primary breast cancer and 45 controls) with the normalized expression values of all 188 miRNAs as features. A conservative value of 3000 for ntree (number of trees in the random forest) was chosen for all steps of the construction of random forest models using our methodology. Because no significant performance change was observed for incremental values of mtry (number of variables randomly sampled as candidates at each split), a default value of  was chosen for all steps of the construction of random forest models using our methodology. A combined ranking for all 188 miRNAs based on the model importance metrics MDA (Mean Decrease in Accuracy) and MDG (Mean Decrease in Gini) was obtained through the construction of this first model.
2. miRNA signature identification
Variable selection in classification or regression methods constitutes a classical problem related to 2 distinct objectives: (i) Finding relevant variables linked to the classifier output, for interpretation purposes (in this case, finding an ensemble of miRNAs related to breast cancer), (ii) Finding a sufficiently small number of variables as to avoid over-fitting, improve model performance, and provide more cost-effective models (both in terms of computation and implementation) [51, 52]. These 2 objectives may often be contradictory, since the first one will be directed to highlighting all important variables, even if these variables are redundant, while the second one aims to limit the number of variables in the final model. We are aiming for the second objective. One variable selection method for random forests, specifically targeting the second objective, is iterative variable elimination [38, 53], where variables with the smallest importance metric are iteratively discarded until reaching a minimum out-of-bag (OOB) error. Based on the definition of MDA provided earlier and the R implementation of the random forests algorithm, this feature selection method is roughly equivalent to the iterative elimination of variables with the lowest MDA metric. Another variable selection methodology works the other way round, by iteratively adding variables in candidate models, based on their importance metric, computed on a previous complete model, and stopping the addition of variables when the model accuracy reaches a maximum [31, 54]. Here, we use a more exhaustive wrapper approach, where a large subset of m variables is first selected based on the two variable importance metrics (the OOB-related importance metric MDA, but also the Gini coefficient related importance metric MDG) provided by the R implementation of the random forests algorithm, and secondly all c possible combinations of 1 to m variables from this subset are considered as possible features of a potential classifier, where c = 2m − 1 combinations. This approach thus differs in the fact that it constitutes an exhaustive method, which will test a very large number of combinations. Each of these potential classifiers is cross-validated (with ten folds) to determine the variables combination (also called “signature”) yielding the best performing model (where model performance is measured by the AUC). Since the goal of this study is the design of a usable and affordable diagnostic tool, a limited value of m = 25 has been chosen (leading to c = 33554431). This number corresponds to threshold values of 0.001 and 1 respectively for variable importance metrics MDA and MDG. This limited value of m = 25 constitutes a trade-off between an exhaustive testing of the solution space and the time and computational limitations related to a diagnostic test.
3. Building the final model
A random forest model was built on the profiling cohort using the best performing miRNA subset. This classification tool constituted the final diagnostic model. The number of trees chosen to build each model was determined as in step 1, and a default value of  was chosen (i.e. mtry = 3).
The prediction of the random forest algorithm for a sample is a numerical value representing the probability for this sample to be part of a specific class (case or control). To derive a binary diagnostic rule from this numerical score, a specific threshold was picked to separate the 2 classes, and the specificity and sensitivity values of the corresponding rule were computed.
4. Model validation
Then, the classification tool was validated in a larger cohort with similar cases – controls ratio as in the profiling cohort. The total number of samples was 2.3 times greater than profiling cohort (196 samples: 108 individuals with primary breast cancers and 88 controls).
An AUC was obtained through this validation. Sensitivity and specificity values were computed using the threshold defined using the profiling cohort.
The classification tool was also validated in a separate cohort consisting of 35 individuals with breast cancer in remission, 31 patients with metastatic breast cancer and 30 patients with gynecologic cancers.
List of abbreviations
3′-UTR = 3′-untranslated region
ABS414 = absorbance at 414 nm
AUC = area under the curve
Cq = quantification cycle
DNA = deoxyribonucleic acid
gDNA = genomic DNA
HER2 = human epidermal growth factor 2
LNA = locked nucleic acid
MDA = mean decrease accuracy
MDG = mean decrease Gini
miRNAs = microRNAs
mRNAs = messenger RNAs
NA = not assessed
Ns = non-significant
OOB = out-of-bag
RNA = ribonucleic acid
ROC = receiver operating characteristic
ACKNOWLEDGMENTS
We thank Olivier Dengis, Tiberio Sticca, Sonia El Guendi, Bouchra Boujemla, the GIGA-imagery-platform, the GIGA-immunohistology-platform, the team of medical oncologists and the Biothèque of CHU Liège.
GRANT SUPPORT
PF is a F.R.S.-FNRS PhD fellow. SW is a P.D.R.-FNRS PhD fellow. This work was supported by the French Community of Belgium, the Belgian Funds for Scientific Research (F.R.S.-FNRS), the F.R.S.-FNRS-Televie, CHU Liege (F.I.R.S) and the Region Wallone (Secance, BRAMIR).
CONFLICTS OF INTEREST
None.
REFERENCES
1. Jemal A, Bray F, Center, Melissa M., Ferlay J, Ward E, Forman D. Global cancer statistics. CA Cancer J Clin. 2011; 61:69–90.
2. Bleyer A, Welch HG. Effect of Three Decades of Screening Mammography on Breast-Cancer Incidence. N Engl J Med. 2012; 367:1998–2005.
3. Kohn L, Mambourg F, Robays J, Albertijn M, Janssens J, Hoefnagels K, Ronsmans M, Jonckheer P. Informed choice on breast cancer screening: messages to support informed decision. Good Clinical Practice (GCP) Brussels: Belgian Health Care Knowledge Centre (KCE). 2014. KCE Reports 216. D/2014/10.273/03.
4. Eulalio A, Huntzinger E, Izaurralde E. Getting to the Root of miRNA-Mediated Gene Silencing. Cell. 2008; 132:9–14.
5. Friedman RC, Farh KK-H, Burge CB, Bartel DP. Most mammalian mRNAs are conserved targets of microRNAs. Genome Res. 2009; 19:92–105.
6. Bartel DP. MicroRNAs: genomics, biogenesis, mechanism, and function. Cell. 2004; 116:281–97.
7. Ambros V. The functions of animal microRNAs. Nature. 2004; 431:350–5.
8. Lu J, Getz G, Miska EA, Alvarez-Saavedra E, Lamb J, Peck D, Sweet-Cordero A, Ebert BL, Mak RH, Ferrando AA, Downing JR, Jacks T, Horvitz HR, et al. MicroRNA expression profiles classify human cancers. Nature. 2005; 435:834–838.
9. Mathivanan S, Ji H, Simpson RJ. Exosomes: Extracellular organelles important in intercellular communication. Journal of Proteomics. 2010; 73:1907–20.
10. Kosaka N, Iguchi H, Ochiya T. Circulating microRNA in body fluid: a new potential biomarker for cancer diagnosis and prognosis. Cancer Science. 2010; 101:2087–92.
11. Mitchell PS, Parkin RK, Kroh EM, Fritz BR, Wyman SK, Pogosova-Agadjanyan EL, Peterson A, Noteboom J, O’Briant KC, Allen A, Lin DW, Urban N, Drescher CW, et al. Circulating microRNAs as stable blood-based markers for cancer detection. Proc Natl Acad Sci USA. 2008; 105:10513–8.
12. Chan M, Liaw CS, Ji SM, Tan HH, Wong CY, Thike AA, Tan PH, Ho GH, Lee AS-G. Identification of circulating microRNA signatures for breast cancer detection. Clin Cancer Res. 2013; 19:4477–87.
13. Cuk K, Zucknick M, Heil J, Madhavan D, Schott S, Turchinovich A, Arlt D, Rath M, Sohn C, Benner A, Junkermann H, Schneeweiss A, Burwinkel B. Circulating microRNAs in plasma as early detection markers for breast cancer. Int J Cancer. 2013; 132:1602–12.
14. Guo L, Zhao Y, Yang S, Cai M, Wu Q, Chen F. Genome-wide screen for aberrantly expressed miRNAs reveals miRNA profile signature in breast cancer. Mol Biol Rep. 2013; 40:2175–86.
15. Heneghan HM, Miller N, Kelly R, Newell J, Kerin MJ. Systemic miRNA-195 Differentiates Breast Cancer from Other Malignancies and Is a Potential Biomarker for Detecting Noninvasive and Early Stage Disease. The Oncologist. 2010; 15:673–82.
16. Hu Z, Dong J, Wang L-E, Ma H, Liu J, Zhao Y, Tang J, Chen X, Dai J, Wei Q, Zhang C, Shen H. Serum microRNA profiling and breast cancer risk: the use of miR-484/191 as endogenous controls. Carcinogenesis. 2012; 33:828–34.
17. Kodahl AR, Lyng MB, Binder H, Cold S, Gravgaard K, Knoop AS, Ditzel HJ. Novel circulating microRNA signature as a potential non-invasive multi-marker test in ER- positive early-stage breast cancer: A case control study. Mol Oncol. 2014; 8:874–83.
18. Leidner RS, Li L, Thompson CL. Dampening enthusiasm for circulating microRNA in breast cancer. PLoS One. 2013; 8:e57841.
19. Ng EKO, Li R, Shin VY, Jin HC, Leung CPH, Ma ESK, Pang R, Chua D, Chu KM, Law WL, Law SYK, Poon RTP, Kwang A. Circulating microRNAs as Specific Biomarkers for Breast Cancer Detection. PLoS One. 2013; 8:e53141.
20. Roth C, Rack B, Müller V, Janni W, Pantel K, Schwarzenbach H. Circulating microRNAs as blood-based markers for patients with primary and metastatic breast cancer. Breast Cancer Res. 2010; 12:R90.
21. Shen J, Hu Q, Schrauder M, Yan L, Wang D, Medico L, Guo Y, Yao S, Zhu Q, Liu B, Qin M, Beckmann MW, Fasching PA, et al. Circulating miR-148b and miR-133a as biomarkers for breast cancer detection. Oncotarget. 2014; 5:5284. doi:10.18632/oncotarget.2014.
22. Wang F, Zheng Z, Guo J, Ding X. Correlation and quantitation of microRNA aberrant expression in tissues and sera from patients with breast tumor. Gynecologic Oncology. 2010; 119:586–93.
23. Wu Q, Wang C, Lu Z, Guo L, Ge Q. Analysis of serum genome-wide microRNAs for breast cancer detection. Clinica Chimica Acta. 2012; 413:1058–65.
24. Zearo S, Kim E, Zhu Y, Zhao JT, Sidhu SB, Robinson BG, Soon PSH. MicroRNA-484 is more highly expressed in serum of early breast cancer patients compared to healthy volunteers. BMC Cancer. 2014; 14:200.
25. Zhao H, Shen J, Medico L, Wang D, Ambrosone CB, Liu S. A pilot study of circulating miRNAs as potential biomarkers of early stage breast cancer. PLoS One. 2010; 5:e13735.
26. Zhu J, Zheng Z, Wang J, Sun J, Wang P, Cheng X, Fu L, Zhang L, Wang Z, Li Z. Different miRNA expression profiles between human breast cancer tumors and serum. Front Genet. 2014; 5:149.
27. Stückrath I, Rack B, Janni W, Jäger B, Pantel K, Schwarzenbach H. Aberrant plasma levels of circulating miR-16, miR-107, miR-130a and miR-146a are associated with lymph node metastasis and receptor status of breast cancer patients. Oncotarget. 2015; 6:13387. doi:10.18632/oncotarget.3874.
28. Schrauder MG, Strick R, Schulz-Wendtland R. Circulating micro-RNAs as potential blood-based markers for early stage breast cancer detection. PLoS One. 2012; 7:e29770.
29. Cookson VJ, Bentley MA, Hogan B V, Horgan K, Hayward BE, Hazelwood LD, Hughes TA. Circulating microRNA profiles reflect the presence of breast tumours but not the profiles of microRNAs within the tumours. Cell Oncol. 2012; 35:301–8.
30. Breiman L. Random Forests. Machine Learning. 2001; 45:5–32.
31. Geurts P, Fillet M, de Seny D, Meuwis M-A, Malaise M, Merville M-P, Wehenkel L. Proteomic mass spectra classification using decision tree based ensemble methods. Bioinformatics. 2005; 21:3138–45.
32. Pisano ED, Gatsonis C, Ph D, Hendrick E, Yaffe M, Baum JK, Acharyya S, Conant EF, Fajardo LL, Bassett L, Orsi CD, Jong R, Rebner M. Diagnostic Performance of Digital versus Film Mammography for Breast-Cancer Screening. N Engl J Med. 2005; 353:1773–83.
33. Gion M, Mione R, Leon AE, Lüftner D, Molina R, Possinger K, Robertson JF. CA27.29: a valuable marker for breast cancer management. A confirmatory multicentric study on 603 cases. Eur J Cancer. 2001; 37:355–363.
34. Marmot MG, Altman DG, Cameron DA, Dewar JA, Thompson SG, Wilcox M. The benefits and harms of breast cancer screening: an independent review. British Journal of Cancer. 2013; 108:2205–40.
35. Yankaskas BC, Taplin SH, Ichikawa L, Geller BM, Rosenberg RD, Carney PA, Kerlikowske K, Ballard-Barbash R, Cutter GR, Barlow WE. Association between mammography timing and measures of screening performance in the United States. Radiology. 2005; 234:363–73.
36. Théberge I, Chang S-L, Vandal N, Daigle J-M, Guertin M-H, Pelletier E, Brisson J. Radiologist interpretive volume and breast cancer screening accuracy in a Canadian organized screening program. J Natl Cancer Inst. 2014; 106:djt461.
37. Cheng L, Doecke JD, Sharples RA, Villemagne VL, Fowler CJ, Rembach a, Martins RN, Rowe CC, Macaulay SL, Masters CL, Hill AF. Prognostic serum miRNA biomarkers associated with Alzheimer’s disease shows concordance with neuropsychological and neuroimaging assessment. Mol Psychiatry. 2014:1–9.
38. Hemphill E, Lindsay J, Lee C, Măndoiu II. Feature selection and classifier performance on diverse bio-logical datasets. BMC Bioinformatics. 2014; 15:S4.
39. Mestdagh P, Van Vlierberghe P, De Weer A, Muth D, Westermann F, Speleman F, Vandesompele J. A novel and universal method for microRNA RT-qPCR data normalization. Genome Biol. 2009; 10:R64.
40. Janaki Ramaiah M, Lavanya A, Honarpisheh M, Zarea M, Bhadra U, Bhadra MP. MiR-15/16 complex targets p70S6 kinase 1 and controls cell proliferation in MDA- MB-231 breast cancer cells. Gene. 2014; 552:255–64.
41. Büssing I, Slack FJ, Großhans H. let-7 microRNAs in development, stem cells and cancer. Trends in Molecular Medicine. 2008; 14:400–9.
42. Martello G, Rosato A, Ferrari F, Manfrin A, Cordenonsi M, Dupont S, Enzo E, Guzzardo V, Rondina M, Spruce T, Parenti AR, Daidone MG, Bicciato S, et al. A MicroRNA targeting dicer for metastasis control. Cell. 2010; 141:1195–207.
43. Olive V, Sabio E, Bennett MJ, De Jong CS, Biton A, McGann JC, Greaney SK, Sodir NM, Zhou AY, Balakrishnan A, Foth M, Luftig MA, Goga A, et al. A component of the mir-17–92 polycistronic oncomir promotes oncogene-dependent apoptosis. Elife. 2013; 2:e00822.
44. Tao S, He H, Chen Q, Yue W. GPER mediated estradiol reduces miR-148a to promote HLA-G expression in breast cancer. Biochem Biophys Res Commun. 2014; 451:74–8.
45. Bustin SA, Benes V, Garson JA, Hellemans J, Huggett J, Kubista M, Mueller R, Nolan T, Pfaffl MW, Shipley GL, Vandesompele J, Wittwer CT. The MIQE guidelines: minimum information for publication of quantitative real-time PCR experiments. Clin Chem. 2009; 55:611–22.
46. Kroh EM, Parkin RK, Mitchell PS, Tewari M. Analysis of circulating microRNA biomarkers in plasma and serum using quantitative reverse transcription-PCR (qRT-PCR). Methods. 2010; 50:298–301.
47. Schmittgen TD, Livak KJ. Analyzing real-time PCR data by the comparative CT method. Nature Protocols. 2008; 3:1101–8.
48. Blondal T, Jensby Nielsen S, Baker A, Andreasen D, Mouritzen P, Wrang Teilum M, Dahlsveen IK. Assessing sample and miRNA profile quality in serum and plasma or other biofluids. Methods. 2013; 59:S1–6.
49. Benjamini Y, Hochberg Y. Controlling the False Discovery Rate: A Practical and Powerful Approach to Multiple Testing. J R Stat Soc Ser B. 1995; 57:289–300.
50. Liaw A, Wiener M. Classification and regression by randomForest. R news. 2002; 2:18–22.
51. Genuer R, Poggi J-M, Tuleau-Malot C. Variable selection using random forests. Pattern Recognition Letters. 2010; 31:2225–36.
52. Saeys Y, Inza I, Larrañaga P. A review of feature selection techniques in bioinformatics. Bioinformatics. 2007; 23:2507–17.
53. Díaz-Uriarte R, de Andrés SA. Gene selection and classification of microarray data using random forest. BMC Bioinformatics. 2006; 7:3.
54. Ghattas B, Ben Ishak A. Sélection de variables pour la classification binaire en grande dimension: comparaisons et application aux données de biopuces. Journal de la société française de statistiques. 2008; 149:43–66.