
INTRODUCTION
Esophageal cancer, mainly including squamous cell carcinoma and adenocarcinoma, is the sixth leading cause of cancer-related death and the eighth most common cancer worldwide [1, 2]. It is considered as a serious malignancy with respect to its extremely aggressive histopathological features and poor survival rate [3]. Esophageal squamous cell carcinoma (ESCC), which mainly occurs in an area referred to the “esophageal cancer belt” that extends from northeast China to the Middle East [4], constitutes the vast majority of cases (more than 90%) [5, 6]. Dietary and environmental factors, such as smoking, alcohol consumption, obesity, chronic irritation and high levels of nitrates in the soil and drinking water, are strongly believed to be associated with the occurrence of ESCC [1, 7]. Currently, surgical removal remains the most commonly employed treatment for patients with ESCC. However, the success of surgery strongly depends on early diagnosis. Current reliable diagnostic biomarkers are very limited in clinic [8]. With the increasing understanding of genetic and epigenetic mechanisms of the carcinogenesis, many studies indicated that highly sensitive and specific molecular biomarkers would help to optimize the clinical management of esophageal carcinomas and improve patient outcomes.
DNA methylation, as a gene silencing mechanism, plays essential roles in several developmental and cellular processes such as transcription, embryonic development, X-chromosome inactivation and genomic imprinting[9-11]. In mammals, DNA methylation occurs almost exclusively at the 5’-carbon position of cytosine residues within CpG pairs, and has a profound effect on gene expression[12]. The methylation of gene promoter region inhibits the binding of some transcription factors, which usually contain a methylated-DNA binding domain, resulting in transcriptional repression. Many tumor suppressor genes (TSGs), such as CDKN2A, FHIT, MGMT, RASSF1A, CDH1 and APC, have been reported to be silenced by promoter hypermethylation in the development of breast cancer [13], lung cancer[14, 15], thymic epithelial tumors[16], colorectal cancer[17, 18] and ESCC [19]. On the other hand, some of the oncogenes, such as GADD45A, were abnormally activated by hypomethylated changes, contributing to the occurrence of ESCC [20, 21].
Although previous studies have provided many clues to understand the relationship between DNA methylation and gene regulation in the development of ESCC, the information is still very limited. In order to acquire quantitative and qualitative information on DNA methylation, a wide range of approaches have been developed. The high-throughput sequencing (or next-generation sequencing) technologies has dramatically improved sequencing capabilities through the massive parallelization of reactions on millions of DNA fragments at once[22]. Methylated DNA immunoprecipitation (MeDIP) is a large-scale purification technique used for enrichment of methylated DNA sequences via an antibody against 5-methylcytosine (5-mC). Therefore, a novel method termed methylated DNA immunoprecipitation sequencing (MeDIP-Seq) has emerged as an advantageous tool for identifying methylated CpG-rich sequences much faster than ever before[23].
To investigate the genome-wide profiling of DNA methylation and gene expression in ESCC, MeDIP-Seq and quantitative measurements of transcriptomes (RNA-Seq) were performed in this study. Owing to the tremendous progress in next-generation sequencing technology, MeDIP-Seq and RNA-Seq can offer higher resolution, less noise and greater coverage results [23-25]. The combination of MeDIP-Seq and RNA-Seq may provide more information about genome-wide epigenetic regulation in gene expression and will bring new insight on the DNA methylation in the development of ESCC.
RESULTS
High-throughput MeDIP sequencing analysis
We isolated genomic DNA from 4 pairs of ESCC and NE tissue samples, and then put equal amounts of genomic DNA of 4 individuals into one pool for each group (the ESCC group and the NE group). The MeDIP-Seq was conducted on the two groups using the Hiseq 2000 sequencing system, which provided high accuracy and unprecedented output.
In total, we obtained about 86 million clean 49-bp reads after sequencing. And the unique mapping rates satisfied the requirements. In the ESCC group, 90.89 % of the reads could be mapped to human genome and 73.26% were uniquely mapped to human genome. While in NE group, 88.85% of the reads could be mapped to the human genome and 68.43% could be uniquely mapped to the human genome (Table 1 and Supplementary Fig. S1). To understand the global DNA methylation status in ESCC, we directly compared the overall distribution of reads at 1kb resolution level. The CpG o/e values were calculated to reflect the CpG density of specific regions[26]. As expected, both hypermethylated and hypomethylated changes were found in ESCC samples compared to NE (Figure 1). Model-based analysis of ChIP-Seq (MACS)[27] identified 286,272 and 260,746 regions (peaks) from the ESCC and NE MeDIP-Seq data, respectively. The average length of peaks varied from 1,095 bp (ESCC) to1, 124 bp (NE). Peak-based differential analysis was conducted for gene elements that were covered by two groups and exhibited a greater than 2-fold change in methylation and a p-value of less than 0.01 (Table 2 and Supplementary Fig. S2).
Table 1: Number of reads generated by MeDIP-seq for each group
Sample group |
Total number of reads |
Total number of mapped reads |
Mapping rate(%) |
Total number of unique mapped reads |
Unique mapping rate (%) |
|---|---|---|---|---|---|
ESCC |
85,714,286 |
77,904,067 |
90.89 |
62,791,726 |
73.26 |
NE |
85,714,286 |
76,156,660 |
88.85 |
58,652,189 |
68.43 |
Table 2: Number of peak-related differences in gene methylation identified between groups
# of genes |
NE vs ESCC (up-regulated) |
NE vs ESCC (down-regulated) |
|---|---|---|
Upstream 2K |
960 |
52 |
5’UTR |
322 |
28 |
CDS |
2071 |
193 |
Intron |
6702 |
1455 |
3’UTR |
635 |
40 |
Downstream 2K |
864 |
42 |
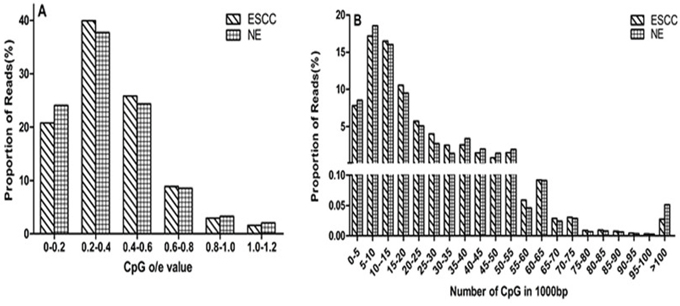
Figure 1: Distribution of reads varies CpG density. A. Distribution of reads varies CpG o/e value. The x axis indicates the range of CpG o/e values and the y axis indicates the proportion of reads in a specific range. CpG o/e value can reflect the CpG density of a specific region. DNA hypermethylation may have lower CpG o/e value, while hypomethylation maintain high o/e value. B. Overall distribution of reads at 1kb resolution level varies CpG density. The x axis indicates the CpG density and the y axis indicates the proportion of reads.
The main goal of this study was to identify local differentially methylated regions (DMRs) between ESCC and NE groups in a genome-wide level. In total we identified 26,081 DMRs, 87.6% of them were hypermethylated and 12.4% of them were hypomethylated relative to NE group. The distribution of the DMRs showed that most of the DMRs were located at gene body (Table 3). Gene ontology (GO) analysis of genes with DMRs was also conducted, for both hypermethylated and hypomethylated genes (Supplementary Fig. S3).
Table 3: Number of DMRs in six characteristic genomic areas
Genomic areas |
Hypermethylated |
Hypomethylated |
|---|---|---|
Upstream 2K |
1094 |
64 |
5’UTR |
378 |
32 |
CDS |
2792 |
224 |
Intron |
16932 |
2824 |
3’UTR |
727 |
47 |
Downstream 2K |
915 |
52 |
Validation of the MeDIP-Seq results
Four genes were selected to validate the results of the MeDIP-Seq: MLH1, CDH5, TWIST1 and CDX1. We mainly focus on the DMRs located at promoter region, which may contribute the regulation of gene expression. The starting and ending point of the DMRs of these four genes, the CG sites and the primers are showed in Supplementary Table S1.
Of the18 CpG sites from MLH1 DMR region, 9 continuous clustered CpG loci (-52, -54, -64, -71, -88, -102, -111, -142, -148) were identified to be significantly hypermethylated in ESCC samples than that in NE samples (0.707±0.133 vs 0.302±0.09, p<0.001; Fig. 2A and 2B). Compared to NE, CDH5 DMR region were also significantly hypermethylated in ESCC samples (0.663±0.086 vs 0.247±0.084, p<0.001; Fig. 2A and 2C).
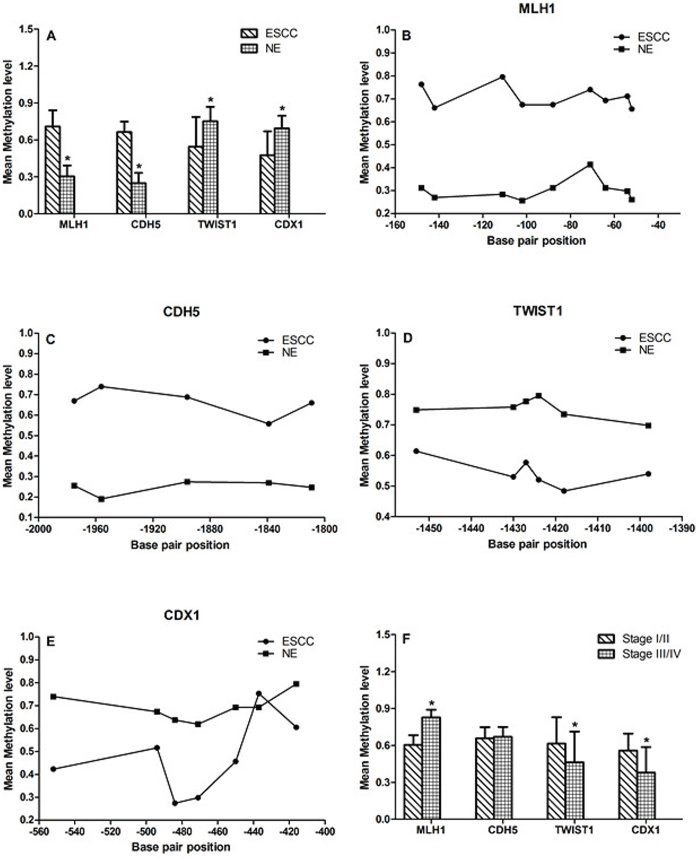
Figure 2: DNA methylation at genes locus. A, B and C. Compare to NE group, the MLH1 and CDH5 were significantly hypermethylated in ESCC samples (0.707±0.133 vs 0.302±0.09, p<0.001; 0.663±0.086 vs 0.247±0.084, p<0.001). A, D and E. Compare to NE group, TWIST1 and CDX1 were significantly hypomethylated in ESCC samples (0.544±0.241 vs 0.752±0.117, p<0.001; 0.475±0.194 vs 0.693±0.102, p<0.001). F. DNA methylation level of MLH1, TWIST1 and CDX1 were related to TNM stage.
There were no significant differences in the DNA methylation status of all the 13 CpG sites of the TWIST1 DMR region (-1500bp~-1320), however, 6 continuous clustered CpG loci (-1398, -1418, -1424, -1427, -1430, -1453) showed hypomethylated changes in ESCC samples (0.544±0.241 vs 0.752±0.117, p<0.001; Fig. 2A and 2D). Moreover, significant hypomethylation of CDX1 DMR region were also found in the ESCC group compared to NE group (0.475±0.194 vs 0.693±0.102, p<0.001; Fig. 2A and 2E).
The DNA methylation level of MLH1, TWIST1 and CDX1 were related to TNM stage (MLH1: p<0.001; CDH5: p=0.636; TWIST1: p=0.038; CDX1: p=0.002; Fig. 2F). There was no significant correlation between DNA methylation levels and tumor histological differentiation.
Identification of gene expression by RNA-Seq
RNA-Seq was performed to investigate the genome-wide expression changes in ESCC and adjacent NE. The sequencing provided us about 26.5 million clean 49-bp reads. In ESCC, 88.28% of the reads were mapped to the human genomic sequence with no more than two mismatches and 82.66 % were uniquely mapped to the human genome, while in NE library, 88.78 % of the reads were mapped to the human genomic sequence and 83.92 % could be uniquely mapped (Table 4). For genes with multiple transcripts, we chose the longest transcript for further analysis.
Table 4: Number of reads generated by RNA-seq for each group
Sample group |
Total number of reads |
Total number of mapped reads |
Mapping rate(%) |
Total number of unique mapped reads |
Unique mapping rate (%) |
|---|---|---|---|---|---|
ESCC |
26,708,458 |
23,578,386 |
88.28 |
22,077,327 |
82.66 |
NE |
26,552,622 |
23,573,912 |
88.78 |
22,283,765 |
83.92 |
Gene expression was initially estimated by calculating the density of uniquely mapped reads as “reads per kilo base of exon model per million mapped reads” (RPKM). Differentially expressed genes (DEGs) were identified by using a threshold of 0.1 % false discovery rate (FDR) and |log2ratio|≥1 (ratio = treated/control RPKM). A total of 6150 genes (3423 up-regulated and 2727 down-regulated) were differentially expressed between ESCC and NE groups (Fig. 3 and Supplementary Fig. 2). To study biological functions, GO analysis was performed on the differentially expressed genes with p values < 0.005[28]. The significant GO terms showed that these DEGs were related to many biological processes and molecular functions (Fig. 4 and Supplementary Fig. 3). Most of these terms were closely related to the cell differentiation, adhesion, cell proliferation, response to DNA damage, or DNA replication. Among these DEGs, we identified many previously described tumor-related genes, such as MLH1, CDKN2A, DAPK1, CDX1, TWIST1, CDH5 and CXCL5 [29-33]. The KEGG pathway analysis showed that these DEGs were involved in 197 pathways. Among these pathways, 33 showed significant (Q<0.05) enrichment of DEGs in ESCC (Table 5). Furthermore, the quantitative real time RT-PCR (qRT-PCR) was performed to validate the results of RNA-Seq. In total the expression of 14 genes were investigated in ESCC and NE samples. A high level of concordance between qRT-PCR results and RNA-Seq data confirmed the RNA-Seq results were acceptable (r=0.889, p<0.001; Fig. 5A).
Table 5: Significantly enriched pathways for DEGs
Pathway |
DEGs with pathway annotation |
All genes with pathway annotation |
Q value |
Pathway ID |
|---|---|---|---|---|
Dilated cardiomyopathy |
66 |
108 |
2.611394e-09 |
ko05414 |
Hypertrophic cardiomyopathy (HCM) |
61 |
101 |
1.971738e-08 |
ko05410 |
Cell adhesion molecules (CAMs) |
74 |
134 |
1.292208e-07 |
ko04514 |
Calcium signaling pathway |
99 |
193 |
1.515844e-07 |
ko04020 |
Arrhythmogenic right ventricular cardiomyopathy (ARVC) |
48 |
80 |
8.359827e-07 |
ko05412 |
ECM-receptor interaction |
46 |
84 |
4.016593e-05 |
ko04512 |
Vascular smooth muscle contraction |
62 |
129 |
0.0003407075 |
ko04270 |
Focal adhesion |
93 |
208 |
0.0003635684 |
ko04510 |
Long-term potentiation |
37 |
70 |
0.00056412 |
ko04720 |
Viral myocarditis |
38 |
73 |
0.0007063471 |
ko05416 |
Axon guidance |
60 |
129 |
0.001193845 |
ko04360 |
Melanogenesis |
50 |
104 |
0.001217776 |
ko04916 |
Cytokine-cytokine receptor interaction |
115 |
277 |
0.002342581 |
ko04060 |
Glycine, serine and threonine metabolism |
18 |
31 |
0.003986321 |
ko00260 |
Hematopoietic cell lineage |
46 |
99 |
0.004332282 |
ko04640 |
Type I diabetes mellitus |
23 |
43 |
0.004977168 |
ko04940 |
Phosphatidylinositol signaling system |
36 |
76 |
0.00748928 |
ko04070 |
Steroid biosynthesis |
11 |
17 |
0.007951011 |
ko00100 |
Regulation of actin cytoskeleton |
94 |
230 |
0.009258026 |
ko04810 |
Prion diseases |
22 |
43 |
0.01161543 |
ko05020 |
Leukocyte transendothelial migration |
51 |
118 |
0.0152988 |
ko04670 |
Bladder cancer |
23 |
47 |
0.01890428 |
ko05219 |
p53 signaling pathway |
34 |
75 |
0.01990306 |
ko04115 |
Cardiac muscle contraction |
42 |
96 |
0.02082785 |
ko04260 |
Pathways in cancer |
135 |
351 |
0.02250529 |
ko05200 |
Renin-angiotensin system |
10 |
17 |
0.02715161 |
ko04614 |
DNA replication |
18 |
36 |
0.02807702 |
ko03030 |
Arginine and proline metabolism |
25 |
54 |
0.03205055 |
ko00330 |
Cell cycle |
61 |
150 |
0.03473822 |
ko04110 |
Basal cell carcinoma |
25 |
55 |
0.04061275 |
ko05217 |
Primary immunodeficiency |
17 |
35 |
0.04385614 |
ko05340 |
PPAR signaling pathway |
31 |
71 |
0.04405247 |
ko03320 |
N-Glycan biosynthesis |
22 |
48 |
0.04797281 |
ko00510 |
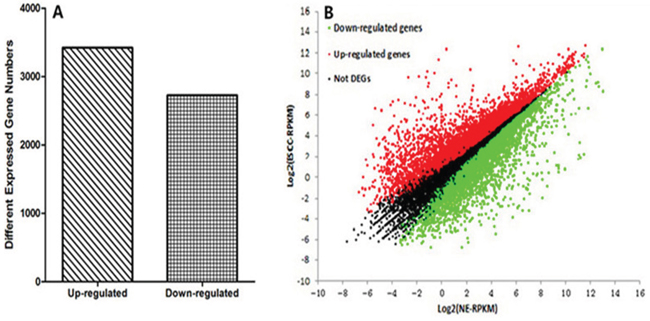
Figure 3: Whole genome expression profiles. A. Differentially expressed gene numbers between ESCC and NE. The y axis indicates the gene numbers. B. Comparison of gene expression level between ESCC and NE. Red dots represent transcripts more prevalent in ESCC, green dots show those down-regulated genes in ESCC and black dots indicate gene expression did not change significantly.
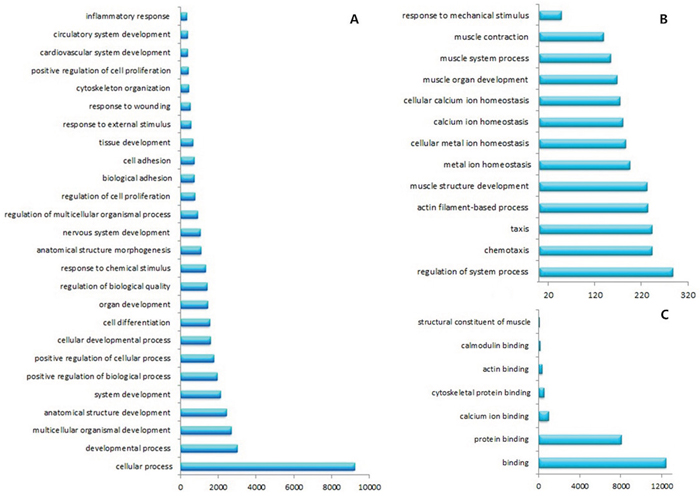
Figure 4: GO analysis showed that these DEGs related to many biological processes and molecular functions. A. and B. DEGs involved in many biological processes. C. DEGs correlated with molecular functions.
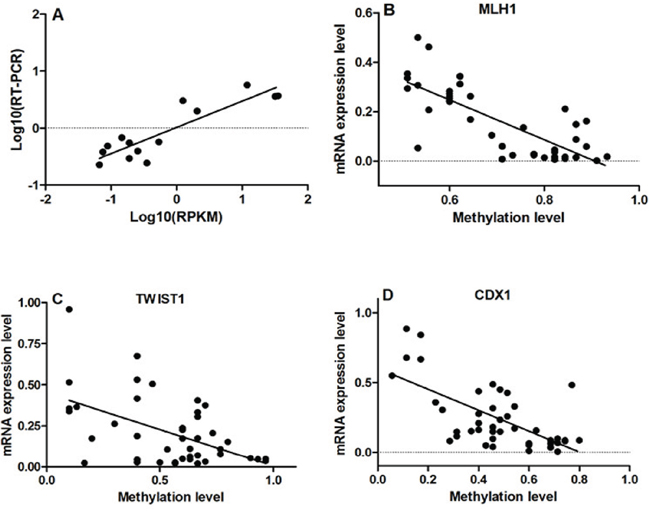
Figure 5: Results of correlation analysis. A. High level of concordance between qRT-PCR results and RNA-Seq data confirmed the RNA-Seq results were acceptable (r=0.889, p<0.001). B, C and D. Correlation analyses showed that the DNA methylation levels of MLH1, TWIST1 and CDX1 were negatively correlated with their mRNA expression (MLH1: r=-0.776, p<0.001; TWIST1: r=-0.515, p<0.001; CDX1: r=-0.649, p<0.001).
Association of DNA methylation changes, differential gene expression and clinical pathological features
The qRT-PCR results showed that the mRNA expression of MLH1, CDH5, ITIH5, CRABP1, CDKN2A, CDO1 and FHIT were significantly down-regulated in ESCC samples compared to NE samples. In contrast, the mRNA expression of TWIST1, CXCL5, GADD45A, WNT3A and CDX1 was significantly up-regulated in ESCC samples than that in NE (Supplementary Fig. S4). Correlation analyses showed that the DNA methylation levels of MLH1, TWIST1 and CDX1 were negatively correlated with their mRNA expression (MLH1: r=-0.776, p<0.001; TWIST1: r=-0.515, p<0.001; CDX1: r=-0.649, p<0.001; Fig. 5B, 5C and 5D).
For survival analysis, patients were grouped into low methylation or high methylation groups according to their methylation Z scores. Survival analysis showed that the aberrant methylation of MLH1 significantly related to patients’ survival (p=0.001; Fig. 6).
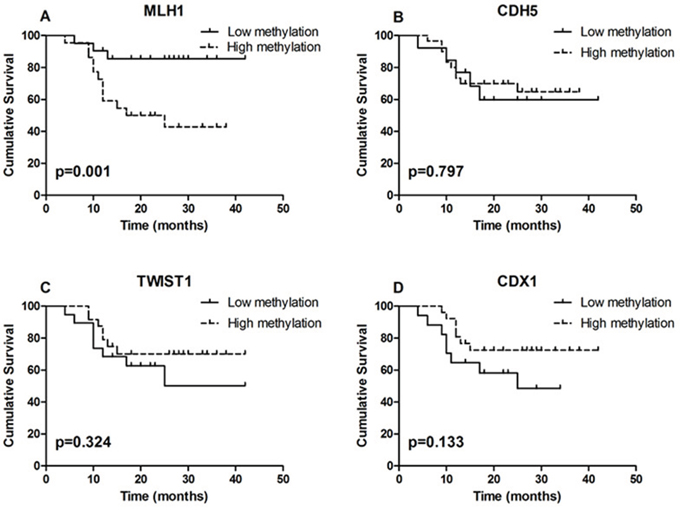
Figure 6: Results of survival analysis. A. Survival analysis showed that the aberrant methylation of MLH1 significantly related to patient survival (p=0.001). B, C. and D. DNA methylation level of CDH5, TWIST1 and CDX1 did not correlated with patient survival (p=0.797; p=0.324 and p=0.133).
DISCUSSION
In this study, we used the high-throughput MeDIP-Seq and RNA-Seq to examine whole-genome DNA methylation patterns and messenger RNA transcriptome in a total of 4 pairs of ESCC samples and NE samples. Our findings provided a comprehensive, detailed picture of DNA methylation patterns and gene expression levels in patients with ESCC. The DMRs identified by MeDIP-Seq spanned almost the entire genome with sufficient depth and high resolution, and the number of DMRs was much greater than that detected by traditional approaches, indicating that this method represents an effective approach for DNA methylome studies [22, 23]. Moreover, the bisulfite sequencing analysis of MLH1, CDH5, TWIST1 and CDX1 were in accordance with the MeDIP-Seq results. It also proved the high accuracy of the high-throughput sequencing technique.
With the increasing availability and applications of high-throughput sequencing methods, more and more studies have reported the methylation of tissue-specific genes mainly occurred within the gene body instead of the 5’promoters [34-36]. Our study also found that most of the DMRs occurred within the gene body, only small proportion of DMRs located at the 5’promoter region. Moreover, the great number of uniquely mapped reads located at the intronic region, indicating the DNA methylation in introns may have important regulatory functions.
To understand the global DNA methylation pattern in ESCC, we compared the overall distribution of reads between ESCC and NE groups. As expected, both hypermethylated and hypomethylated changes were observed in ESCC samples compared to NE (Fig. 1). The similar results have been shown in previous studies [37, 38].
In total of 6150 differentially expressed genes were identified by RNA-Seq in our study. The results of RNA-Seq were confirmed by qRT-PCR from validation of a number of randomly selected genes. GO analysis revealed these DEGs were significantly enriched in many cell related process and molecular functions, such as cell differentiation, apoptosis, adhesion and proliferation. Aberrant expressions of some of these genes were previously reported to be important in the development of ESCC [28, 39, 40]. Pathway analysis highlighted many pathways which were closely related to the carcinogenesis of ESCC, such as cell adhesion molecules, p53 and PPAR signaling pathways, providing new clues for understanding the molecular mechanisms of ESCC pathogenesis.
In light of previously described effects of DNA methylation on promoters[41], we selected DMRs from upstream 2kbp of transcription start site to validate the MeDIP-Seq results. According to GO analysis and pathway analysis, DMRs were identified in genes associated with cell cycle, adhesion, apoptosis and many biological pathways, which were closely correlated with carcinogenesis. As such, we selected four genes for further study: TWIST1, CDX1, MLH1 and CDH5.
TWIST1 is one of the epithelial-to-mesenchymal transition (EMT) inducer prototypes, which lead to epithelial cells lose their adhesion properties and acquire mesenchymal features allowing their migration and invasion [42]. The overexpression of TWIST1 has been reported in previous studies showing that it could be a biomarker for tumor progression and metastasis [43-46]. Interestingly, promoter hypermethylation of TWIST1 was also observed in the development of colorectal cancer, vulvar cancer and tonsillar squamous cell carcinoma [47-49]. Recently, Galvan et al. reported strong inverse correlations between TWIST1 methylation and stromal expression of TWIST1 in colon cancer [50]. Wong and colleagues reported promoter-specific hypomethylation of TWIST1 was strongly associated with gene overexpression [51], indicating the promoter methylation may regulate the TWIST1 expression. Our MeDIP-Seq results, for the first time, identified a DMR (from -1010 to -1715) in upstream 2K of TWIST1. Significant hypomethylated changes of 6 continuous clustered CpG loci (-1398, -1418, -1424, -1427, -1430, -1453) were identified in this region. Overexpression of TWIST1 was detected in both RNA-Seq data and qRT-PCR validation test, with adverse correlation with DNA hypomethylation. Nevertheless, survival analysis did not found significant correlation between overexpression or methylation of TWIST1 and patients’ survival. Our results indicated that the DNA hypomethylation, to some degree, has regulatory function for the expression of TWIST1 in ESCC.
CDX1 was previously described as an oncogene since it regulated Ras, Wnt/β-catenin and PI3 kinase pathways leading to transformation and tumorigenesis of intestinal epithelial cells [52]. Recent studies showed that CDX1 expression was down-regulated by promoter hypermethylation in colon cancer [31, 53], whereas a subset of colon cancers may express increased levels of CDX1 mRNA and protein [54]. Our results showed that the hypomethylation of CDX1 was related to the gene overexpression in ESCC samples, which indicated that the CDX1 might have oncogenic potential in the development of ESCC [55].
The silencing and promoter hypermethylation of tumor suppressor gene MLH1 and CDH5 have been reported in various cancers [56-59]. Deng and colleagues reported that MLH1 silencing by methylation is region specific. The loss of expression of MLH1 was correlated with the proximal region (from -322 to +56), but not the distal region (from -796 to -547) [60]. In our study, the identified MLH1 DMR (from -250 to -10) also located at proximal region. In validation test, hypermethylation in this region was detected and related to gene silencing. Moreover, the survival analysis showed that the methylation of MLH1 significantly correlated with patient survival, indicating the MLH1 might play important role in the carcinogenesis of ESCC. Together, our results show that genome-wide aberrant DNA methylation of cancer-associated genes may be involved in the pathogenesis of ESCC.
MATERIALS AND METHODS
Tissue samples
Fresh frozen ESCC samples and paired adjacent normal esophageal (NE) tissue samples (healthy surrounding esophageal tissue more than 5 cm away from tumor) were obtained from 47 ESCC patients at the Second Xiangya Hospital of Central South University, Changsha, China. The 25 male and 22 female patients ranged between 45 and 71 years of age (mean 58.9 ± 6.9 years) and all had undergone ESCC surgery between April 2010 and August 2013. None of the patients had received preoperative treatments, such as chemotherapy or radiotherapy. Control samples were histologically and pathologically confirmed as healthy esophageal tissues, while all tumor samples were confirmed as ESCC, and staged according to the TNM system. Only samples with a tumor cell content of more than 80% were included in this study. A summary of clinical and pathological characteristics of patients included in this study is presented in Table 6.
Table 6: Characteristics of 47 patients with ESCC
Patient No. |
Gender/age (years) |
Alcohol History |
TNM Stage |
Histological Differentiation |
|---|---|---|---|---|
1 |
F/60 |
No |
IIb |
Moderate |
2 |
M/56 |
Yes |
IIb |
Moderate |
3 |
M/56 |
Yes |
IIIa |
Moderate |
4 |
F/48 |
No |
IIIa |
Moderate |
5 |
F/45 |
Yes |
Ia |
Low |
6 |
M/56 |
Yes |
Ib |
Moderate |
7 |
F/67 |
No |
Ib |
High |
8 |
M/67 |
Yes |
Ib |
Moderate |
9 |
M/59 |
Yes |
Ib |
High |
10 |
M/65 |
Yes |
Ib |
Moderate |
11 |
M/49 |
No |
Ib |
High |
12 |
F/52 |
Yes |
Ib |
Moderate |
13 |
M/53 |
No |
IIb |
Moderate |
14 |
F/65 |
No |
IIb |
Low |
15 |
M/51 |
Yes |
IIb |
Moderate |
16 |
F/51 |
No |
IIb |
Moderate |
17 |
F/69 |
Yes |
IIb |
Moderate |
18 |
M/68 |
Yes |
IIIb |
Moderate |
19 |
F/59 |
No |
IIIb |
High |
20 |
F/48 |
No |
Ia |
Low |
21 |
F/71 |
No |
IIa |
Moderate |
22 |
F/64 |
No |
IIa |
Moderate |
23 |
M/71 |
Yes |
IIa |
Moderate |
24 |
M/64 |
Yes |
IIb |
High |
25 |
F/59 |
Yes |
IIb |
High |
26 |
M/71 |
Yes |
IIb |
High |
27 |
M/61 |
Yes |
IIb |
Moderate |
28 |
F/60 |
No |
IIb |
Low |
29 |
M/65 |
Yes |
IIb |
High |
30 |
F/58 |
No |
IIb |
Moderate |
31 |
M/58 |
No |
IIb |
High |
32 |
M/59 |
Yes |
IIIa |
Moderate |
33 |
M/59 |
No |
IIIa |
Low |
34 |
F/71 |
Yes |
IIIa |
Moderate |
35 |
M/52 |
Yes |
IIIa |
Moderate |
36 |
F/48 |
No |
IIIa |
Low |
37 |
F/57 |
Yes |
IIIa |
High |
38 |
F/62 |
No |
IIIa |
High |
39 |
M/62 |
Yes |
IIIa |
Low |
40 |
F/50 |
Yes |
IIIb |
High |
41 |
F/62 |
No |
IIIb |
High |
42 |
M/48 |
Yes |
IIIb |
High |
43 |
M/55 |
Yes |
IIIc |
High |
44 |
M/61 |
Yes |
IIIc |
Low |
45 |
F/60 |
No |
IIIc |
High |
46 |
M/62 |
Yes |
IIIc |
Moderate |
47 |
M/65 |
Yes |
IV |
High |
This study was approved by the Human Ethics Committee of the Second Xiangya Hospital, Central South University. Written informed consents were obtained from all participants.
Genomic DNA and total RNA isolation and pooling
Genomic DNA was isolated from ESCC and NE tissue samples using Qiagen DNeasy Kits (Qiagen, Germany) according to the manufacturer’s instructions. For MeDIP-Seq, an equal quantity of DNA of four parallel individuals (Patient No.1, 2, 3 and 4) from ESCC and NE groups was then pooled respectively.
Total RNA was isolated from each sample with TRIzol Reagent (Invitrogen, USA) according to the manufacturer’s instructions, then treated with RNase-free DNase I for 30 min at 37°C(New England BioLabs) to remove residual DNA. The integrity of total RNA was checked using an Agilent Technologies 2100 Bioanalyzer, and all samples had an RNA Integrity Number (RIN) value greater than eight. Pooling of the RNA samples was the same as the DNA pooling, using for RNA-Seq.
MeDIP-Seq, RNA-Seq and data analysis
The detection and analysis of MeDIP-Seq and RNA-Seq were performed as described previously [61, 62]. Pathway enrichment analysis was based on KEGG database (http://www.genome.jp/kegg/), and Q value was used for determining the threshold of significance in multiple test and analysis. Pathways with a Q value <0.05 are considered significantly enriched in differentially expressed or modified genes (Supplementary Fig. S5).
Bisulfite conversion and sequencing
Bisulfite conversion was performed using the EpiTect Bisulfite Kit (Qiagen, Germany), according to manufacturer’s instruction. Fragments about 250 bp flanking each side of the loci of MLH1, CDH5, TWIST1 and CDX1 were amplified by PCR. The fragments were cloned into pGEM-T vectors (Promega, USA) and independent clones were sequenced for each of the amplified fragments[63]. The primers designed for the BSP were showed in Supplementary Table S1.
Real-time quantitative RT-PCR
Real-time quantitative RT-PCR was performed using a Prism 7500 Sequence Detection System (ABI, USA) and mRNA levels were quantified using the SYBR®Premix Ex Taq™(Takara Bio Inc., Dalian, China). A dilution series of sample RNA was also included to generate a standard curve used to calculate the relative concentrations of transcript present in each sample. Negative controls (in which water was substituted for RNA) were run for each sample. β-actin was also amplified and used as a loading control. Specific primers used for amplification were showed in Supplementary Table S2.
Statistical analysis
To evaluate the methylation level of individual genes, methylation for each gene among the patients was standardized by the Z score method[64]. Data was analyzed using SPSS 20.0 software (SPSS Inc., Chicago, USA) and are presented as the mean ± standard deviation (SD). Student’s t-test was used to compare continuous variables and Pearson’s correlation test was used for correlation analyses. Overall survival was calculated by Log-rank tests and the Kaplan-Meier test was used to generate survival curves. P values of less than 0.05 were considered significant.
CONFLICTS OF INTEREST
There are no any financial/commercial conflicts of interests involving in this study.
GRANT SUPPORT
This study was funded by the China National Natural Science Foundation (No.81000905), Hunan Provincial Natural Science Foundation of China (No.14JJ4014), and The Free Exploration Program of Central South University (No.201012200281).
REFERENCES
1. Zhang Y. Epidemiology of esophageal cancer. World journal of gastroenterology. 2013; 19:5598-5606.
2. Pennathur A, Gibson MK, Jobe BA, Luketich JD. Oesophageal carcinoma. Lancet. 2013; 381:400-412.
3. Napier KJ, Scheerer M, Misra S. Esophageal cancer: A Review of epidemiology, pathogenesis, staging workup and treatment modalities. World journal of gastrointestinal oncology. 2014; 6:112-120.
4. Eslick GD. Epidemiology of esophageal cancer. Gastroenterol Clin North Am. 2009; 38:17-25, vii.
5. Enzinger PC, Mayer RJ. Esophageal cancer. N Engl J Med. 2003; 349:2241-2252.
6. Wang X, Fan JC, Wang AR, Leng Y, Li J, Bao Y, Wang Y, Yang QF, Ren Y. Epidemiology of esophageal cancer in Yanting - regional report of a national screening programme in China. Asian Pacific journal of cancer prevention. 2013; 14:2429-2432.
7. Trevellin E, Scarpa M, Carraro A, Lunardi F, Kotsafti A, Porzionato A, Saadeh L, Cagol M, Alfieri R, Tedeschi U, Calabrese F, Castoro C, Vettor R. Esophageal adenocarcinoma and obesity: peritumoral adipose tissue plays a role in lymph node invasion. Oncotarget. 2015; 6:11203-11215. doi: 10.18632/oncotarget.3587.
8. Domper Arnal MJ, Ferrandez Arenas A, Lanas Arbeloa A. Esophageal cancer: Risk factors, screening and endoscopic treatment in Western and Eastern countries. World journal of gastroenterology. 2015; 21:7933-7943.
9. Guo H, Zhu P, Yan L, Li R, Hu B, Lian Y, Yan J, Ren X, Lin S, Li J, Jin X, Shi X, Liu P, Wang X, Wang W, Wei Y, et al. The DNA methylation landscape of human early embryos. Nature. 2014; 511:606-610.
10. Robertson KD. DNA methylation, human disease. Nat Rev Genet. 2005; 6:597-610.
11. Xu X. DNA methylation and cognitive aging. Oncotarget. 2015; 6:13925-13934. doi: 10.18632/oncotarget.4215.
12. Bernstein BE, Meissner A and Lander ES. The mammalian epigenome. Cell. 2007; 128:669-681.
13. Ambrosone CB, Young AC, Sucheston LE, Wang D, Yan L, Liu S, Tang L, Hu Q, Freudenheim JL, Shields PG, Morrison CD, Demissie K, Higgins MJ. Genome-wide methylation patterns provide insight into differences in breast tumor biology between American women of African and European ancestry. Oncotarget. 2014; 5:237-248. doi: 10.18632/oncotarget.1599.
14. Brock MV, Hooker CM, Ota-Machida E, Han Y, Guo M, Ames S, Glockner S, Piantadosi S, Gabrielson E, Pridham G, Pelosky K, Belinsky SA, Yang SC, Baylin SB, Herman JG. DNA methylation markers and early recurrence in stage I lung cancer. N Engl J Med. 2008; 358:1118-1128.
15. Liu WB, Han F, Jiang X, Chen HQ, Zhao H, Liu Y, Li YH, Huang C, Cao J, Liu JY. TMEM196 acts as a novel functional tumour suppressor inactivated by DNA methylation and is a potential prognostic biomarker in lung cancer. Oncotarget. 2015; 6:21225-39. doi: 10.18632/oncotarget.4237.
16. Chen C, Yin B, Wei Q, Li D, Hu J, Yu F, Lu Q. Aberrant DNA methylation in thymic epithelial tumors. Cancer investigation. 2009; 27:582-591.
17. Spisak S, Kalmar A, Galamb O, Wichmann B, Sipos F, Peterfia B, Csabai I, Kovalszky I, Semsey S, Tulassay Z, Molnar B. Genome-wide screening of genes regulated by DNA methylation in colon cancer development. PLoS One. 2012; 7:e46215.
18. Gaedcke J, Leha A, Claus R, Weichenhan D, Jung K, Kitz J, Grade M, Wolff HA, Jo P, Doyen J, Gerard JP, Johnsen SA, Plass C, Beissbarth T, Ghadimi M. Identification of a DNA methylation signature to predict disease-free survival in locally advanced rectal cancer. Oncotarget. 2014; 5:8123-8135. doi: 10.18632/oncotarget.2347.
19. Bu F, Liu X, Li J, Chen S, Tong X, Ma C, Mao H, Pan F, Li X, Chen B, Xu L, Li E, Kou G, Han J, Guo S, Zhao J, et al. TGF-beta1 induces epigenetic silence of TIP30 to promote tumor metastasis in esophageal carcinoma. Oncotarget. 2015; 6:2120-2133. doi: 10.18632/oncotarget.2940.
20. Kawano H, Saeki H, Kitao H, Tsuda Y, Otsu H, Ando K, Ito S, Egashira A, Oki E, Morita M, Oda Y, Maehara Y. Chromosomal Instability Associated with Global DNA Hypomethylation is Associated with the Initiation and Progression of Esophageal Squamous Cell Carcinoma. Ann Surg Oncol. 2014.
21. Wang B, Yin BL, He B, Chen C, Zhao M, Zhang W, Xia ZK, Pan Y, Tang J, Zhou X, Yin N. Overexpression of DNA damage-induced 45 alpha gene contributes to esophageal squamous cell cancer by promoter hypomethylation. Journal of experimental & clinical cancer research. 2012; 31:11.
22. Mardis ER. Next-generation DNA sequencing methods. Annual review of genomics and human genetics. 2008; 9:387-402.
23. Down TA, Rakyan VK, Turner DJ, Flicek P, Li H, Kulesha E, Graf S, Johnson N, Herrero J, Tomazou EM, Thorne NP, Backdahl L, Herberth M, Howe KL, Jackson DK, Miretti MM, et al. A Bayesian deconvolution strategy for immunoprecipitation-based DNA methylome analysis. Nature biotechnology. 2008; 26:779-785.
24. Carrier G, Santoni S, Rodier-Goud M, Canaguier A, Kochko A, Dubreuil-Tranchant C, This P, Boursiquot JM, Le Cunff L. An efficient and rapid protocol for plant nuclear DNA preparation suitable for next generation sequencing methods. American journal of botany. 2011; 98:e13-15.
25. De Luca A, Roma C, Gallo M, Fenizia F, Bergantino F, Frezzetti D, Costantini S, Normanno N. RNA-seq analysis reveals significant effects of EGFR signalling on the secretome of mesenchymal stem cells. Oncotarget. 2014; 5:10518-10528. doi: 10.18632/oncotarget.2420.
26. Su Z, Xia J, Zhao Z. Functional complementation between transcriptional methylation regulation and post-transcriptional microRNA regulation in the human genome. BMC genomics. 2011; 12 Suppl 5:S15.
27. Zhang Y, Liu T, Meyer CA, Eeckhoute J, Johnson DS, Bernstein BE, Nusbaum C, Myers RM, Brown M, Li W, Liu XS. Model-based analysis of ChIP-Seq (MACS). Genome Biol. 2008; 9:R137.
28. Ma S, Bao JY, Kwan PS, Chan YP, Tong CM, Fu L, Zhang N, Tong AH, Qin YR, Tsao SW, Chan KW, Lok S, Guan XY. Identification of PTK6, via RNA sequencing analysis, as a suppressor of esophageal squamous cell carcinoma. Gastroenterology. 2012; 143:675-686 e671-612.
29. Saintigny P, Massarelli E, Lin S, Ahn YH, Chen Y, Goswami S, Erez B, O’Reilly MS, Liu D, Lee JJ, Zhang L, Ping Y, Behrens C, Solis Soto LM, Heymach JV, Kim ES, et al. CXCR2 expression in tumor cells is a poor prognostic factor and promotes invasion and metastasis in lung adenocarcinoma. Cancer Res. 2013; 73:571-582.
30. Fujita T, Igarashi J, Okawa ER, Gotoh T, Manne J, Kolla V, Kim J, Zhao H, Pawel BR, London WB, Maris JM, White PS, Brodeur GM. CHD5, a tumor suppressor gene deleted from 1p36.31 in neuroblastomas. J Natl Cancer Inst. 2008; 100:940-949.
31. Hatano Y, Semi K, Hashimoto K, Lee MS, Hirata A, Tomita H, Kuno T, Takamatsu M, Aoki K, Taketo MM, Kim YJ, Hara A, Yamada Y. Reducing DNA methylation suppresses colon carcinogenesis by inducing tumor cell differentiation. Carcinogenesis. 2015; 36:719-729.
32. Kristensen LS, Asmar F, Dimopoulos K, Nygaard MK, Aslan D, Hansen JW, Ralfkiaer E, Gronbaek K. Hypermethylation of DAPK1 is an independent prognostic factor predicting survival in diffuse large B-cell lymphoma. Oncotarget. 2014; 5:9798-9810. doi: 10.18632/oncotarget.2394.
33. Han N, Yuan X, Wu H, Xu H, Chu Q, Guo M, Yu S, Chen Y, Wu K. DACH1 inhibits lung adenocarcinoma invasion and tumor growth by repressing CXCL5 signaling. Oncotarget. 2015; 6:5877-5888. doi: 10.18632/oncotarget.3463.
34. Maunakea AK, Nagarajan RP, Bilenky M, Ballinger TJ, D’Souza C, Fouse SD, Johnson BE, Hong C, Nielsen C, Zhao Y, Turecki G, Delaney A, Varhol R, Thiessen N, Shchors K, Heine VM, et al. Conserved role of intragenic DNA methylation in regulating alternative promoters. Nature. 2010; 466:253-257.
35. Zhang B, Xing X, Li J, Lowdon RF, Zhou Y, Lin N, Zhang B, Sundaram V, Chiappinelli KB, Hagemann IS, Mutch DG, Goodfellow PJ, Wang T. Comparative DNA methylome analysis of endometrial carcinoma reveals complex and distinct deregulation of cancer promoters and enhancers. BMC genomics. 2014; 15:868.
36. Ruike Y, Imanaka Y, Sato F, Shimizu K, Tsujimoto G. Genome-wide analysis of aberrant methylation in human breast cancer cells using methyl-DNA immunoprecipitation combined with high-throughput sequencing. BMC genomics. 2010; 11:137.
37. Kobayashi Y, Absher DM, Gulzar ZG, Young SR, McKenney JK, Peehl DM, Brooks JD, Myers RM, Sherlock G. DNA methylation profiling reveals novel biomarkers and important roles for DNA methyltransferases in prostate cancer. Genome research. 2011; 21:1017-1027.
38. Irizarry RA, Ladd-Acosta C, Wen B, Wu Z, Montano C, Onyango P, Cui H, Gabo K, Rongione M, Webster M, Ji H, Potash JB, Sabunciyan S, Feinberg AP. The human colon cancer methylome shows similar hypo- and hypermethylation at conserved tissue-specific CpG island shores. Nature genetics. 2009; 41:178-186.
39. Lee KB, Ye S, Park MH, Park BH, Lee JS, Kim SM. p63-Mediated activation of the beta-catenin/c-Myc signaling pathway stimulates esophageal squamous carcinoma cell invasion and metastasis. Cancer letters. 2014; 353:124-132.
40. Li B, Wang B, Niu LJ, Jiang L, Qiu CC. Hypermethylation of multiple tumor-related genes associated with DNMT3b up-regulation served as a biomarker for early diagnosis of esophageal squamous cell carcinoma. Epigenetics. 2011; 6:307-316.
41. Baylin SB, Esteller M, Rountree MR, Bachman KE, Schuebel K, Herman JG. Aberrant patterns of DNA methylation, chromatin formation and gene expression in cancer. Human molecular genetics. 2001; 10:687-692.
42. Beck B, Lapouge G, Rorive S, Drogat B, Desaedelaere K, Delafaille S, Dubois C, Salmon I, Willekens K, Marine JC, Blanpain C. Different levels of Twist1 regulate skin tumor initiation, stemness, and progression. Cell stem cell. 2015; 16:67-79.
43. Lee KW, Yeo SY, Sung CO, Kim SH. Twist1 is a key regulator of cancer-associated fibroblasts. Cancer research. 2015; 75:73-85.
44. Ai L, Kim WJ, Alpay M, Tang M, Pardo CE, Hatakeyama S, May WS, Kladde MP, Heldermon CD, Siegel EM, Brown KD. TRIM29 suppresses TWIST1 and invasive breast cancer behavior. Cancer research. 2014; 74:4875-4887.
45. Cho KH, Jeong KJ, Shin SC, Kang J, Park CG, Lee HY. STAT3 mediates TGF-beta1-induced TWIST1 expression and prostate cancer invasion. Cancer letters. 2013; 336:167-173.
46. Gasparotto D, Polesel J, Marzotto A, Colladel R, Piccinin S, Modena P, Grizzo A, Sulfaro S, Serraino D, Barzan L, Doglioni C, Maestro R. Overexpression of TWIST2 correlates with poor prognosis in head and neck squamous cell carcinomas. Oncotarget. 2011; 2:1165-1175. doi: 10.18632/oncotarget.390.
47. Oonk MH, Eijsink JJ, Volders HH, Hollema H, Wisman GB, Schuuring E, van der Zee AG. Identification of inguinofemoral lymph node metastases by methylation markers in vulvar cancer. Gynecologic oncology. 2012; 125:352-357.
48. Kwon MJ, Kwon JH, Nam ES, Shin HS, Lee DJ, Kim JH, Rho YS, Sung CO, Lee WJ, Cho SJ. TWIST1 promoter methylation is associated with prognosis in tonsillar squamous cell carcinoma. Human pathology. 2013; 44:1722-1729.
49. Okada T, Suehiro Y, Ueno K, Mitomori S, Kaneko S, Nishioka M, Okayama N, Sakai K, Higaki S, Hazama S, Hirata H, Sakaida I, Oka M, Hinoda Y. TWIST1 hypermethylation is observed frequently in colorectal tumors and its overexpression is associated with unfavorable outcomes in patients with colorectal cancer. Genes, chromosomes & cancer. 2010; 49:452-462.
50. Galvan JA, Helbling M, Koelzer VH, Tschan MP, Berger MD, Hadrich M, Schnuriger B, Karamitopoulou E, Dawson H, Inderbitzin D, Lugli A, Zlobec I. TWIST1 and TWIST2 promoter methylation and protein expression in tumor stroma influence the epithelial-mesenchymal transition-like tumor budding phenotype in colorectal cancer. Oncotarget. 2015; 6:874-885. doi: 10.18632/oncotarget.2716.
51. Wong HK, Gibson H, Hake T, Geyer S, Frederickson J, Marcucci G, Caligiuri MA, Porcu P, Mishra A. Promoter-Specific Hypomethylation Is Associated with Overexpression of PLS3, GATA6, and TWIST1 in the Sezary Syndrome. The Journal of investigative dermatology. 2015; 135:2084-2092.
52. Soubeyran P, Haglund K, Garcia S, Barth BU, Iovanna J, Dikic I. Homeobox gene Cdx1 regulates Ras, Rho and PI3 kinase pathways leading to transformation and tumorigenesis of intestinal epithelial cells. Oncogene. 2001; 20:4180-4187.
53. Wong NA, Britton MP, Choi GS, Stanton TK, Bicknell DC, Wilding JL, Bodmer WF. Loss of CDX1 expression in colorectal carcinoma: promoter methylation, mutation, and loss of heterozygosity analyses of 37 cell lines. Proceedings of the National Academy of Sciences of the United States of America. 2004; 101:574-579.
54. Domon-Dell C, Schneider A, Moucadel V, Guerin E, Guenot D, Aguillon S, Duluc I, Martin E, Iovanna J, Launay JF, Duclos B, Chenard MP, Meyer C, Oudet P, Kedinger M, Gaub MP, et al. Cdx1 homeobox gene during human colon cancer progression. Oncogene. 2003; 22:7913-7921.
55. Stairs DB, Nakagawa H, Klein-Szanto A, Mitchell SD, Silberg DG, Tobias JW, Lynch JP, Rustgi AK. Cdx1 and c-Myc foster the initiation of transdifferentiation of the normal esophageal squamous epithelium toward Barrett’s esophagus. PloS one. 2008; 3:e3534.
56. Lin JC, Jeong S, Liang G, Takai D, Fatemi M, Tsai YC, Egger G, Gal-Yam EN, Jones PA. Role of nucleosomal occupancy in the epigenetic silencing of the MLH1 CpG island. Cancer cell. 2007; 12:432-444.
57. Cancer Genome Atlas N. Comprehensive molecular characterization of human colon and rectal cancer. Nature. 2012; 487:330-337.
58. Berx G, van Roy F. Involvement of members of the cadherin superfamily in cancer. Cold Spring Harbor perspectives in biology. 2009; 1:a003129.
59. Fukuhara S, Chang I, Mitsui Y, Chiyomaru T, Yamamura S, Majid S, Saini S, Hirata H, Deng G, Gill A, Wong DK, Shiina H, Nonomura N, Dahiya R, Tanaka Y. DNA mismatch repair gene MLH1 induces apoptosis in prostate cancer cells. Oncotarget. 2014; 5:11297-11307. doi: 10.18632/oncotarget.2315.
60. Deng G, Peng E, Gum J, Terdiman J, Sleisenger M, Kim YS. Methylation of hMLH1 promoter correlates with the gene silencing with a region-specific manner in colorectal cancer. British journal of cancer. 2002; 86:574-579.
61. Zhang P, Zhao M, Liang G, Yin G, Huang D, Su F, Zhai H, Wang L, Su Y, Lu Q. Whole-genome DNA methylation in skin lesions from patients with psoriasis vulgaris. Journal of autoimmunity. 2013; 41:17-24.
62. Zhao M, Liu S, Luo S, Wu H, Tang M, Cheng W, Zhang Q, Zhang P, Yu X, Xia Y, Yi N, Gao F, Wang L, Yung S, Chan TM, Sawalha AH, et al. DNA methylation and mRNA and microRNA expression of SLE CD4+ T cells correlate with disease phenotype. J Autoimmun. 2014.
63. Yu X, Liang G, Yin H, Ngalamika O, Li F, Zhao M, Lu Q. DNA hypermethylation leads to lower FOXP3 expression in CD4+ T cells of patients with primary Sjogren’s syndrome. Clinical immunology. 2013; 148:254-257.
64. Cheadle C, Vawter MP, Freed WJ, Becker KG. Analysis of microarray data using Z score transformation. J Mol Diagn. 2003; 5:73-81.