
Introduction
Physiological (normal) SHM occurs in immunoglobulin variable (IGV) loci (i.e. the portion of the gene encoding the variable region of immunoglobulin heavy chain) within germinal center (GC) B cells to generate antibody diversity. In normal GC B cells, SHM can also target the non-IGV loci such as the 5’ sequences of the BCL6 and FAS/CD95 (TNFRSF6) genes [1, 2]. This process is initiated by cytosine deamination catalyzed by the activation induced (cytidine) deaminase enzyme (AID). The resulting uracils are then processed by the base excision repair or mismatch repair pathways. Faulty repair by these pathways in conjunction with replication via error-prone polymerases leads to a characteristic pattern of mutations that is a hallmark of somatic hypermutation events [3,4]. The mutation frequency in an IGV loci is estimated to be approximately 10−3 events per base pair which is 106 fold higher than the spontaneous mutation rate in somatic cells [5]. The mutation frequency in a non-IGV locus is however, 50 to 100 times lower that of an IGV-locus [5]. SHM activity starts some 150 nucleotides downstream of the transcription start site (TSS) and extends typically a further two kilo bases into the gene [6]. However, the probability of mutation per base exponentially decreases with the increasing downstream distance to the TSS [7]. Due to the specific activity of AID acting on cytosines, the ratio of transition mutations over transversions is significantly higher than 1:2 that is expected on a random basis. Hot spot and cold spot patterns are also observed in the mutation pattern within a SHM-targeted region, indicating that SHM is influenced by the primary sequence of the DNA [8]. The most significant hotspot motif is the WRCY (where W denotes A or T; R denotes A or G; and Y denotes C or T) or its reverse complement RGYW [9]. There is also a strand-biased pattern in the targeted bases. Most notably, mutations at A:T base pairs are more likely to occur if A is located on the non-template strand of the gene. In addition, a C on the non- template strand can potentially induce a mutation in neighboring residues while a C on the template strand cannot [10]. Somatic hypermutation has been observed to aberrantly target the proto-oncogenes BCL6, PIM1, MYC, RHOH (RAS homologue gene-family member H) and PAX5 (paired box gene/protein 5); and the tumor suppressor gene CD95. Such mis-targeting of SHM contributes to the development of diffuse large B-cell lymphomas, tumors that derive from B cells within, or about to exit, the germinal center [8, 118211;13], by providing a source of oncogenic mutations. More recently, through extensive sequencing of murine B-cell genes, it has been shown that selective targeting of AID and gene-specific, high-fidelity repair of AID-generated uracils are the two distinct mechanisms that protect genome from somatic hypermutation [14].
Aberrant SHM (aSHM) does not target proto-oncogenes in all subtypes of lymphomas originating from GC or post CG B-cells. In fact, aSHM activity in PIM1, PAX5, RHOH/TTF and MYC proto-oncogenes, have been acknowledged as a molecular feature exclusive to DLBCL. While aSHM of oncogenic loci affects more than 50% of DLBCL, it is rarely or never observed in other B-cell malignancies [12]. Somatic hypermutation has a driving role in chromosomal translocations in B-cell lymphomas [15]. These chromosomal aberrations usually cause dysregulation in the expression of oncogenes brought under the control of the IG loci. Somatic hypermutation intrinsically generates double-strand DNA breaks that are potentially recombinogenic [16]. A number of proto-oncogenes have been shown to be recurrent targets of aSHM in DLBCL ( i.e. BCL6, MYC, RHOH/TTF, PIM1, PAX5 [2, 12], IRF4, ST6GAL1, BCL7A, CIITA, LRMP [17], BCL2 [18], and SOCS1 [19]). The first four genes identified through the targeted sequencing of only 17 selected genes in tumor samples [12]. This relatively high rate of positively identified genes among those analyzed suggested that somatic hypermutation is likely to target a wide range of genome loci. Although, in the past decade several studies have emerged to explain SHM mechanism and its role in tumorigenesis, to the best of our knowledge, there has not been an attempt to determine a comprehensive list of genome loci targeted at high frequency by aSHM. The aim of this study is to provide such a list in order to identify novel proto-oncogenes contributing to DLBCL.
Results and discussion
We have performed a genome wide study on single nucleotide variations (SNVs) from whole genome data derived from 40 previously described DLBCL patients to identify recurrent SHM targets in DLBCL. Matched RNA seq and matched normal whole genome data was available for all of these samples and used in this study, however, only the SNVs derived from the whole genome data were included in the study as the variations derived from RNA-seq data are biased in the regions with high expression level. Our cohort consisted of 13 Activated B-cell (ABC) and 23 Germinal B-cell (GCB) subtypes (4 samples were not morphologically grouped).
Since SHM activities occur within a 2kb region downstream of TSS, we analyzed the mutations in this target region for annotated genes in the UCSC knownGene track [20]. We refer to these regions as SHMtargets throughout the text. Similar to previous studies in B-cell NHLs, we have determined criteria that reflect SHM activity in the target regions [8,11,12]. These measures include: (i) the pattern of mutations in the SHM-targets, (ii) the percentage of SNVs within a hot spot motif WRCY, (iii) the ratio of mutations at C:G sites to A:T sites and (iv) ratio of transition to transversion mutations. We defined an SHM indicator value for each SHM-target as the geometric mean of the p-values for measures (ii), (iii) and (iv). These are the measures that most commonly used to quantify SHM mutations. Supplementary Table 1 contains the calculated SHM measures for the SHM-targets with at least one SNV, sorted by the statistical significance of the observed mutations in the SHM-targets across the samples. Thus, the regions with high mutation rates are normally those observed to be recurrently mutated across multiple samples. We identified 44 potential SHM-targets, among over 46,000 analyzed regions, that were mutated at an equal or higher rate than those previously reported (See Table 1). The list includes all the 12 genes previously reported to be hypermutated in DLBCL (i.e. BCL2, BCL6, MYC, RHOH/TTF, PIM1, PAX5, IRF4, ST6GAL1, BCL7A, CIITA, LRMP and SOCS1). The signature of the SNVs in the SHM-target of these genes indicates the existence of the SHM in these region and in particular, 9 out of 12 genes show a significant associated SHM indicator value (i.e. less than 0.1). This supports the appropriateness of our analytical method. In addition to the previously reported genes, the list includes 32 novel recurrently mutated targets. These genes were identified as hypermutated on average in 8 (i.e. 20% of the samples) independent tumors and a median value of recurrence of 12 SNVs per SHM-target region. This list is enriched with genes that show indication of aSHM activity in their SHM-target regions. In particular, more than 81, 90 and 60 percent of the SHM-targets show a bias for SHM criteria (ii), (iii) and (iv), respectively. Furthermore, over 56% of these SHM-targets have an SHM indicator value less than 0.1. Table 1 shows somatic features for the recurrently mutated non-IG genes that are mutated at an equal or higher rate than previously reported SHM targets. There are however, genes with high mutation rates that lack the hallmarks of SHM activity. For instance, although mutated in 9 and 6 genomes respectively, the signature of SNVs associated with BACH2 and POU2AF1 are not indicative of any SHM activity. On the other hand, the key role of POU2AF1 in the formation of germinal centers [21] and the fact that BACH2 is involved in translocations in DLBCL [22,23] may indicate that the high mutation rate in these genes is associated with SHM or that mutation in these genes is under selection.
Gene names |
SHM indicator |
Total SNVs |
Mutated Samples |
Transition/ Transvertion (Pvalue) |
Motif Bias (P-values) |
C:G over A:T (P-value) |
RPKM fold change between mutated vs. unmutated samples |
Average RPKM in Tumor |
Avearge RPKM Normal Bcell |
BCL6* |
0.1389 |
179 |
27 |
1.27(0.06) |
1.41(0.0919) |
0.77(0.5) |
0.55739 |
61.4600 |
160.93086 |
BCL2* |
0.2642 |
146 |
11 |
0.8(0.5) |
1.47(0.0738) |
0.79(0.5) |
1.29298 |
20.7300 |
2.59639 |
BTG2 |
0.0123 |
55 |
18 |
1.04(0.45) |
2.78(0.0002) |
1.05(0.0172) |
-0.27272 |
149.6800 |
223.5928 |
TMSB4X |
0.0201 |
52 |
17 |
0.79(0.5) |
1.69(0.1114) |
1.41(0.0001) |
0.11158 |
1485.8800 |
1017.2736 |
ZFP36L1 |
0.0000 |
52 |
16 |
1.17(0.29) |
4.18(0) |
1.26(0.0009) |
0.05879 |
50.4900 |
142.76265 |
RHOH* |
0.0509 |
42 |
17 |
0.68(0.5) |
2.91(0.0005) |
0.81(0.5) |
0.01346 |
76.7300 |
352.06877 |
SERPINA9 |
0.1296 |
36 |
7 |
0.57(0.5) |
2.15(0.0345) |
1.03(0.1261) |
5.48905 |
277.4700 |
237.10067 |
CD83 |
0.0006 |
34 |
8 |
1.13(0.37) |
3.49(0.0001) |
1.67(0) |
1.08042 |
162.1900 |
478.47502 |
SGK1 |
0.0000 |
34 |
5 |
0.62(0.5) |
5.5(0) |
1.37(0.0103) |
0.1586 |
2.9000 |
4.48411 |
BCL7A* |
0.0083 |
32 |
14 |
1.46(0.14) |
4.29(0) |
0.9(0.5) |
0.73039 |
31.1700 |
96.05465 |
BACH2 |
0.5000 |
30 |
8 |
0.25(0.5) |
0.67(0.5) |
0.75(0.5) |
0.30362 |
8.0700 |
52.5643 |
LTB |
0.0794 |
23 |
10 |
1.3(0.27) |
2.72(0.0156) |
1.15(0.1208) |
1.81466 |
142.6400 |
189.28412 |
BIRC3 |
0.1158 |
21 |
12 |
1.1(0.41) |
2.03(0.0975) |
1.4(0.0385) |
-0.10012 |
80.9500 |
175.95683 |
HIST1H2AC |
0.0009 |
19 |
9 |
1.71(0.13) |
4.95(0) |
1.47(0.0123) |
0 |
0.2000 |
0.08058 |
TCL1A |
0.2012 |
17 |
8 |
0.55(0.5) |
1.03(0.4869) |
1.48(0.0335) |
-0.07685 |
248.7300 |
709.73845 |
ST6GAL1* |
0.2318 |
15 |
8 |
0.88(0.5) |
2.17(0.1233) |
1.03(0.202) |
0.23782 |
64.4800 |
149.40245 |
CD74 |
0.0032 |
14 |
8 |
0.56(0.5) |
5.18(0) |
1.7(0.0061) |
0.44198 |
10559.9000 |
8227.8865 |
SOCS1* |
0.0272 |
14 |
5 |
1.33(0.3) |
3.3(0.0117) |
1.38(0.0058) |
0.16955 |
26.1800 |
39.5316 |
IRF8 |
0.2448 |
13 |
9 |
1.6(0.2) |
1.19(0.4275) |
1.14(0.1694) |
-0.0691 |
174.1000 |
462.84745 |
BTG1 |
0.0683 |
13 |
9 |
1.17(0.39) |
3.55(0.0076) |
1.22(0.1065) |
0.12187 |
191.6600 |
975.71198 |
CR607557 |
0.0008 |
13 |
9 |
1.6(0.2) |
6.69(0) |
1.11(0.2004) |
0 |
0.0000 |
0 |
LRMP* |
0.2823 |
13 |
7 |
0.63(0.5) |
1.08(0.4667) |
1.48(0.0965) |
0.22716 |
149.9900 |
276.99144 |
IRF4* |
0.0208 |
13 |
4 |
5.5(0.01) |
2.63(0.0714) |
1.28(0.0201) |
1.82701 |
106.0800 |
29.07161 |
CIITA* |
0.0003 |
12 |
9 |
1(0.5) |
6.29(0) |
1.78(0.001) |
0.49221 |
25.6600 |
23.75111 |
DTX1 |
0.0294 |
12 |
8 |
3(0.04) |
3.71(0.0059) |
1.26(0.1041) |
0.42032 |
87.7300 |
151.20776 |
CXCR4 |
0.0025 |
12 |
7 |
0.71(0.5) |
5.9(0) |
1.68(0.002) |
0.42432 |
143.9600 |
968.41417 |
PIM1* |
0.0146 |
12 |
7 |
1(0.5) |
4.6(0.0003) |
1.47(0.0255) |
0.96916 |
84.0200 |
165.35743 |
S1PR2 |
0.0183 |
11 |
7 |
1.75(0.18) |
5.25(0.0005) |
1.19(0.0689) |
0.59678 |
22.3300 |
96.04705 |
MALAT1 |
0.1786 |
11 |
7 |
1.2(0.38) |
2.6(0.0729) |
1.21(0.2048) |
0 |
0.0000 |
0 |
SPRED2 |
0.2356 |
11 |
6 |
0.57(0.5) |
2.89(0.0523) |
0.75(0.5) |
1.46507 |
12.2400 |
22.09212 |
PAX5* |
0.0114 |
10 |
7 |
1.5(0.26) |
6.39(0.0001) |
1.39(0.0726) |
-0.2793 |
52.5200 |
127.01243 |
DMD |
0.0239 |
10 |
3 |
2.33(0.1) |
3.36(0.0301) |
2.28(0.0044) |
1.50279 |
10.5300 |
3.6875 |
LLT1 |
0.2591 |
10 |
3 |
2.33(0.1) |
1.49(0.338) |
0.49(0.5) |
-0.21925 |
47.9800 |
86.73398 |
ETS1 |
0.1877 |
9 |
8 |
0.5(0.5) |
2.08(0.2211) |
1.61(0.0598) |
0.40109 |
58.3700 |
102.81003 |
DUSP2 |
0.0040 |
9 |
4 |
2(0.16) |
6.18(0) |
1.18(0.0532) |
0.65633 |
119.7600 |
160.9238 |
AK123543 |
0.0609 |
8 |
5 |
0(0.5) |
4.1(0.0127) |
1.71(0.0355) |
0 |
0.0000 |
0 |
POU2AF1 |
0.5000 |
7 |
6 |
0.75(0.5) |
0(0.5) |
0.61(0.5) |
-0.12034 |
153.9300 |
429.77219 |
GADD45B |
0.1136 |
7 |
6 |
6(0.03) |
2.58(0.1562) |
0.93(0.3192) |
-0.04866 |
30.9900 |
132.9862 |
MS4A1 |
0.1944 |
7 |
4 |
6(0.03) |
0(0.5) |
0.66(0.5) |
0.03938 |
644.0700 |
715.41695 |
P2RY8 |
0.3182 |
7 |
3 |
1.33(0.35) |
2.34(0.1826) |
0.92(0.5) |
0 |
0.4900 |
1.30263 |
GRHPR |
0.1429 |
6 |
5 |
2(0.21) |
0(0.5) |
1.81(0.0282) |
-0.17425 |
57.6200 |
27.42158 |
NCOA3 |
0.1770 |
6 |
4 |
5(0.05) |
0(0.5) |
1.39(0.2165) |
0.22822 |
42.8100 |
76.49762 |
UBE2J1 |
0.0140 |
6 |
3 |
6(0.01) |
5.29(0.0032) |
1.57(0.1199) |
-0.31589 |
67.8200 |
239.48779 |
MYC* |
0.0630 |
6 |
3 |
1(0.5) |
5.38(0.0029) |
1.42(0.1713) |
0.63538 |
22.5300 |
27.42303 |
Genes marked by a * / have been previously reported as targets of aSHM. |
|||||||||
Genes with SHM indicator less than 0.1 are bold. |
|||||||||
Since SHM activities are only associated with densely mutated regions, we would expect a decline in SHM feature values as the mutation rate decreases in the SHM-targets. In order to validate this hypothesis we divided the list of genes, sorted by mutation rate, into three groups. Expectedly, the IG loci were most highly ranked in the list. In particular, more than 20% of the top 60 SHM-targets belong to IG loci. Removing the IG loci and using them as a positive control group we divided the rest of the hypermutated SHM-targets into the following groups. Group I consists of the candidate SHM-targets (discussed earlier) that includes 44 SHM-targets with a mutation density above that of the known SHM targets. Group II consists of SHM-targets that are only moderately mutated. In particular, it includes SHM-targets that contain 3 to 5 SNVs observed in the input samples (92 SHM-targets) and group III consists of the remaining of the SHM-targets that contains at least two distinct SNVs (470 SHM-targets). Table 2 shows the average values of mutation features in each group as well as those in IG loci. As these data indicate the signals manifesting SHM activity degrades in SHM-targets with lower rate of somatic mutations. For instance, while the number of mutations in WCRY motif (after normalizing for base composition) is three times what is expected on a random basis in group I, it is only twice the random expected value in group II and is almost what is expected randomly in group III. Although some measures remain unchanged across groups, similar trends hold for many other measures as well, most notably, the SHM indicator measure that loses its significance by more than 2- fold in group II compared to group I.
Another indication of predominant SHM activity in the SHM-targets of group I and the IG group is the geographical pattern of mutations in these regions. Since the probability of mutations drops exponentially as the distance from TSS increases, the mutation density curve in the SHM-target region is expected to form a bell shape curve with its peak located in a region 150 to 1000 bases upstream the TSS. Such a trend can be observed more strongly in group I compare to groups II and III (see Figure 1). Figure 1 depicts the mutation density curve in a 12 kb region downstream of the TSS for the genes in each group. As the plots in this figure show the concentration of SNVs moves further away from the transcription start sites as we move from group I to group III. Furthermore, a two-sample Kolmogorov-Smirnov test (conducted using the ks.test R package) also suggests that the SNV distance distribution in group I is significantly different from that of group II and III (P < 2.2e −16), while the distance distributions in group II and III show a much higher degree of similarity (P = 0.03457).
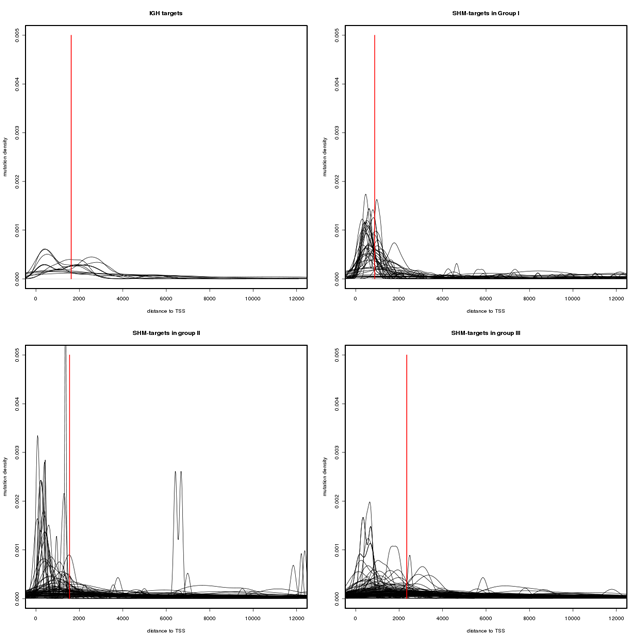
Figure 1: Mutation density in SHM-targets. The mutation density curves in a 12 kb region downstream of transcription start sites. The red bars indicate the median of the SNV distance to the transcription start sites. As the plots show the concentration of SNVs moves further away from the transcription start sites as we move from group I to group III. A Two-sample Kolmogorov-Smirnov test (conducted using the ks.test R package) also suggests that the SNV distance distribution in group one is significantly different from that of group two and three (P < 2.2e −16) while the distance distributions in group two and three show a much higher degree of similarity (P = 0.03457).
Another aspect of SHM is its reliance on active transcription. It has been shown that the elimination of transcription across an IG locus results in a loss of SHM [6] and also that the mutation rate of an IG gene is proportional to the level of transcription through that locus in a pre-B-cell line that supports SHM [24]. We investigated the correlation between transcription and the mutation in the SHM-targets using available RNA-seq data of the studied samples. These results show that in most of the cases the expression level of the targeted gene is higher in samples that are mutated compare to those that lack mutations in the SHM-target region (See Figure 2). In particular, 60% of the targets in group I show increase in RNA abundance by more than 10 percent (86% increase on average) in mutated samples while only in 16% of the cases the mutated samples have lower gene expression compare to samples with no mutation (14% decrease on average). The percentage difference is calculated as the difference between the RPKM values (mutated vs not mutated) divided by the sum of the RPKM values (See the last four columns in Table 2). This difference mostly reflects a trend towards higher mRNA abundance of the genes in the mutated samples, coinciding with the observation that gene expression promotes SHM. A statistical significance test also suggests that the expression of the genes that undergo SHM is significantly higher than the average expression of a randomly selected subset of the genes. More precisely, we generated multiple sets of k randomly chosen genes (where k is the number of genes in group I) from the genes with RPKM value over 1 (a total of 10800 genes), and performed a statistical significant test under the null hypothesis assumption that the average expression of the genes in group I comes from the same distribution governing the average expression of randomly selected set of genes. While a set of randomly selected genes has an average RPKM value of 50 the average RPKM value for the genes in group I is 350 resulting in a very significant p-value using a T-test (P < 10−90).
Groups |
SHM indicator |
Mutation enrichment in WRCY (P-value) |
C:G over A:T (P-value) |
Transition over Transversion (P-value) |
Average RPKM in Mutated Samples |
Average RPKM in Unmutated Samples |
RPKM fold change |
Average RPKM in Normal |
Group 1 (mutation rate > 8e-5) |
0.11 |
3.12(0.13) |
1.25(0.17) |
1.67(0.32) |
502.7 |
357.1 |
0.59 |
463.3 |
Group 2 (mutation rate > 4e-5) |
0.27 |
2.02(0.35) |
1.25(0.33) |
1.74(0.31) |
50.96 |
57.34 |
0.03 |
74.4 |
Group 3 |
0.38 |
1.17(0.45) |
1.1(0.51) |
0.72(0.33) |
50.29 |
50 |
0.03 |
48.72 |
IGH |
0.14 |
2.7(0.15) |
1.19(0.25) |
1.3(0.31) |
4482 |
2202 |
0.39 |
2846 |
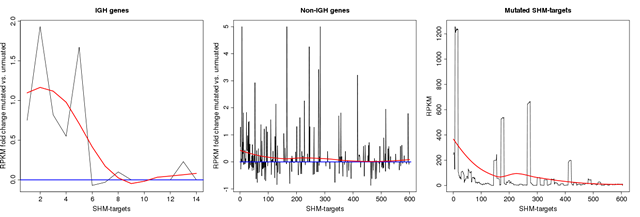
Figure 2: Transcription rate in SHM genes. The left and middle plots depict RPKM fold change between mutated and unmuated samples in SHM-target region across IGH and non-IGH loci in group I, respectively. Here a positive value indicates an up-regulation in samples with mutation. Expression change is set to zero for the genes with low level of expression (i.e. RPKM less than 5). As the data in the middle plot suggests, there are more targets with a positive expression change amongst those with high mutation rate. More precisely, while over 70% of the target regions in group 1 are up-regulated in mutated samples, this ratio is 50% for targets in other groups (i.e. as expected on a random basis). The right plot depicts the average RPKM values for all the genes that has at least two mutations in their SHM-target region. The data in this plot shows that the absolute expression level in genes with higher SHM activities is also higher on average. The red smooth curves in the plots are polynomial regression fittings over the values computed using the loess R package. The targets on x-axis are sorted by mutation density in their SHM-target regions.
We also investigated the correlation between aSHM and translocations. To do so, we first identified genome wide translocation events independent from the results of the aSHM study. The translocation events were identified using ABySS [25], which assembles the short reads in the first stage and determines structural variations through alignment of the resulting sequence contigs. We used a curated subset of these candidate translocation events in our analysis. Figure 3, depicts the curated (arcs) chromosomal translocations in hypermutable genes along with the frequency of somatic SNVs within these genes. In particular, we found that 9 genes out of the 60 genes in group I (including IGH genes) are involved in validated translocations (i.e. 15% in the cohort). The 9 curated rearranged genes in our DLBCL samples are: BACH2, IGHD, BCL2, DQ856481, IGHE, PIM1, IGHA2, BCL6, abParts (2p11.2) and MYC. In addition, 9 additional genes in group I (i.e. CIITA, ZFP36L1, ST6GAL1, SGK1, IRF8, GRHPR, BIRC3, CD74 and AK128638 ) are found to be involved in transcloation in an independent DLBCL cohort based on the analysis of their available transcriptome data (the whole genome data were not available for this cohort to study the correlation with aSHM). In the screening of transcriptome data derived from 9 normal centroblast samples, none of these translocations were observed supporting the hypothesis that these events may be tumor specific. The correlation between translocation and SHM can be observed in Figure 3. In particular, synchronism can be seen between the translocation and mutation hotspots around 5q33 (CD74), 3q27 (BCL6), 18q21 (BCL2), 14q24 (ZFP36L1 ), 12q24 (BCL7A), 11q22 (BIRC3) and 16q24 (IRF8). The recurrence of genomic rearrangements and SHM has been reported previously for both BCL2 and BCL6 but not for any of the remaining genes [15, 26, 27]. Somatic hypermutation however, is not always present in the context of translocation although SHM occurs more frequently in the context of translocations in some genes such as BCL2 and BCL6. But even for these genes, SHM can target the region in the absent of translocation. In particular in nearly 30% of the cases with mutations affecting BCL2, no translocation event was observed in the vicinity of this gene (See Table 3). Other genes that are less commonly involved in translocations or other genomic rearrangements are also targets of SHM, but that our observation of SHM in the absence of rearrangements is consistent with the notion that hypermutation is occurring at these loci in the absence of (or possibly as a prerequisite to) the double-stranded breaks that result in these rearragements. Conversely, translocations may be selected for within a tumour by positioning a gene into a location where oncogenic SHM mutations are more likely to occur.
Table 3: Somatic hypermutation and genomic rearrangements. Our observations show that somatic hypermutation commonly occurs in the absence of genomic rearrangements. Even for the BCL2 where aSHM previously reported in the context of (14:18) transclocation, we observed aSHM in the lack of any genomic rearrangment in several cases.
Gene |
Samples with mutations and rearrangements |
Samples with mutations only |
Samples without mutations or rearrangement |
BCL6 |
7 |
20 |
13 |
BCL2 |
8 |
3 |
29 |
BTG2 |
0 |
18 |
22 |
TMSL2 |
0 |
17 |
23 |
ZFP36L1 |
0 |
16 |
24 |
RHOH |
0 |
17 |
23 |
SERPINA9 |
0 |
7 |
33 |
CD83 |
0 |
8 |
32 |
SGK1 |
0 |
5 |
35 |
BCL7A |
0 |
14 |
26 |
BACH2 |
1 |
7 |
32 |
LTB |
0 |
10 |
30 |
BIRC3 |
0 |
12 |
28 |
HIST1H2AC |
0 |
9 |
31 |
TCL1A |
0 |
8 |
32 |
ST6GAL1 |
0 |
8 |
32 |
CD74 |
0 |
8 |
32 |
SOCS1 |
0 |
5 |
35 |
IRF8 |
0 |
9 |
31 |
BTG1 |
0 |
9 |
31 |
LRMP |
0 |
7 |
33 |
IRF4 |
0 |
4 |
36 |
CIITA |
0 |
9 |
31 |
DTX1 |
0 |
8 |
32 |
CXCR4 |
0 |
7 |
33 |
PIM1 |
1 |
6 |
33 |
S1PR2 |
0 |
7 |
33 |
SPRED2 |
0 |
6 |
34 |
PAX5 |
0 |
7 |
33 |
DMD |
0 |
3 |
37 |
CLEC2D |
0 |
3 |
37 |
ETS1 |
0 |
8 |
32 |
DUSP2 |
0 |
4 |
36 |
POU2AF1 |
0 |
6 |
34 |
GADD45B |
0 |
6 |
34 |
MS4A1 |
0 |
4 |
36 |
P2RY8 |
0 |
3 |
37 |
GRHPR |
0 |
5 |
35 |
NCOA3 |
0 |
4 |
36 |
UBE2J1 |
0 |
3 |
37 |
MYC |
1 |
2 |
37 |
We also screened recurrently targeted aSHM genes (i.e. the 44 genes in group I) against genes that are known to be cancer related. We selected a total of 3632 cancer related genes through a union of several credible cancer gene repositories including the CancerGenes database [28] that combines gene lists annotated by experts with information from key public databases and the Cancer Gene Census [29] that catalogues the genes for which mutations have been causally implicated in cancer. The abundance of cancer related genes in our recurrent aSHM targets shows that somatic hypermutation systematically targets genes that play a significant role in cancer development. More precisely, 29 genes (i.e. 66%) were found to exist in the cancer related genes (P < 10−20) out of which 13 genes (i.e. 30%) were known proto-oncogenes (P < 10−4).
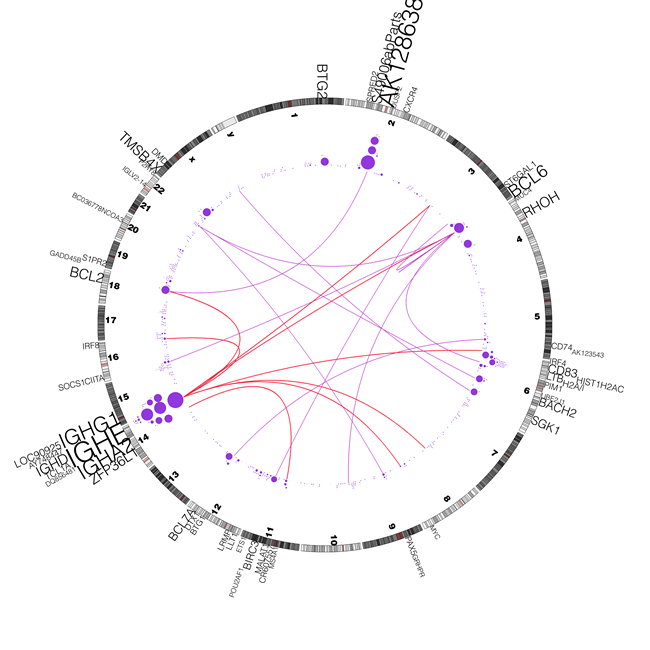
Figure 3: Correlation between mutations and rearrangements. Distribution of somatic mutations in SHM-targets and correlation with genome rearrangements. A circos diagram [47] showing the distribution of somatic mutations in recurrently mutated SHM-targets and genomic rearrangements such as translocations and inversions. The purple circles represent the count of SNVs in the corresponding SHM-targets, and the arcs represent the chromosomal translocation events. The red and purple arcs represent translocation involving IGH loci and non-IGH loci, respectively. The size of the circles and the gene labels are proportional to the number of mutations in the SHM-target.
The list of aSHM-targeted genes that have a role in cancer can be found in Supplementary Table 2. But perhaps more intriguing are the aSHM targets that have not been previously linked with cancer. These are are TMSB4X, SERPINA9, CD83, LTB, HIST1H2AC, CR607557, S1PR2, MALAT1, LLT1, AK123543, MS4A1 and UBE2J1. Abnormal regulation of some of these genes such as TMSB4X [30], SERPINA9 [31], CD83 [29] and LTB [32] has been observed in various types of cancer, including lymphoma. In addition, in the screening of the genes with reported variations in lymphoma from the COSMIC repository [33] and a collection of DLBCL related genes in the literature (See Supplementary Table 3) [12, 348211;43], we confirmed that 21 of the genes in group I (See Supplementary Table 4), have been previously linked to lymphoma. While this finding on one hand shows that the recurrently aSHM targets are enriched with known lymphoma related genes (P < 10−10), on the other hand it shows that most of the mutations reported in this study are novel in lymphoma.
It would be of interest to determine whether differences exist in the mutations patters of individual genes in the Activated B-cell (ABC) and Germinal B-cell (GCB) subtypes of Group 1. We investigated this question on our cohort that consists 13 ABC and 23 GCB ( 4 samples have not been morphologically grouped). Our analysis shows that although some genes are favorably mutated in the samples of one subgroup (for instance BCL2, MALAT1, S1PR2 and SERPINA9 are mutated exclusively in GCB samples), however, the statistical power in our data is not sufficient to show that aSHM favorably targets one subgroup compare to another (See Supplementary Figure 1). For instance, although SERPINA9 is only mutated in GCB samples its P-value is 0.15 (Fisher’s exact test) even before the multiple test correction.
The genes in group 1 were also tested for enrichment of certain functional classes using the DAVID functional annotation clustering tool. This revealed significant enrichment for genes involved in lymphocyte activation (P = 0.0056, Benjamini) and transcription factor activity (P = 0.0036, Benjamini) including known lymphoma-related genes such as the oncogenes BCL2 and BCL6 but also novel genes including CXCR4, RHOH, CD74 and MS4A1 (which encodes CD20, the target of the therapeutic monoclonal antibody rituxumab). The SHM targets were also enriched for genes involved in regulation of phosphorylation (P=0.008, Benjamini) including SOCS1, DUSP2, SGK1 and PIM1.
Conclusions
We described genome wide recurrent targets of somatic hypermutations in diffuse large B-cell lymphoma. The mutation characteristics and distributions in the targeted regions resemble those of the SHM mutations in IGH loci and other known targets of aSHM in B-cell malignancies. Our analysis further confirms a significant concordance between genome rearrangements and SHM activities in the affected genes, an observation that has been previously reported. We observed aSHM at sites known ot be involved in translocations but in the absence of translocations, which is consistent with a model wherein aSHM may precede the genetic events that result in these rearrangements. It is possible that some of the observed SHM events arise in the B-cells prior to malignant transformation however unlikely, since it is known that other B-cell derived malignancies do not display aSHM events [12] other than those known to occur normally in B-cells [1, 2]. While the role of aberrant somatic hypermutation in malignant formation in lymphoma has been widely acknowledged, no effort has previously been made to comprehensively assess targeted genes. This work a comprehensive survey of genes affected by SHM. These data may help us to understand the mechanism by which SHM is targeted to proto-oncogene and provides a basis for DLBCL pathogenesis.
Materials and methods
Sample preparation and sequencing were conducted as previously described [34]. The data is available in NCBI’s Sequence Read Archive through accession code SRP001599. Variations were called using an in-house pipeline. Briefly, BWA [44] was used for alignment of sequence reads and then variants were called on genomic libraries using samtools-0.1.13 [45] pileup functionality, after the libraries have been merged and the duplicates marked using picard-tools-1.38 MarkDuplicates with default settings. An independent validation of the merge process compares the sum of the total number of reads of the individual lanes with that of the final files total number of reads to ensure data integrity. The resulting variant calls are filtered using samtools-01.13 varFilter and only those variants which pass the quality threshold of 20 were used in the analysis. We identified SNVs in the SHM-targets of the all the genes in the UCSC’s knownGene track. Somatic putative SNVs were selected throughout filtering these tumor SNVs against the variations of the thousand genome projects and matched normals variants of the DLBCL patients. Each of these somatic putative SNVs were then validated using a bioinformatic approach through which the aligned reads in the tumor and the matched normal samples at the variation positions were analyzed case by case in order to eliminate germline variations or artifacts. More precisely, the variations that are also observed in the matched normal samples (i.e. germline variations) or those with low quality mapped reads were eliminated (at least 20% of the reads with mapping quality over 25 and base call quality over 10 are required to be mapped to the mutated allele in order to select a variation).
Here we explain how the statistical measures are calculated for the variations in SHM-target regions. Note that some of these measures are only included in the Supplementary tables and not in the main tables 1 and 2. The mutation density in each sample is calculated by diving the number of mutations in the SHM-target by the length of the SHM-target region. The average of mutation density across all samples is used as the mutation density for the corresponding SHM-target region. The p-value associated with each SHM-target is calculated using the Fisher’s exact test by assigning the success rate as the probability that a somatic SNV occurs in the SHM-target region on a random basis and plugging in the number of somatic mutations across the genome and SHM-target region in the Fisher’s exact test formula. These p-values are then corrected for multiple testing across all the SHM-target regions using the Benjamini method. The variation enrichment value in WRCY motif is the ratio of the number mutations in a WRCY motif over the expected number of mutations in a WRCY motif. The expected number of mutations in a WRCY motif is calculated by taking the percentage of the bases that occur in a WRCY motif in the SHM-target region and multiplying it to the number of SNVs in that SHM-target region. By assigning the percentage of the bases that occur within a motif as the success rate in Fisher’s exact test, we calculated a significance value for the motif enrichment in each region. The enrichment and significance values for base specific SNVs (i.e. the enrichment of SNVs at G:C bases compare to A:T bases) are calculated in a similar manner. Note that these calculations take into account the base composition in the corresponding regions.
Translocation events were identified using ABySS [25] and then manual review was performed using IGV to view the reads to genome and exon-exon junction alignment of the RNA-seq data. Each library was viewed with 2 other libraries to establish whether the evidence for the rearrangement event looked credible.
Read alignments relative to the breakpoint and read mapping quality were taken into account. The gene expression values were calculated as reads per kilo base gene model per million mapped reads (RPKM) values from RNA-seq data derived from the tumors [46].
Competing interests
None declared.
Author’s contributions
AH. Khodabakhshi performed the research, developed analysis software and wrote the paper. RD. Morin contributed to the analysis of the data and writing of the paper. AP. Fejes contributed to the software development. AJ. Mungall performed the analysis of the genome rearrangement events. KL. Mungall performed and curated the analysis of the rearrangement events. M. Bolger-Munro1 and NA. Johnson contributed to the characterization of the lymphomas. JM. Connors, RD. Gascoyne, MA. Marra and I. Birol contributed to conceiving and designing the research. SJM. Jones contributed to conceiving and designing the research and contributed to the writing of the paper.
Acknowledgments
This project has been funded in whole or in part with Federal Funds from the National Cancer Institute, National Institutes of Health, under Contract No. NO1-CO-12400. The content of this publication does not necessarily reflect the views or policies of the Department of Health and Human Services, nor does mention of trade names, commercial products, or organizations imply endorsement by the U.S. Government. This study was funded in part by funding from the Terry Fox Foundation (grant 019001, Biology of Cancer: Insights from Genomic Analyses of Lymphoid Neoplasms) and Genome Canada/Genome British Columbia Grant Competition III (Project Title: High Resolution Analysis of Follicular Lymphoma Genomes) to J.M.C., R.D.G. and M.A.M. We acknowledge support from NIH grants P50CA130805-01 ”SPORE in Lymphoma, Tissue Resource Core (PI Fisher)” and 1U01CA114778 ”Molecular Signatures to Improve Diagnosis and Outcome in Lymphoma (PIChan)”. S.J.M.J. is a scholar of Michael Smith Foundation for Health Research and A.H. is a post doctoral fellow at the Michael Smith Genome Sciences Centre. A.J.M. is a Career Development Program Fellow of the Leukemia and Lymphoma Society. N.A.J. was a research fellow of the Terry Fox Foundation(award NCIC 019005) and the Michael Smith Foundation for Health Research (ST-PDF-01793). M.A.M. is a Terry Fox Young Investigator and a Michael Smith Senior Research Scholar. R.D.M. is a Vanier Scholar (CIHR) and holds a MSFHR senior graduate studentship. The laboratory work for this study was undertaken at the Genome Sciences Centre, British Columbia Cancer Research Centre. The authors would like to thank Robert Holt for discussions. Special thanks to the Library Construction, Sequencing and Bioinformatics teams at the Genome Sciences Centre.
Reference
1. Muschen M, Re D, Jungnickel B, Diehl V, Rajewsky K, Kuppers R. Somatic mutation of the CD95 gene in human B cells as a side-effect of the germinal center reaction. J. Exp. Med. 2000; 192:1833–1840.
2. Pasqualucci L, Migliazza A, Fracchiolla N, William C, Neri A, Baldini L, Chaganti RS, Klein U, Kuppers R, Rajewsky K, Dalla-Favera R. BCL-6 mutations in normal germinal center B cells: evidence of somatic hypermutation acting outside Ig loci. Proc. Natl. Acad. Sci. U.S.A. 1998; 95:11816–11821.
3. Di Noia JM, Neuberger MS. Molecular mechanisms of antibody somatic hypermutation. Annu. Rev. Biochem. 2007; 76:1–22.
4. Neuberger MS, Harris RS, Di Noia J, Petersen-Mahrt SK. Immunity through DNA deamination. Trends Biochem. Sci. 2003; 28:305–312.
5. Odegard VH, Schatz DG. Targeting of somatic hypermutation. Nat. Rev. Immunol. 2006; 6:573–583.
6. Storb U, Peters A, Klotz E, Kim N, Shen HM, Hackett J, Rogerson B, Martin TE. Cis-acting sequences that affect somatic hypermutation of Ig genes. Immunol. Rev. 1998; 162:153–160.
7. Rada C, Milstein C. The intrinsic hypermutability of antibody heavy and light chain genes decays exponentially. EMBO J. 2001; 20:4570–4576.
8. Rossi D, Cerri M, Capello D, Deambrogi C, Berra E, Franceschetti S, Alabiso O, Gloghini A, Paulli M, Carbone A, Pileri SA, Pasqualucci L, Gaidano G. Aberrant somatic hypermutation in primary mediastinal large B-cell lymphoma. Leukemia. 2005; 19:2363–2366.
9. Rogozin IB, Diaz M. Cutting edge: DGYW/WRCH is a better predictor of mutability at G:C bases in Ig hypermutation than the widely accepted RGYW/WRCY motif and probably reflects a two-step activation-induced cytidine deaminase-triggered process. J. Immunol. 2004; 172:3382–3384.
10. Unniraman S, Schatz DG. Strand-biased spreading of mutations during somatic hypermutation. Science. 2007; 317:1227–1230.
11. Liso A, Capello D, Marafioti T, Tiacci E, Cerri M, Distler V, Paulli M, Carbone A, Delsol G, Campo E, Pileri S, Pasqualucci L, Gaidano G, Falini B. Aberrant somatic hypermutation in tumor cells of nodular-lymphocyte-predominant and classic Hodgkin lymphoma. Blood. 2006; 108:1013–1020.
12. Pasqualucci L, Neumeister P, Goossens T, Nanjangud G, Chaganti RS, Kuppers R, Dalla-Favera R. Hypermutation of multiple proto-oncogenes in B-cell diffuse large-cell lymphomas. Nature. 2001; 412:341–346.
13. Lenz G, Staudt LM. Aggressive lymphomas. N. Engl. J. Med. , 362:1417–1429, Apr 2010.
14. Liu M, Duke JL, Richter DJ, Vinuesa CG, Goodnow CC, Kleinstein SH, Schatz DG. Two levels of protection for the B cell genome during somatic hypermutation. Nature. 2008; 451:841–845.
15. Kuppers R, Dalla-Favera R. Mechanisms of chromosomal translocations in B cell lymphomas. Oncogene. 2001; 20:5580–5594.
16. Goossens T, Klein U, Kuppers R. Frequent occurrence of deletions and duplications during somatic hypermutation: implications for oncogene translocations and heavy chain disease. Proc. Natl. Acad. Sci. U.S.A. 1998; 95:2463–2468.
17. Pasqualucci L, Guglielmino R, Malek SN, et al. Aberrant somatic hypermutation targets an extensive set of genes in diffuse large B-cell lymphoma. Blood (ASH Annual Meeting Abstracts). 2004; 104:1528.
18. Saito M, Novak U, Piovan E, Basso K, Sumazin P, Schneider C, Crespo M, Shen Q, Bhagat G, Califano A, Chadburn A, Pasqualucci L, Dalla-Favera R. BCL6 suppression of BCL2 via Miz1 and its disruption in diffuse large B cell lymphoma. Proc. Natl. Acad. Sci. U.S.A. 2009; 106:11294–11299.
19. Mottok A, Renne C, Seifert M, Oppermann E, Bechstein W, Hansmann ML, Kuppers R, Brauninger A. Inactivating SOCS1 mutations are caused by aberrant somatic hypermutation and restricted to a subset of B-cell lymphoma entities. Blood. 2009; 114:4503–4506.
20. Hsu F, Kent WJ, Clawson H, Kuhn RM, Diekhans M, Haussler D. The UCSC Known Genes. Bioinformatics. 2006; 22:1036–1046.
21. Auer RL, Starczynski J, McElwaine S, Bertoni F, Newland AC, Fegan CD, Cotter FE. Identification of a potential role for POU2AF1 and BTG4 in the deletion of 11q23 in chronic lymphocytic leukemia. Genes Chromosomes Cancer; 2005. 43(1):1–10.
22. Turkmen S, Riehn M, Klopocki E, Molkentin M, Reinhardt R, Burmeister T. A BACH2-BCL2L1 fusion gene resulting from a t(6;20)(q15;q11.2) chromosomal translocation in the lymphoma cell line BLUE-1. Genes Chromosomes Cancer. 2011; 50:389–396.
23. Kobayashi S, Taki T, Chinen Y, Tsutsumi Y, Ohshiro M, Kobayashi T, Matsumoto Y, Kuroda J, Horiike S, Nishida K, Taniwaki M. Identification of IGHCI-BACH2 fusion transcripts resulting from cryptic chromosomal rearrangements of 14q32 with 6q15 in aggressive B-cell lymphoma/leukemia. Genes Chromosomes Cancer. 2011; 50:207–216.
24. Bachl J, Carlson C, Gray-Schopfer V, Dessing M, Olsson C. Increased transcription levels induce higher mutation rates in a hypermutating cell line. J. Immunol. 2001; 166:5051–5057.
25. Robertson G, Schein J, Chiu R, Corbett R, Field M, Jackman SD, Mungall K, Lee S, Okada HM, Qian JQ, Griffith M, Raymond A, Thiessen N, Cezard T, Butterfield YS, Newsome R, Chan SK, et al. De novo assembly and analysis of RNA-seq data. Nat. Methods. 2010; 7:909–912.
26. Lo Coco F, Ye BH, Lista F, Corradini P, Offit K, Knowles DM, Chaganti RS, Dalla-Favera R. Rearrangements of the BCL6 gene in diffuse large cell non-Hodgkin’s lymphoma. Blood. 1994; 83:1757–1759.
27. Willis TG, Dyer MJ. The role of immunoglobulin translocations in the pathogenesis of B-cell malignancies. Blood. 2000; 96:808–822.
28. Higgins ME, Claremont M, Major JE, Sander C, Lash AE. CancerGenes: a gene selection resource for cancer genome projects. Nucleic Acids Res. , 35:D721–726, Jan 2007.
29. Futreal PA, Coin L, Marshall M, Down T, Hubbard T, Wooster R, Rahman N, Stratton MR. A census of human cancer genes. Nat. Rev. Cancer. 2004; 4:177–183.
30. Nummela P, Yin M, Kielosto M, Leaner V, Birrer MJ, Holtta E. Thymosin beta4 is a determinant of the transformed phenotype and invasiveness of S-adenosylmethionine decarboxylase-transfected fibroblasts. Cancer Res. 2006; 66:701–712.
31. Frazer JK, Jackson DG, Gaillard JP, Lutter M, Liu YJ, Banchereau J, Capra JD, Pascual V. Identification of centerin: a novel human germinal center B cell-restricted serpin. Eur. J. Immunol. 2000; 30:3039–3048.
32. Warzocha K, Renard N, Charlot C, Bienvenu J, Coiffier B, Salles G. Identification of two lymphotoxin beta isoforms expressed in human lymphoid cell lines and non-Hodgkin’s lymphomas. Biochem. Biophys. Res. Commun. 1997; 238:273–276.
33. Forbes SA, Bindal N, Bamford S, Cole C, Kok CY, Beare D, Jia M, Shepherd R, Leung K, Menzies A, Teague JW, Campbell PJ, Stratton MR, Futreal PA. COSMIC: mining complete cancer genomes in the Catalogue of Somatic Mutations in Cancer. Nucleic Acids Res. 2011; 39:D945–950.
34. Morin RD, Mendez-Lago M, Mungall AJ, Goya R, Mungall KL, Corbett RD, Johnson NA, Severson TM, Chiu R, Field M, Jackman S, Krzywinski M, Scott DW, Trinh DL, et al. Frequent mutation of histone-modifying genes in non-Hodgkin lymphoma. Nature. 2011; 476:298–303.
35. Compagno M, Lim WK, Grunn A, Nandula SV, Brahmachary M, Shen Q, Bertoni F, Ponzoni M, Scandurra M, Califano A, Bhagat G, Chadburn A, Dalla-Favera R, Pasqualucci L. Mutations of multiple genes cause deregulation of NF-kappaB in diffuse large B-cell lymphoma. Nature. 2009; 459:717–721.
36. Du MQ, Peng H, Liu H, Hamoudi RA, Diss TC, Willis TG, Ye H, Dogan A, Wotherspoon AC, Dyer MJ, Isaacson PG. BCL10 gene mutation in lymphoma. Blood. 2000; 95:3885–3890.
37. Eis PS, Tam W, Sun L, Chadburn A, Li Z, Gomez MF, Lund E, Dahlberg JE. Accumulation of miR-155 and BIC RNA in human B cell lymphomas. Proc. Natl. Acad. Sci. U.S.A. 2005; 102:3627–3632.
38. Huang W., Sherman BT, Lempicki RA. Bioinformatics enrichment tools: paths toward the comprehensive functional analysis of large gene lists. Nucleic Acids Res. 2009; 37:1–13.
39. Lenz G, Wright GW, Emre NC, Kohlhammer H, Dave SS, Davis RE, Carty S, Lam LT, Shaffer AL, Xiao W, Powell J, Rosenwald A, Ott G, Muller-Hermelink HK, Gascoyne RD, Connors JM, et al. Molecular subtypes of diffuse large B-cell lymphoma arise by distinct genetic pathways. Proc. Natl. Acad. Sci. U.S.A. 2008; 105:13520–13525.
40. Mottok A, Renne C, Willenbrock K, Hansmann ML, Brauninger A. Somatic hypermutation of SOCS1 in lymphocyte-predominant Hodgkin lymphoma is accompanied by high JAK2 expression and activation of STAT6. Blood. 2007; 110:3387–3390.
41. Pasqualucci L, Trifonov V, Fabbri G, Ma J, Rossi D, Chiarenza A, Wells VA, Grunn A, Messina M, Elliot O, Chan J, Bhagat G, Chadburn A, Gaidano G, Mullighan CG, Rabadan R, Dalla-Favera R. Analysis of the coding genome of diffuse large B-cell lymphoma. Nat. Genet. 2011; 43:830–837.
42. Pasqualucci L, Compagno M, Houldsworth J, Monti S, Grunn A, Nandula SV, Aster JC, Murty VV, Shipp MA, Dalla-Favera R. Inactivation of the PRDM1/BLIMP1 gene in diffuse large B cell lymphoma. J. Exp. Med. 2006; 203:311–317.
43. Rui L, Schmitz R, Ceribelli M, Staudt LM. Malignant pirates of the immune system. Nat. Immunol. 2011; 12:933–940.
44. Li H, Durbin R. Fast and accurate long-read alignment with Burrows-Wheeler transform. Bioinformatics. 2010; 26:589–595.
45. Li H, Handsaker B, Wysoker A, Fennell T, Ruan J, Homer N, Marth G, Abecasis G, Durbin R. The Sequence Alignment/Map format and SAMtools. Bioinformatics. 2009; 25:2078–2079.
46. Mortazavi A, Williams BA, McCue K, Schaeffer L, Wold B. Mapping and quantifying mammalian transcriptomes by RNA-Seq. Nat. Methods. 2008; 5:621–628.
47. Krzywinski M, Schein J, Birol I, Connors J, Gascoyne R, Horsman D, Jones SJ, Marra MA. Circos: an information aesthetic for comparative genomics. Genome Res. 2009; 19:1639–1645.