
INTRODUCTION
The CCAAT box is an important element present in promoters and enhancers of eukaryotic genes. It is bound by the evolutionarily conserved NF-Y (also named CBF), a trimer formed by NF-YA, NF-YB and NF-YC. NF-YB and NF-YC have histone-like structures, which, upon hetero-dimerization, present a complex surface for NF-YA association, in turn providing sequence-specific CCAAT recognition [1]. The use of genome-wide assays has generalized the concept previously derived by in vitro experiments that NF-Y is the primary CCAAT binding protein [2]. Yeast S. cerevisiae produces energy and ethanol through glycolysis and fermentation when grown in medium containing glucose; when challenged with non-fermentable carbon sources, yeast cells switch to oxygen-fueled metabolism, by activation of nuclear genes of the mitochondrial respiratory complexes. All these genes contain a CCAAT sequence in their regulatory UAS (Upstream Activating Sequences) sequences and are dependent upon the NF-Y yeast homologue HAP2/3/4/5 [3].
In mammals, the NF-Y regulome is apparently more complex, but it is becoming intelligible, thanks to converging sets of data: (i) the precise biochemical characterization of the target sequence led to the definition of a DNA-binding matrix with high information content, characterized in hundreds mammalian promoters, highlighting a strong positional bias [4]; (ii) Genome-wide experiments confirmed and further extended these observations to enhancers and other genomic regions [5-11]; (iii) Profiling analysis of genes whose expression is affected by functional inactivation of one of the subunits [11-13] found that in addition to a positive role on transcriptional units, NF-Y is also part of repressive mechanisms of transcription.
A common theme in the analysis of the NF-Y regulome in mammalian cells is the presence of the term metabolism at the top of Gene Ontology categorizations; functional dissection of individual promoters of metabolic genes indeed indicated the importance of NF-Y for high level of expression. There has been a renewed interest in the transcriptional control of such genes, since specific metabolic pathways are found altered in cancer cells; a vast array of biochemical, genetic and pharmacological data highlight the importance of the expression levels of single genes for “metabolic reprogramming”, an hallmark of the development and progression of tumors [14-16]. This is well exemplified by the recent computational evaluation of expression levels of genes of the SOCG -Serine One Carbon Glycine- pathway across cancer samples, indicating that collective overexpression of genes is predictive of the increased flux of metabolites observed in tumors [17]. Interestingly, analysis of large sets of expression profilings comparing tumors and normal tissues indicate that the NF-Y matrix is enriched in promoters of genes overexpressed in cancer cells [18]; however, it was not determined whether these genes belong to specific pathways. Finally, compelling genetic experiments have recently established that NF-YC, with TAF12 and RAD54L, is a driver oncogene of choroid plexus carcinomas [19].
For these reasons, we decided to take a closer look at the metabolic pathways influenced by the transcriptional activity of NF-Y. We analyzed available genomic data and performed additional gene expression experiments after inactivation of NF-Y subunits, to rationalize its role in the regulation of metabolic genes. The results point to specific pathways, and within them specific nodes, which are under tight NF-Y control.
RESULTS AND DISCUSSION
Experimental strategy
Top rank GO terms of NF-Y-regulated genes include metabolic pathways [11-13]. For this reason, we focused specifically on metabolic genes with the following strategy.
(i) We analyzed the results of Affymetrix gene expression profilings of Hela-S3 cells inactivated of NF-YA by shRNA interference [11] and performed additional profilings in epithelial HCT116 and H322 cells under identical conditions of NF-YA inactivation. Fig. S1 shows the levels of NF-YA, as assessed by Western blot analysis; the complete list of genes up- and down-regulated in HCT116 and H322, considering a threshold of 1.3 fold difference, is in Fig. S2. Moreover, we analyzed the recently reported profilings data of mouse embryonic stem (mES) cells functionally inactivated of individual and of all three subunits of NF-Y [12].
(ii) To validate profilings, we analyzed the expression of selected genes of the affected pathways by qRT-PCR after inactivation of the NF-YB subunit in Hela-S3 cells with two different shRNAs.
(iii) To match function with location, we analyzed ChIP-Seq data of NF-YA and NF-YB in Hela-S3, GM12878 and K562 derived from ENCODE [9, 11], as well as the individual binding of the three subunits in mouse ES cells [12]. Specifically, we verified binding to the bona fide CCAAT matrix in the prototypical promoter position, between -60 and -100 from the TSS [4], as well as in distal locations classified as enhancers by virtue of the presence of appropriate epigenetic marks (H3K27ac, H3K4me1).
The lack of NF-Y functional dependence in the presence of promoter binding might be due to an effective CCAAT-independence of the gene -and activity of compensatory TFs- or to the long half-life of the specific mRNA—the latter is a particularly relevant point, as we consider here housekeeping genes involved in basic metabolic functions, whose mRNAs tend to be relatively stable.
Overall density of NF-Y regulated genes in metabolic pathways
The profilings and ChIP-Seq data of Hela-S3 cells were first analyzed within the KEGG global metabolic chart. Genes whose expression is decreased after NF-YA inactivation are in red and those increased are in green (Fig. 1A); genes with core promoters bound by NF-YA are in blue (Fig. 1B). The charts of gene expression profilings of human H322 and HCT116 cells after NF-YA, and of mouse ES cells after NF-YA, NF-YB and NF-YC inactivation, are shown in Figs. S3 and S4. Genes bound by NF-YB in Hela-S3, showing marginal differences with NF-YA, are in Fig. S5. Similarly, NF-YA and NF-YB binding in K562 and GM12878, as well as NF-YA, NF-YB and NF-YC in mES cells are shown in Figs. S6-8. A bird’s eye view of the results collectively indicates high densities in areas of lipids, carbohydrates and nucleotides metabolisms. Other locations -glycan, vitamins, terpenoids and xenobiotics- are mostly depleted, with only selected genes positive. Aminoacids pathways show density in specific areas. We calculated the statistical significance of the regulated pathways in profilings of Hela-S3 and mES cells using KOBAS 2.0 [20], a software providing a better definition for the different metabolic sub-pathways. This led to the identification of globally enriched terms (Fig. S9). As previously reported [11], the Hela-S3 pathways at the top of the list are related to cell-cycle and mitosis, but specific metabolic terms are enriched and they are indeed predominant in mES cells. Focusing specifically on metabolic terms (Table 1), we note that anabolic genes are less expressed after NF-Y removal, whereas catabolic ones tend to be increased; among the formers, aminoacids -notably Ala, Asp, Glu; Ser, Gly; Gln- lipids and nucleic acids are enriched. As for carbohydrate, carbon metabolism -mostly glycolysis- is enriched. We hereafter further examine the role of NF-Y in such pathways.
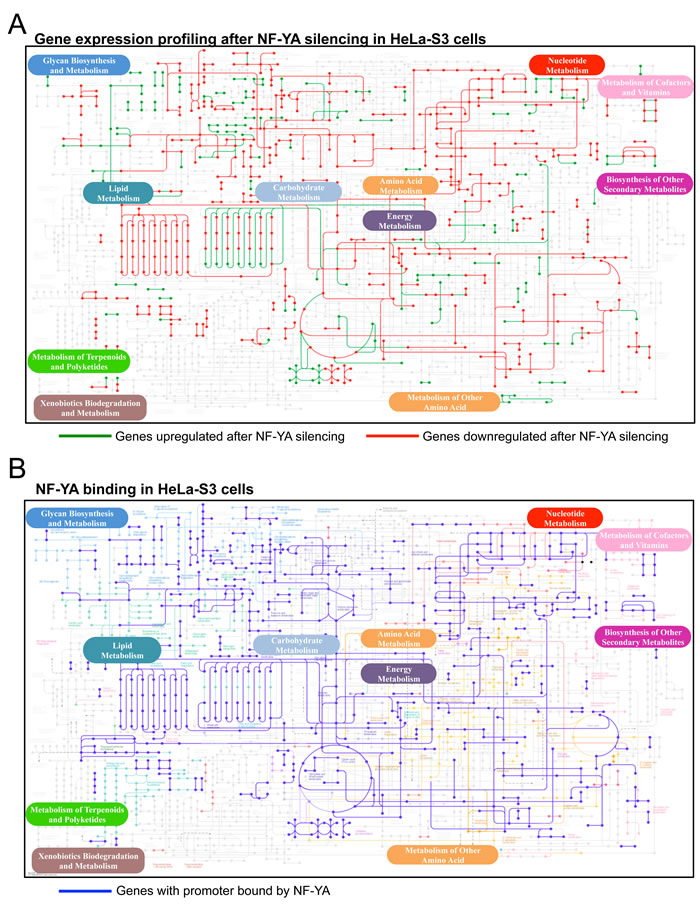
Figure 1: NF-Y targets in metabolic pathways. Global map of metabolic pathways targeted by NF-YA. A. Metabolic genes upregulated (in green) and downregulated (in red) after silencing of NF-YA in HeLa cells [11]. B. Metabolic genes with core promoters bound by NF-YA are indicated in blue according to ENCODE ChIP-Seq data. The maps are constructed with the KEGG Mapper v 2.5 tool.
Lipids metabolism
NF-Y activates genes of the two main branches of lipids metabolism, cholesterol and fatty acids (Fig. 2A): inactivation leads to decreased expression of most cholesterol genes, with the exception of HMGCS2, GGPS1, IDI1/2, HSD17B7, SC5D (Fig. 2A). A similar situation is observed for the fatty acids branch. With the exception of HMGCS2, IDI2 and PMVK, all promoters are bound in vivo in most cell types, including those negatively regulated in mES cells. Rate limiting enzymes of cholesterol -HMGCS1, HMGCR, Squalene Synthase (SQLE), DHCR - and fatty acids pathways -Acetyl COA Carboxylase (ACACA), Fatty Acids Synthase (FASN), Steatoryl CoA Desaturase (SCD)- were previously reported to be under NF-Y positive control [21-36]. Acyl-CoA lyase (ACLY) and Acetyl-CoA synthase of the short chains (ACSS2) are also controlled.
Sustained proliferation rates of cells require a high level of de novo biosynthesis of lipids, which are incorporated into newly formed cell membranes. Indeed, these pathways are crucial for cancer cells, and many genes are overexpressed [37]. What is particularly relevant is that the genes more sensitive to NF-Y-inactivation are also those implicated in cancer development. On the cholesterol side, the mevalonate genes are overexpressed in many cancers, including HMGCS1, indeed a cancer-driving gene [38], and the target of statins, a promising “new” class of anti-cancer drugs [39]. In the fatty acids branch, NF-Y targets FASN, SCD1 and GPAM, frequently overexpressed in tumors; FASN is a driver of neoplastic transformation [40]. ACSS2 is essential for transformation of acetate to Acetyl-CoA, thereafter used for lipids synthesis, as well as for histone acetylations [41,42]; expression of ACSS2 is high in many types of tumors and KO mice are protected in mouse models of liver carcinogenesis. The parallel strong NF-Y positivity of the less studied ACSM3 and ACSL3 invites evaluation of their expression levels across cancer samples, and role in tumorigenesis. Finally, ACLY is at the crossroad of lipids and glucose metabolism, mediating the production of Acetyl-CoA by transformation of cytoplasmic citrate to oxaloacetate. ACLY deregulation is generally observed in cancer, often correlating with tumor stage and prognosis [43] and silencing blocks proliferation of cancer cells by different mechanisms, impairing lipid biosynthesis, glycolytic enzymes, citrate accumulation and histones acetylation.
SREBP-1 and SREBP-2 are the master TFs of cholesterol and fatty acids biosynthesis [44]; the SREBP-1 gene itself is controlled by NF-Y [45, 46]. Genome-wide experiments reported a significant overlap between NF-YA and SREBP-1 sites [7], and enrichment of NF-Y sites in SREBP-1 peaks in mouse liver cells [47]. ChIP-Seq data of SREBP-1/2 in HepG2 and GM12878 were recently reported by the ENCODE consortium: inspection of binding to lipidogenic genes indicates a perfect correlation with NF-Y in cholesterol genes, and near perfect in fatty acids genes (SREBP1/2 positive promoters are marked in grey in Fig. 2A). We thus decided to analyze the global genomic overlap of NF-Y and SREBP-1/2: to do so, we used the PScan-ChIP software [48], which allows the identification of Transcription Factor Binding Site (TFBS) present in the JASPAR or TRANSFAC databases, as enriched in close proximity -<75 bps- of genomic peaks of a given TF. The statistical enrichment of positively correlating TFBSs is measured as “global” or “local“, depending on the robustness of the overlap (Fig. S10). The results of such analysis for SREBP-1 and SREBP-2 are shown in Fig. 2B: the NF-Y consensus present in JASPAR -termed NFYA or NFYB- is significantly enriched in SREBP-1 and SREBP-2 peaks in HepG2 cells treated with pravastatin, but not in untreated GM12878 (Fig. S10); similarly, SREBP-1 peaks are enriched in CCAAT boxes in HepG2 cells treated with insulin. For SREBPs in pravastatin treated HepG2, the program signals “global” enrichments -p values of 10-20- indicating that the CCAAT box is a “primary” binding site. By comparison, the SREBF motif has similar p values, indicating that the majority of SREBP-1 genomic sites in HepG2 have both a canonical SRE and a CCAAT box. No other TFBS is significantly enriched. The data of SREBP-1 peaks of insulin-treated HepG2 are very similar, except that RFX motifs also emerge, with similar frequencies (Fig. 2B). To validate these results, we used the MEME tools for de novo motif discovery, to inspect SREBP-1/2 genomic peaks: we indeed retrieved logos identical to the NF-Y binding site -the ATTGG reverse of CCAAT- in addition to the expected SRE sequence, and, in insulin-treated HepG2, the RFX logo (Fig. 2B). Thus, two types of analysis indicate that NF-Y and SREBPs share a vast set of genomic locations, extending beyond lipidogenic genes, at least in liver cells. Intriguingly, this is not observed in untreated GM12878 B cells, possibly suggesting treatment- or cell-type specific regulation.
Mechanistically, NF-Y and SREBPs are believed to serve different functions in transcriptional activation: the former as a “pioneer” TF, which binds to promoters and predispose a positive chromatin environment [11, 12, 49, 50]; SREBPs as “activator” TFs promoting transcriptional elongation. In fact, nuclear translocation and DNA-binding of SREBPs are visible under specific conditions: typically, this requires relocation from the ER into the nucleus, following addition of PTMs and proteolysis, according to specific stimuli [44, 47].
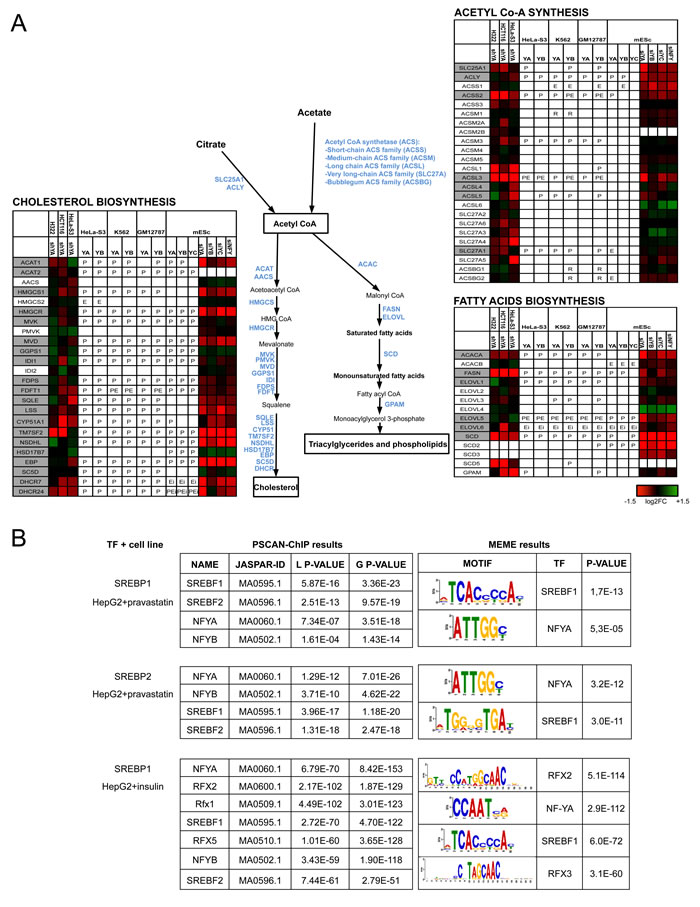
Figure 2: NF-Y activates genes of lipid metabolism. A. Genes involved in cholesterol and fatty acids metabolisms are shown. The heatmap represents the log2 fold change of relative expression derived from profiling analysis (See colour scale) in the indicated cell lines after inactivation of NF-Y subunits: H322 (This manuscript, Fig S2), HCT116 (This manuscript, Fig. S2), HeLaS3 [11] and mESC [12]. The presence of NF-Y binding in ENCODE datasets is indicated with P (core promoter binding), E (external enhancer), Ei (enhancer in gene body) or R (repetitive sequence within 5 kb from the TSS). In vivo binding of SREB-1/2 according to ChIP-Seq experiments is indicated by a grey background. B. Analyses of over-represented motifs in SREBPs peaks in HepG2 ChIP-Seq data analyzed by ENCODE. The matrices were derived with Pscan-ChIP (Left panel) and MEME (Right panel), and the relative p-values are shown.
Respiratory genes, glycolysis and the TCA cycle
The NF-Y homologue HAP2/3/5 is the master transcriptional activator of all genes of the respiratory chain in yeast, following the shift from fermentable (glucose) to non-fermentable (lactate) carbon sources [3]. The promoters of two human respiratory chain genes -ATP Synthase β/ATP5B and CYC1- were originally shown to rely on CCAAT boxes [51-54], and it could be inferred that NF-Y globally controls mammalian respiratory genes as well. The mitochondrial electron transport chain is composed of five complexes (I-V), each containing multiple subunits encoded by nuclear and mitochondrial genes. Surprisingly, we notice differential densities, both in genomic binding and transcriptional activation, in the areas of oxygen-fueled (low) and carbohydrate (high) metabolisms (Fig. 1); this is matched by KOBAS analysis, with terms such as aerobic respiration and oxidative phosphorylation being up-regulated upon NF-YA inactivation, hence normally repressed (Table 1). Further analysis of the genes of the 5 respiratory complexes indicates the following: CYC1 (complex III) is -modestly- down-regulated in NF-Y-inactivated cells, but not bound by NF-Y; ATP5B (complex V) is bound and regulated; in general, however, only a handful genes -NDUFA2, NDUFS8, ATP5E, ATP5G1 and SDHB- are directly activated in cancer cells, eight genes in mES cells (Fig. 3A). A larger set of genes is repressed by NF-Y, either through direct binding, or indirectly. We verified the expression analysis by inactivation of NF-YB through shRNA interference of Hela cells: of seven representative genes analyzed by qRT-PCR, either bound or not by NF-Y in vivo, four showed negligible changes, ATP6AP was modestly increased and CYC1 was modestly decreased, in accordance with the profilings data (Fig. 3B). Experiments using a second shRNA directed against NF-YB yielded similar results (Fig. S11). In summary, NF-Y activation of respiratory genes is globally an exception, and expression of most genes are either not controlled, or repressed.
Table 1: Metabolic terms enriched in genes whose expression is changed upon inactivation of NF-YA in Hela-S3 cells (left panel) and in mouse ES cells (mESC) (right panel).
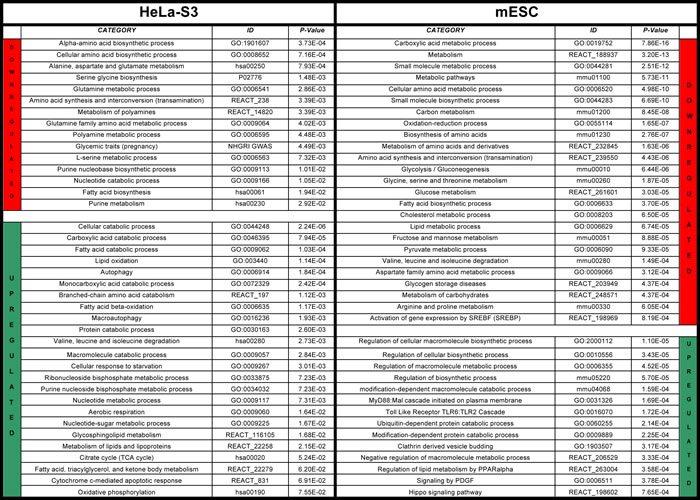
Pathways and Gene Ontology analyses were performed with Kobas 2.0 and metabolic terms extracted from the list. The full list of terms enriched in differentially expressed genes is shown in Fig. S9.
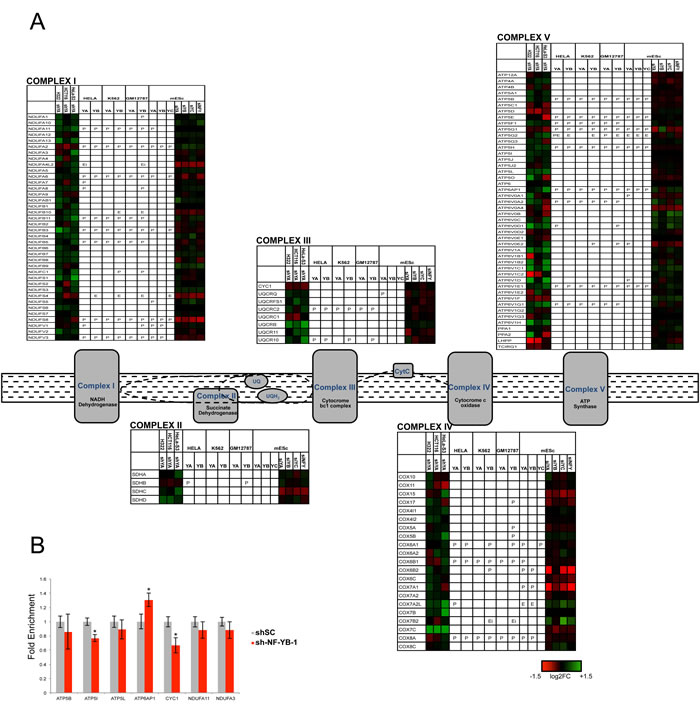
Figure 3: NF-Y and expression of respiratory genes. A. Genes of oxidative phosphorylation chain complexes are shown with the relative expression levels after inactivation of NF-Y in different cell lines, and the relative presence of NF-Y binding in P (promoter), E (external enhancer), Ei (enhancer in gene body) or R (repetitive sequence within 5 kb from TSS). B. qRT-PCR evaluation of expression levels of respiratory genes after inactivation of NF-YB in Hela cells. The average -/+ SD of three biological replicates is represented. (*p<0.05).
On the other hand, glycolytic genes are densely populated of NF-Y-activated units (Figs. 1 and 4A). The sensitivity of such genes to NF-Y inactivation is very high in mES cells; PFKFB2 and SLC16A7 are the only genes showing up-regulation. Critical genes such as PFKFB, PGK, GAPDH, PKM, LDH are bound and heavily rely on NF-Y activity. Note that Aldolase B, one of the first NF-Y promoters dissected [55, 56], is negative, possibly because it is mostly expressed in liver cells, not assayed here. Regulation is similar in cancer cells, with differences in SLC2A3, SLC16A7, PFKFB2/3 (in HCT116 and H322), PKM and HKII. Note that HKII and PKM promoters were shown to be NF-Y-dependent [57-59]. We verified the expression of some of these genes in NF-YB-inactivated Hela-S3 cells by qRT-PCR: most are decreased, with the exception of HKI, HKII and PKM (Fig. 4B and Fig. S11 ). We also checked the protein levels of several glycolytic enzymes, and found HKI, HKII, GAPDH and LDHA to be decreased, whereas PFKP was unchanged (Fig. 4C). These data are in agreement with the mRNA analysis, with two exceptions: HKII, whose protein is decreased and mRNA is increased after NF-YA inactivation, and PKM, showing no change at the protein level. The differential effects could be due to the long half-life of the proteins, which would require assessment at longer times after NF-Y removal, or to the previously reported differences in sets of genes regulated by NF-YA and NF-YB inactivation [13].
Downstream of pyruvate, Acetyl-CoA enters the TCA cycle, which is functionally linked to mitochondrial oxidative phosphorylation: at the level of binding, the density of NF-Y sites in promoters is high, but the regulation is apparently complex and, intriguingly, somewhat dissimilar in cancer and mES cells (Fig. S12A). The Pyruvate Dehydrogenase -PDH- complex, leading to Acetyl-CoA production by oxidation of pyruvate, illustrates such complexity: PDHA1 is affected, but not the DLD and DLAT subunits, which are, if anything, repressed by NF-Y; at the same time, the regulatory PD Kinase -PDK1/4- which inhibits the activity of the PDH complex, is robustly activated by NF-Y, as shown before [60]. Parallel pathways feed into oxalacetate from: (i) Phosphoenol-pyruvate via PCK (PEPCK), positively controlled by NF-Y, notably PCK2; (ii) Pyruvate Carboxylase (PC), which is bound -promoter and enhancer- and negatively regulated (Fig. S12A). The control of PC by NF-Y is also complex [61], including positive effects upon removal of single repressive CCAAT boxes [62]. Note the PC route is crucial for anaplerosis, that is, replenishment of the pools of the TCA cycle intermediates [63]. Production of citrate from Acetyl-CoA and oxaloacetate, and further to isocitrate, is mediated by Citrate synthase and Aconitase, whose promoters are bound in vivo, but modestly affected. Thereafter, enzymes are not uniformly regulated: Succinate Dehydrogenases (SDH) and Malate Dehydrogenase (MDH) are repressed by NF-Y in cancer cells (Fig. S12A). For IDH1/2, OGDH and FH, there is less significant regulation in the different cancer cell types analyzed, and a positive, indirect, effect on IDH2 in mES cells. We assayed some of the TCA genes by qRT-PCR after NF-YB inactivation in Hela cells: consistent with the profilings, PDHB, PDK1, ACLY but not PDHA1, are decreased, whereas OGDH, IDH2 and DLD are unchanged (Fig. S12B). In the second set of experiments using shNF-YB-2, the data are similar, except that OGDH is decreased, and PDHB is not, as in the profilings, (Fig. S11). The protein levels of PDHA were evaluated in Western Blots and found to be unchanged (Fig. S12C). Note that NF-Y appears to promote expression of enzymes converting α-ketoglutarate and malate out of the TCA cycle (See below). In summary, NF-Y does bind to most promoters of TCA cycle genes, but its role is less relevant, and possibly cell-type specific; in general, it does not uniformly favor the progression of Acetyl-CoA derived from glucose, lipids and aminoacids catabolism through the oxidative production of energy, particularly in cancer cells. Again, this is in striking contrast to the results obtained in yeast, where the CIT1, IDH, FH and MH genes are robustly activated by the HAP2/3/4/5 complex during activation of the respiratory response [64].
A major and unexpected finding of our analysis is that the control of energy metabolism by NF-Y changed during evolution, from promoting mitochondrial energy production, in fungi, to activating genes of anaerobic pathways, in mammals. The preference for anaerobic energy production by glycolysis in the presence of oxygen is a hallmark of cancer cells, a phenomenon known as the Warburg effect [65]. This requires a high activity of glycolytic enzymes; accordingly, the overall levels of many of them are elevated in many types of tumors, with respect to normal cells, mainly because of increased mRNA expression [66].
In general, NF-Y appears to have a coherent strategy of promoting glucose, but not oxygen utilization. Among glycolytic enzymes, GAPDH produces Glyceraldeyde-3P, which enters the biosynthetic pathway of Serine biosynthesis (See below). PKM promotes the final, rate-limiting step of glycolysis to generate pyruvate and ATP and is important in cancer cells [67]. Lactate Dehydrogenases are key to drive regeneration of NAD+ and continuous ATP production from glycolysis. Lactate Dehydrogenase is produced by two genes -LDHA and LDHB- whose relative expression varies depending upon the cellular status: in cancer cells, it is shifted toward LDHA, generating the LDH5 enzyme, most efficient in driving the Pyruvate-to-Lactate conversion required to keep the glycolytic flux flowing [68]. It is thus noteworthy that NF-Y is more important for LDHA expression in cancer cells, and for LDHB in mESCs. At the end of glycolysis, NF-Y does not appear to promote a flux of Acetyl-CoA entering the TCA cycle: this is exemplified by the modest impact on PDH, on the associated subunits, and activation of its repressor PDK. At the same time, NF-Y promotes exit of α-ketoglutarate and malate from the TCA cycle to enter alternate pathways, in cancer cells at least (See below).
Long time considered as housekeeping genes subject to modest levels of regulation, the promoters of these genes recently regained interest, but information about the DNA elements and TFs acting on many of them remains scarcely abundant. HIF-1α, MYC, STAT3 and p53 are TFs associated with the regulation of glycolytic enzymes [69-74]. The formers are generally activators, while p53 is inhibitory, at least in the wt configuration. HIF-1α is activated by anaerobic stress and constitutively active in many cancer cells, targeting essentially all glycolytic genes; MYC was shown to interact with NF-Y directly [75] and the peaks of MYC and NF-Y overlap significantly in ENCODE data [11]. Interestingly, p53 was shown to promote gluconeogenesis [76], while oncogenic Gain-of-Function mutations of p53, reported to impact on expression of NF-Y genes [77, 78], mediate metabolic reprogramming and increased glycolysis [79]: it will be interesting to evaluate the effects of mutp53 on the metabolic genes targeted by NF-Y identified here.
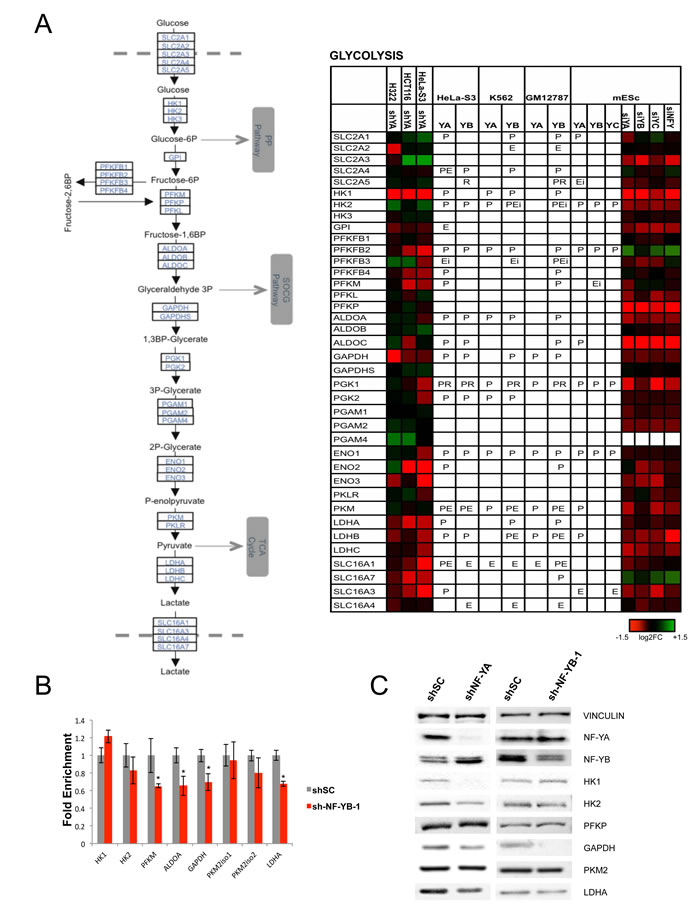
Figure 4: Glycolytic enzymes are regulated by NF-Y. A. Genes encoding for glycolytic enzymes are shown with their expression levels after inactivation of NF-Y in different cell lines, and the presence of NF-Y binding is indicated as in Fig. 3. B. qRT-PCR evaluation of expression levels of selected genes after inactivation of NF-YB in Hela cells. The average -/+ SD of three biological replicates is represented. (*p<0.05). C. Western blot analysis of protein levels of NF-Y targets in Hela cells inactivated of NF-YA (Left panel), or NF-YB (Right panel).
The SOCG and Glutamine pathways
We noticed high densities of NF-Y targets in specific pathways of Serine/Glycine, Glutamine and Methionine, all enriched in KOBAS analysis (Table 1). The SOCG pathway is central for de novo production of Serine and Glycine, and for additional metabolisms -folates, nucleotides- crucially required for growing cells [80]. NF-Y binding is present on all promoters of the pathway in at least one cell type with the exception of the SLC19A1 transporter, MTHFD2L and AMT (Fig. 5A). Serine synthesis stems from a branch of glycolysis, through Glyceraldeyde 3P being sequentially metabolized by three enzymes: PHGDH, PSAT and PSHP; the promoters are all bound, and the mRNAs decreased upon NF-YA removal. For the PHGDH promoter, genetic evidence of the importance of the CCAAT box was reported [81]. Conversion to Glycine is then obtained through the activity of SHMT, present in two isoforms, one located in the cytoplasm -SHMT1- the other -SHMT2- in mitochondria: NF-YA regulates the former, but apparently not the latter. qRT-PCR analysis of Hela-S3 cells inactivated with the two shRNAs against NF-YB confirmed the control of PHGDH, PSAT1, PSPH, whereas SHMT1 was, if anything, positively affected (Fig. 5B and Fig. S11). Interestingly, NF-Y also impacts on the mitochondrial branch, by activation of two key enzymes, MTHFDL1 and MTHFD2. Control of MTHFR and DHFR signals a further role on folates metabolism, which is linked to Methionine synthesis and nucleotides production (See below). In summary, the data indicate that NF-Y plays a crucial role in the activation of SOCG genes.
Glutamine is another pathway dense with NF-Y targets, at the level of promoter recognition and function (Fig. 5A). Binding of NF-Y is absent only in SLC3A2, CAD, SLC38A5 and SLC38A3; the latter gene, GLUD1 and GPT are unchanged in expression after NF-YA-inactivation in cancer cells. Most genes are activated by NF-Y through direct promoter binding [82]. Specifically, GLS and GLS2 are differentially regulated in Hela-S3 and mES cells: the former is bound and activated in Hela-S3 (but repressed in H322), but not regulated in mES cells. The reciprocal is true for GLS2. These enzymes are crucial for the conversion of Glutamine to Glutamate, which can then be transformed to α-ketoglutarate by GLUD1, not regulated by NF-Y in cancer cells and modestly repressed in mES cells. This branch is a second leg of anaplerotic mechanisms filling the TCA cycle with metabolites from the Glutamine pathway: the positivity of GOT1/2, but not GLUD1, is yet another indication that NF-Y is not favoring anaplerosis per se. GOT1/2, in fact, convert Aspartate from Glutamine into oxaloacetate, then converted into malate [83]: thereafter, the Malic enzymes ME1 ME2, both regulated by NF-Y (Fig. 5A), mediate pyruvate production and exit from TCA. In summary, NF-Y appears to promote a shift of Glutamine catabolism from the TCA cycle into alternative biosynthetic pathways, matching the modest role exerted on PDH (Fig. S12A). The negative regulation of SDH (Fig. 3A and S12A) and the activation of genes deviating metabolites from the TCA cycle are a further indication that NF-Y is not promoting oxygen-mediated production of energy.
The Glutamine and SOCG pathways are altered in cancer cells. As to the former, tumors usually become addicted to high levels of Glutamine. The key GLS2 is activated by p53 [84, 85], and regulation is shared by p63 and p73, with a different outcome depending from the isoforms [86, 87]. Genes of the SOCG pathways are overexpressed in cancer [88], the global alteration directly impinges on an altered flux of metabolites [17]. PHGDH and SHMT2 are predictive of survival outcomes in breast cancer, PSPH of hepatocellular carcinomas [89, 90]. SHMT2 is a cancer driver gene [91, 92]; PHGDH overexpression, resulting from genomic amplification, is essential for growth of certain human breast cancers [93] and melanomas [94]; PSAT1 is overexpressed in colon cancer [95]. In general, there are very few data on the mechanisms of transcriptional regulation of SOCG pathway genes: p53 is a repressor of PHGDH [96], whereas cMYC overexpression leads to increased biosynthesis of serine [90]. The identification of NF-Y/CCAAT as a pivotal element should facilitate the identification of neighboring elements and TFs involved in regulation of these units.
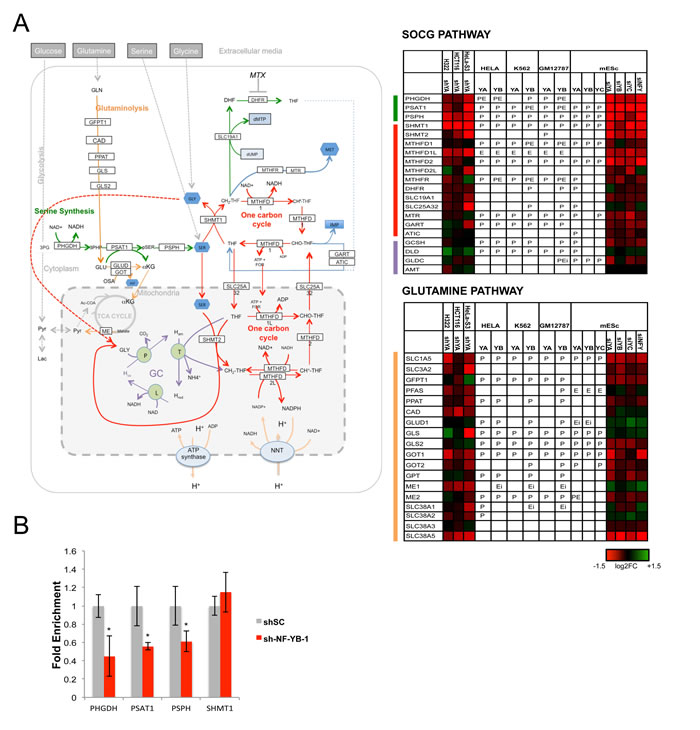
Figure 5: Activation of SOCG genes by NF-Y. A. Genes of the SOCG (Serine, One Carbon, Glycine) pathway are shown with the expression levels after inactivation of NF-Y, and the presence of NF-Y binding as in Fig. 3. B. qRT-PCR evaluation of expression levels of PHGDH, PSAT1, PSPH, SHMT1 after inactivation of NF-YB in Hela cells. The average -/+ SD of three biological replicates is represented (*p<0.05).
Polyamine and purine metabolism
The biosynthetic pathways of purines and polyamines have high density of NF-Y-controlled genes (Fig. 1 and Table 1). In the polyamine pathway, which is extremely important for cancer cells (97), there are two rate-limiting steps, mediated by ODC1, from the Urea cycle, and AMD1, from the Methionine salvage pathway. AMD1 is directly controlled by NF-Y in cancer and mES cells, but NF-Y inactivation also leads to an indirect decrease of ODC1 (Fig. 6A). Additional regulated genes are ADI1, AGMAT, GOT1, SMOX, SMS and SRM. ADI1, AMD1, GOT1 and SRM were tested in Hela-S3 cellsinactivated of NF-YB: GOT 1 was unaffected, ADI1 was substantially decreased, AMD1 and SRM decreased with one of the shRNAs used (Fig. 6B and Figure S11).
AMD1 and ODC1 are deregulated in a number of cancers, notably prostate adenocarcinomas and MYCN-amplified neuroblastomas: in the latter system, ODC1 is required for tumor formation and overexpression predicts patient survival [98]. ODC1 pharmacological inhibition leads to normalization of several pathways -NMYC levels, LIN28/Let-7 expression and glycolysis- altered in neuroblastomas, and it is currently tested in clinical trials [99]. Interestingly, ODC1 and AMD1 are independently involved in mESC self-renewal, in assays of LIF-deprived cells, and can increase reprogramming of differentiated fibroblasts by OCT4, SOX2 and KLF4 [100]. NF-Y is also involved in mESC self-renewal [12, 101, 102]: a positive role on expression of the three TFs was reported, as an important part of the cohort of NF-Y targets involved in stem cells maintenance.
Many genes of the purine pathway are under NF-Y control (Fig. S13); two targets are bona fide tumor suppressors: MTAP, frequently deleted in many types of cancers along with the neighboring CDKN2A [103], and Adenylate Kinase 2 AK2 [104]. MTAP shows differential AK2 shows regulation by NF-Y, repressed in cancer cells and in mES cells. As for the synthesis of dNTPs required for the DNA biosynthetic pathways (DNA replication and repair), the key step is the reduction from ribonucleotides to desossiribonucleotides, performed by the rate-limiting enzyme Ribonucleotide Reductase (RnR), an heterotetramer composed of two large (RRM1) and two small (RRM2) subunits. While RRM1 is abundant and constant throughout the cell-cycle, the limiting RRM2 is transcribed only in S-phase [105]. RRM1 is regulated by NF-Y in Hela-S3 cells, but the dependence is higher for RRM2 (Fig. S13), whose promoter contains three functionally crucial CCAAT boxes [106], conserved and important also in Zebrafish [107]. Recently, RRM2 has attracted considerable therapeutic interest, because its targeting leads cancer cells to senesce [108, 109]. It is important to note that cells inactivated of NF-YA are crippled in S-phase progression, develop signs of DNA-damage, with subsequent triggering of an apoptotic response [12, 13]: it is possible that a decrease in the dNTPs pools, due to a decrease in the conversion from NTPs as a consequence of the RRM2 drop, might be at least partially responsible for this behavior.
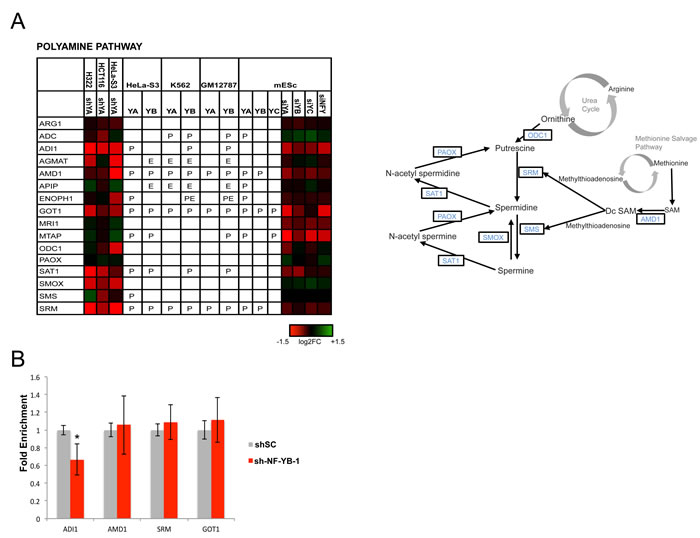
Figure 6: Activation of genes of the polyamine metabolism by NF-Y. Genes of the polyamine pathway are shown with the expression levels after inactivation of NF-Y, and the presence of in vivo NF-Y binding as in Figs. 3-5.
Conclusions and perspectives
The detailed analysis of metabolic genes under the control of NF-Y described here and summarized in Fig. 7 opens several future avenues of investigations: (i) A thorough phylogenetic analysis of the conservation of CCAAT boxes in metabolic genes targeted by NF-Y should be performed; specifically, genes involved in energy production should be examined, to identify when the switch from aerobic -in yeast- to anaerobic -in mammals- energy production has occurred during evolution: (ii) Further studies should be undertaken on the many NF-Y metabolic targets whose role in cancer development is unknown. Systematic investigation of their expression levels in large cohorts of gene expression data of cancer cells could point at additional regulatory nodes to be further examined experimentally by genetic and biochemical means: (iii) A few TFs known to impact on transcription of metabolic genes emerged, and some have been associated to NF-Y activity; in this regard, the SREBP analysis performed here is illustrative of what can be done, given the availability of large datasets of TFs genomic sites; the identification of major NF-Y partners in the regulation of metabolic genes will shed light on the arrangement of promoter sites and reciprocal interplay. Such catalogue will help our understanding of regulatory circuits of cancer cells.
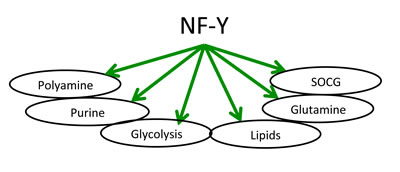
Figure 7: Schematic representation of metabolic pathways regulated by NF-Y.
MATERIALS AND METHODS
Lentiviral knockdown and gene expression arrays
Scrambled control (shSC), NF-YA (shNF-YA) and two NF-YB (shNF-YB-1 -gctatgtctactttaggcttt-; shNF-YB-2 -ccaaagaatgtgttcaagaatc-) shRNAs were cloned into pLKO.1 vector (Sigma Aldrich), and viral production and transduction were carried out as previously described [13]. H322 and HCT116 cells were transduced with shSC or shNF-YA viral supernatants, in triplicate, and cells collected after 72 hrs of incubation. Hela-S3 cells were infected with shSC or shNF-YB or shNF-YA and collected at 72 hrs after infection. In the experiments shown in Figure S11, transient DNA transfections with shSC and shNF-YB-2 were performed in triplicate with Lipofectamine 2000 (Invitrogen 11668027). Cells were collected after 72 hours. Knockdown efficiency was assayed by PCR on cDNAs and by Western Blots on whole cell protein extracts using anti-NF-YA, anti NF-YB and anti-Actin antibodies. Total RNA was prepared by Trizol extraction and retrotrascribed with Iscript cDNA Synthesis kit (BIORAD 170-8890). For arrays, RNA was prepared according to Affymetrix standard protocol and hybridized to Hu-Gene 2.0 expression arrays.
Gene expression analyses
For HeLa-S3 cells, raw data were retrieved from GSE40215 [11]; for mouse embryonic stem cells, raw data were retrieved from GSE56840 [12]. For gene expression analysis of HCT116 and H322 using the Affymetrix platform, biological triplicates of control and shNF-YA-treated cells were independently processed: normalization (rma), quality controlled, probe set filtered, identification of differentially expressed probe sets and annotation of those probe sets to gene symbols were performed using Bioconductor packages (Affy and Limma). We defined upregulated and downregulated genes when the fold change is above 1.3 and FDR <0.05. Gene Ontologies and pathways analyses were performed using the KOBAS 2.0 tool with default settings [20]. Raw data have been deposited in GEO Repository under the accession number GSE70543.
Immunoblots
For Western Blot analysis, NF-Y-inactivated and control cells were lysed in lysis buffer (50mM Tris–HCl pH 8.0, 120mM NaCl, 1% Triton X100, 20%SDS, 1mM EDTA, protease and phosphatase inhibitors). Equivalent amount of extracts were run on SDS-PAGE, transferred to nitrocellulose membrane (Whatman) and immunoblotted with the following antibodies: anti-Actin (sc-1616, Santa Cruz) anti-NF-YA (Mab1a), anti-NF-YB (Pab001, GeneSpin), anti-Glycolytic enzymes (Glycolysis 2 kit, Cell Signaling 8337S), anti-Vinculin (SAB4200080, Sigma Aldrich).
qRT-PCR
The Primer3 0.4.0. program was used for primers design using default parameters. See Fig. S14 for primer sequences. qPCR was performed with a Biorad myIQ instrument: values are normalized over an internal control ribosomal gene used as normalizator -RPS20- and are represented as fold-enrichment over control sample shSC. Data are presented as mean ± standard error of fold change of 3 biological replicates run in qPCR triplicates. Statistical significance are assessed with one sample t-test and indicated with asterisk when p<0.05.
ACKNOWLEDGMENTS
We thank V. Santoro, K. Kiakos, F. Vena, G. Liccardi and R. Vuononvirta at UCL Cancer Institute.
FUNDING
PB was a recipient of an EMBO Short Term fellowship and a recipient of a Fondazione Italiana Ricerca Cancro (FIRC) fellowship. The work is supported by AIRC grants 14130 to RM and 14210 to CI, and by the Cancer Research UK Programme Grant (C2259/A16569) to DH.
CONFLICTs OF INTEREST
The authors declare that there are no conflicts of interest.
REFERENCES
1. Nardini M, Gnesutta N, Donati G, Gatta R, Forni C, Fossati A, Vonrhein C, Moras D, Romier C, Bolognesi M, Mantovani R. Sequence-specific transcription factor NF-Y displays histone-like DNA binding and H2B-like ubiquitination. Cell 2013; 152:132-143.
2. Dolfini D, Mantovani R. Targeting the Y/CCAAT box in cancer: YB-1 (YBX1) or NF-Y? Cell Death Differ 2013; 20:676-85.
3. Buschlen S, Amillet JM, Guiard B, Fournier A, Marcireau C, Bolotin-Fukuhara M. The S. Cerevisiae HAP complex, a key regulator of mitochondrial function, coordinates nuclear and mitochondrial gene expression. Comp Funct Genomics 2003; 4:37-46.
4. Dolfini D, Zambelli F, Pavesi G, Mantovani R. A perspective of promoter architecture from the CCAAT box. Cell Cycle 2009; 8: 4127-37.
5. Testa A, Donati G, Yan P, Romani F, Huang TH, Viganò MA, Mantovani R. Chromatin immunoprecipitation (ChIP) on chip experiments uncover a widespread distribution of NF-Y binding CCAAT sites outside of core promoters. J Biol Chem 2005; 280:13606-15.
6. Ceribelli M, Dolfini D, Merico D, Gatta R, Viganò AM, Pavesi G, Mantovani R. The histone-like NF-Y is a bifunctional transcription factor. Mol Cell Biol 2008; 28:2047-58.
7. Reed BD, Charos AE, Szekely AM, Weissman SM, Snyder M. (2008). Genome-wide occupancy of SREBP1 and its partners NFY and SP1 reveals novel functional roles and combinatorial regulation of distinct classes of genes. PLoS Genet. 4:e1000133.
8. Tiwari VK, Stadler MB, Wirbelauer C, Paro R, Schubeler D, Beisel C. A chromatin-modifying function of JNK during stem cell differentiation. Nat Genet 2011; 44:94-100.
9. Wang J, Zhuang J, Iyer S, Lin X, Whitfield TW, Greven MC, Pierce BG, Dong X, Kundaje A, Cheng Y, Rando OJ, Birney E, Myers RM, et al. Sequence features and chromatin structure around the genomic regions bound by 119 human transcription factors. Genome Res 2012; 22:1798-812.
10. Wang J, Zhuang J, Iyer S, Lin XY, Greven MC, Kim BH, Moore J, Pierce BG, Dong X, Virgil D, Birney E, Hung JH, Weng Z. Factorbook.org: a Wiki-based database for transcription factor-binding data generated by the ENCODE consortium. Nucleic Acids Res 2013; 41:D171-6.
11. Fleming JD, Pavesi G, Benatti P, Imbriano C, Mantovani R, Struhl K. NF-Y co-associates with FOS at promoters, enhancers, repetitive elements, and inactive chromatin regions, and is stereo-positioned with growth-controlling transcription factors. Genome Res 2013; 23:1195-209.
12. Oldfield AJ, Yang P, Conway AE, Cinghu S, Freudenberg JM, Yellaboina S, Jothi R. Histone-fold domain protein NF-Y promotes chromatin accessibility for cell type-specific master transcription factors. Mol Cell 2014; 55:708-22.
13. Benatti P, Dolfini D, Viganò A, Ravo M, Weisz A, Imbriano C. Specific inhibition of NF-Y subunits triggers different cell proliferation defects. Nucleic Acids Res 2011; 39:5356-5368.
14. DeBerardinis RJ, Lum JJ, Hatzivassiliou G, Thompson CB. The biology of cancer: metabolic reprogramming fuels cell growth and proliferation. Cell Metab 2008; 7:11–20.
15. Kroemer G, Pouyssegur J. Tumor cell metabolism: cancer’s Achilles’ heel. Cancer Cell 2008; 13:472–482.
16. Hanahan D, Weinberg RA. Hallmarks of cancer: the next generation. Cell 2011; 144: 646–674.
17. Mehrmohamadi M, Liu X, Shestov AA, Locasale JW. Characterization of the usage of the serine metabolic network in human cancer. Cell Rep 2014; 9:1507-19.
18. Goodarzi H, Elemento O, Tavazoie S. Revealing global regulatory perturbations across human cancers. Mol Cell 2009; 36:900-11.
19. Tong Y, Merino D, Nimmervoll B, Gupta K, Wang YD, Finkelstein D, Dalton J, Ellison DW, Ma X, Zhang J, Malkin D, Gilbertson RJ. Cross-Species Genomics Identifies TAF12, NFYC, and RAD54L as Choroid Plexus Carcinoma Oncogenes. Cancer Cell 2015; 27:712-27.
20. Xie C, Mao X, Huang J, Ding Y, Wu J, Dong S, Kong L, Gao G, Li CY, Wei L. KOBAS 2.0: a web server for annotation and identification of enriched pathways and diseases. Nucleic Acids Res 2011; 39:W316-22.
21. Jackson SM, Ericsson J, Osborne TF, Edwards PA. NF-Y has a novel role in sterol-dependent transcription of two cholesterogenic genes. J Biol Chem 1995; 270:21445-8.
22. Jackson SM, Ericsson J, Mantovani R, Edwards PA. Synergistic activation of transcription by nuclear factor Y and sterol regulatory element binding protein. J Lipid Res 1998; 39:767-76.
23. Inoue J, Sato R, Maeda M. Multiple DNA elements for sterol regulatory element-binding protein and NF-Y are responsible for sterol-regulated transcription of the genes for human 3-hydroxy-3-methylglutaryl coenzyme A synthase and squalene synthase. J Biochem 1998; 123:1191-8.
24. Bennett MK, Osborne TF. Nutrient regulation of gene expression by the sterol regulatory element binding proteins: increased recruitment of gene-specific coregulatory factors and selective hyperacetylation of histone H3 in vivo. Proc Natl Acad Sci USA 2000; 97:6340-4.
25. Sato R, Okamoto A, Inoue J, Miyamoto W, Sakai Y, Emoto N, Shimano H, Maeda M. Transcriptional regulation of the ATP citrate-lyase gene by sterol regulatory element-binding proteins. J Biol Chem 2000; 275:12497-502.
26. Misawa K, Horiba T, Arimura N, Hirano Y, Inoue J, Emoto N, Shimano H, Shimizu M, Sato R. Sterol regulatory element-binding protein-2 interacts with hepatocyte nuclear factor-4 to enhance sterol isomerase gene expression in hepatocytes. J Biol Chem 2003; 278:36176-82.
27. Schiavoni G, Bennati AM, Castelli M, Fazia MA, Beccari T, Servillo G, Roberti R. Activation of TM7SF2 promoter by SREBP-2 depends on a new sterol regulatory element, a GC-box, and an inverted CCAAT-box. Biochim Biophys Acta 2010; 1801:587-92.
28. Kim JH, Lee JN, Paik YK. Cholesterol biosynthesis from lanosterol. A concerted role for Sp1 and NF-Y-binding sites for sterol-mediated regulation of rat 7-dehydrocholesterol reductase gene expression. J Biol Chem 2001; 276:18153-60.
29. Zerenturk EJ, Sharpe LJ, Brown AJ. Sterols regulate 3β-hydroxysterol Δ24-reductase (DHCR24) via dual sterol regulatory elements: cooperative induction of key enzymes in lipid synthesis by Sterol Regulatory Element Binding Proteins. Biochim Biophys Acta 2012; 1821:1350-60.
30. Prabhu AV, Sharpe LJ, Brown AJ. The sterol-based transcriptional control of human 7-dehydrocholesterol reductase (DHCR7): Evidence of a cooperative regulatory program in cholesterol synthesis. Biochim Biophys Acta 2014; 1842:1431-39.
31. Shi X, Metges CC, Seyfert HM. Interaction of C/EBP-beta and NF-Y factors constrains activity levels of the nutritionally controlled promoter IA expressing the acetyl-CoA carboxylase-alpha gene in cattle. BMC Mol Biol. 2012; 13:21.
32. Xiong S, Chirala SS, Wakil SJ. Sterol regulation of human fatty acid synthase promoter I requires nuclear factor-Y- and Sp-1-binding sites. Proc Natl Acad Sci USA 2000; 97:3948-53.
33. Teran-Garcia M, Rufo C, Nakamura MT, Osborne TF, Clarke SD. NF-Y involvement in the polyunsaturated fat inhibition of fatty acid synthase gene transcription. Biochem Biophys Res Commun 2002; 290:1295-99.
34. Lefevre P, Tripon E, Plumelet C, Douaire M, Diot C. Effects of polyunsaturated fatty acids and clofibrate on chicken stearoyl-coA desaturase 1 gene expression. Biochem Biophys Res Commun 2001; 280:25-31.
35. Schweizer M, Roder K, Zhang L, Wolf SS. Transcription factors acting on the promoter of the rat fatty acid synthase gene. Biochem Soc Trans 2002; 30:1070-72.
36. Mauvoisin D, Rocque G, Arfa O, Radenne A, Boissier P, Mounier C. Role of the PI3-kinase/mTor pathway in the regulation of the stearoyl CoA desaturase (SCD1) gene expression by insulin in liver. J Cell Commun Signal 2007; 1:113-25.
37. Currie E, Schulze A, Zechner R, Walther TC, Farese RV Jr. Cellular fatty acid metabolism and cancer. Cell Metab 2013; 18:153-61.
38. Clendening JW, Pandyra A, Boutros PC, El Ghamrasni S, Khosravi F, Trentin GA, Martirosyan A, Hakem A, Hakem R, Jurisica I, Penn LZ. Dysregulation of the mevalonate pathway promotes transformation. Proc Natl Acad Sci USA 2010; 107:15051-6.
39. Clendening JW, Penn LZ. Targeting tumor cell metabolism with statins. Oncogene 2012; 31:4967-78.
40. Menendez JA, Lupu R. Fatty acid synthase and the lipogenic phenotype in cancer pathogenesis. Nat Rev Cancer 2007; 7:763-77.
41. Comerford SA, Huang Z, Du X, Wang Y, Cai L, Witkiewicz AK, Walters H, Tantawy MN, Fu A, Manning HC, Horton JD, Hammer RE, McKnight SL, Tu BP. Acetate dependence of tumors. Cell 2014; 159:1591-602.
42. Mashimo T, Pichumani K, Vemireddy V, Hatanpaa KJ, Singh DK, Sirasanagandla S, Nannepaga S, Piccirillo SG, Kovacs Z, Foong C, Huang Z, Barnett S, Mickey BE, et al. Acetate is a bioenergetic substrate for human glioblastoma and brain metastases. Cell 2014; 159:1603-14.
43. Zaidi N, Swinnen JV, Smans K. ATP-citrate lyase: a key player in cancer metabolism. Cancer Res 2012; 72:3709-14.
44. Jeon TI, Osborne TF. SREBPs: metabolic integrators in physiology and metabolism. Trends Endocrinol Metab 2012; 23:65-72.
45. Amemiya-Kudo M, Shimano H, Yoshikawa T, Yahagi N, Hasty AH, Okazaki H, Tamura Y, Shionoiri F, Iizuka Y, Ohashi K, Osuga J, Harada K, Gotoda T, et al. Promoter analysis of the mouse sterol regulatory element-binding protein-1c gene. J Biol Chem 2000; 275:31078-85.
46. Deng X, Cagen LM, Wilcox HG, Park EA, Raghow R, Elam MB. Regulation of the rat SREBP-1c promoter in primary rat hepatocytes. Biochem Biophys Res Commun. 2002; 290:256-62.
47. Gilardi F, Migliavacca E, Naldi A, Baruchet M, Canella D, Le Martelot G, Guex N, Desvergne B; CycliX Consortium. Genome-wide analysis of SREBP1 activity around the clock reveals its combined dependency on nutrient and circadian signals. PLoS Genet 2014; 10:e1004155.
48. Zambelli F, Pesole G, Pavesi G. PscanChIP: Finding over-represented transcription factor-binding site motifs and their correlations in sequences from ChIP-Seq experiments. Nucleic Acids Res 2013; 41:W535-43.
49. Li Q, Herrler M, Landsberger N, Kaludov N, Ogryzko VV, Nakatani Y, Wolffe AP. Xenopus NF-Y pre-sets chromatin to potentiate p300 and acetylation-responsive transcription from the Xenopus hsp70 promoter in vivo. EMBO J 1998; 17:6300-15.
50. Sherwood RI, Hashimoto T, O’Donnell CW, Lewis S, Barkal AA, van Hoff JP, Karun V, Jaakkola T, Gifford DK. Discovery of directional and nondirectional pioneer transcription factors by modeling DNase profile magnitude and shape. Nat Biotechnol 2014; 32:171-78.
51. Ohta S, Tomura H, Matsuda K, Kagawa Y. Gene structure of the human mitochondrial adenosine triphosphate synthase beta subunit. J Biol Chem 1988; 263:11257-62.
52. Neckelmann N, Warner CK, Chung A, Kudoh J, Minoshima S, Fukuyama R, Maekawa M, Shimizu Y, Shimizu N, Liu JD, et al. The human ATP synthase beta subunit gene: sequence analysis, chromosome assignment, and differential expression. Genomics 1989; 5:829-43.
53. Suzuki H, Hosokawa Y, Toda H, Nishikimi M, Ozawa T. Common protein-binding sites in the 5’-flanking regions of human genes for cytochrome c1 and ubiquinone-binding protein. J Biol Chem 1990; 265:8159-63.
54. Dyer MR, Walker JE. Sequences of members of the human gene family for the c subunit of mitochondrial ATP synthase. Biochem J 1993; 293:51-64.
55. Tsutsumi K, Ito K, Ishikawa K. Developmental appearance of transcription factors that regulate liver-specific expression of the aldolase B gene. Mol Cell Biol 1989; 9:4923-31.
56. Raymondjean M, Pichard AL, Gregori C, Ginot F, Kahn A. Interplay of an original combination of factors: C/EBP, NFY, HNF3, and HNF1 in the rat aldolase B gene promoter. Nucleic Acids Res 1991; 19:6145-53.
57. Yamada K, Tanaka T, Miyamoto K, Noguchi T. Sp family members and nuclear factor-Y cooperatively stimulate transcription from the rat pyruvate kinase M gene distal promoter region via their direct interactions. J Biol Chem 2000; 275:18129-37.
58. Osawa H, Robey RB, Printz RL, Granner DK. Identification and characterization of basal and cyclic AMP response elements in the promoter of the rat hexokinase II gene. J Biol Chem. 1996; 271:17296-303.
59. Lee MG, Pedersen PL. Glucose metabolism in cancer: importance of transcription factor-DNA interactions within a short segment of the proximal region og the type II hexokinase promoter. J Biol Chem 2003; 278:41047-58.
60. Kwon HS, Huang B, Ho Jeoung N, Wu P, Steussy CN, Harris RA. Retinoic acids and trichostatin A (TSA), a histone deacetylase inhibitor, induce human pyruvate dehydrogenase kinase 4 (PDK4) gene expression. Biochim Biophys Acta 2006; 1759:141-51.
61. Thonpho A, Rojvirat P, Jitrapakdee S, MacDonald MJ. Characterization of the distal promoter of the human pyruvate carboxylase gene in pancreatic beta cells. PLoS One 2013; 8:e55139.
62. Sunyakumthorn P, Boonsaen T, Boonsaeng V, Wallace JC, Jitrapakdee S. Involvement of specific proteins (Sp1/Sp3) and nuclear factor Y in basal transcription of the distal promoter of the rat pyruvate carboxylase gene in beta-cells. Biochem Biophys Res Commun 2005; 329:188-96.
63. Mullen AR, DeBerardinis RJ. Genetically-defined metabolic reprogramming in cancer. Trends Endocrinol Metab 2012; 23:552-59.
64. Fendt SM, Sauer U. Transcriptional regulation of respiration in yeast metabolizing differently repressive carbon substrates. BMC Syst Biol 2010; 4:12
65. Warburg O. On the origin of cancer cells. Science 1956; 123:309-14.
66. Altenberg B, Greulich KO. Genes of glycolysis are ubiquitously overexpressed in 24 cancer classes. Genomics 2004; 84:1014-20.
67. Luo W, Semenza GL. Emerging roles of PKM2 in cell metabolism and cancer progression. Trends Endocrinol Metab 2012; 23:560-66.
68. Augoff K, Hryniewicz-Jankowska A, Tabola R. Lactate dehydrogenase 5: An old friend and a new hope in the war on cancer. Cancer Lett 2014; 358:1-7.
69. Semenza GL. HIF-1 mediates metabolic responses to intratumoral hypoxia and oncogenic mutations. J Clin Invest 2013; 123:3664-71.
70. Maddocks OD, Vousden KH. Metabolic regulation by p53. J Mol Med 2011; 89:237-45.
71. Wahlström T, Arsenian Henriksson M. Impact of MYC in regulation of tumor cell metabolism. Biochim Biophys Acta 2014; 1849:563-69.
72. Soga T. Cancer metabolism: key players in metabolic reprogramming. Cancer Sci 2013; 104:275-81.
73. Chen JQ, Russo J. Dysregulation of glucose transport, glycolysis, TCA cycle and glutaminolysis by oncogenes and tumor suppressors in cancer cells. Biochim Biophys Acta 2012; 1826:370-84.
74. Demaria M, Poli V. PKM2, STAT3 and HIF-1α: The Warburg’s vicious circle. JAKSTAT 2012; 1:194-6.
75. Izumi H, Molander C, Penn LZ, Ishisaki A, Kohno K, Funa K. Mechanism for the transcriptional repression by c-Myc on PDGF beta-receptor. J Cell Sci 2001; 114:1533-44.
76. Goldstein I, Yizhak K, Madar S, Goldfinger N, Ruppin E, Rotter V. p53 promotes the expression of gluconeogenesis-related genes and enhances hepatic glucose production. Cancer Metab 2013; 1:9.
77. Di Agostino S, Strano S, Emiliozzi V, Zerbini V, Mottolese M, Sacchi A, Blandino G, Piaggio G. Gain of function of mutant p53: the mutant p53/NF-Y protein complex reveals an aberrant transcriptional mechanism of cell cycle regulation. Cancer Cell 2006; 10:191-202.
78. Weissmueller S, Manchado E, Saborowski M, Morris JP 4th, Wagenblast E, Davis CA, Moon SH, Pfister NT, Tschaharganeh DF, Kitzing T, Aust D, Markert EK, Wu J, et al. Mutant p53 drives pancreatic cancer metastasis through cell-autonomous PDGF receptor β signaling. Cell 2014; 157:382-94.
79. Zhang C, Liu J, Liang Y, Wu R, Zhao Y, Hong X, Lin M, Yu H, Liu L, Levine AJ, Hu W, Feng Z. Tumour-associated mutant p53 drives the Warburg effect. Nat Commun 2013; 4:2935.
80. Locasale JW. Serine, glycine and one-carbon units: cancer metabolism in full circle. Nat Rev Cancer 2013; 13:572-83.
81. Jun DY, Park HS, Lee JY, Baek JY, Park HK, Fukui K, Kim YH. Positive regulation of promoter activity of human 3-phosphoglycerate dehydrogenase (PHGDH) gene is mediated by transcription factors Sp1 and NF-Y. Gene 2008; 414:106-14.
82. Pérez-Gómez C, Matés JM, Gómez-Fabre PM, del Castillo-Olivares A, Alonso FJ, Márquez J. Genomic organization and transcriptional analysis of the human l-glutaminase gene. Biochem J 2003; 370:771-84.
83. Son J, Lyssiotis CA, Ying H, Wang X, Hua S, Ligorio M, Perera RM, Ferrone CR, Mullarky E, Shyh-Chang N, Kang Y, Fleming JB, Bardeesy N, et al. Glutamine supports pancreatic cancer growth through a KRAS-regulated metabolic pathway. Nature 2013; 496:101-5.
84. Suzuki S, Tanaka T, Poyurovsky MV, Nagano H, Mayama T, Ohkubo S, Lokshin M, Hosokawa H, Nakayama T, Suzuki Y, Sugano S, Sato E, Nagao T, et al. Phosphate-activated glutaminase (GLS2), a p53-inducible regulator of glutamine metabolism and reactive oxygen species. Proc Natl Acad Sci USA 2010; 107:7461-66.
85. Hu W, Zhang C, Wu R, Sun Y, Levine A, Feng Z. Glutaminase 2, a novel p53 target gene regulating energy metabolism and antioxidant function. Proc Natl Acad Sci USA 2010; 107:7455-60.
86. Giacobbe A, Bongiorno-Borbone L, Bernassola F, Terrinoni A, Markert EK, Levine AJ, Feng Z, Agostini M, Zolla L, Agrò AF, Notterman DA, Melino G, Peschiaroli A. p63 regulates glutaminase 2 expression. Cell Cycle 2013; 12:1395-405.
87. Amelio I, Markert EK, Rufini A, Antonov AV, Sayan BS, Tucci P, Agostini M, Mineo TC, Levine AJ, Melino G. p73 regulates serine biosynthesis in cancer. Oncogene 2014; 33:5039-46.
88. Amelio I, Cutruzzolá F, Antonov A, Agostini M, Melino G. Serine and glycine metabolism in cancer. Trends Biochem Sci 2014; 39:191-98.
89. Antonov A, Agostini M, Morello M, Minieri M, Melino G, Amelio I. Bioinformatics analysis of the serine and glycine pathway in cancer cells. Oncotarget 2014; 5:11004-13. doi: 10.18632/oncotarget.2668.
90. Sun L, Song L, Wan Q, Wu G, Li X, Wang Y, Wang J, Liu Z, Zhong X, He X, Shen S, Pan X, Li A, Wang Y, Gao P, Tang H, Zhang H. cMyc-mediated activation of serine biosynthesis pathway is critical for cancer progression under nutrient deprivation conditions. Cell Res 2015; 25:429-44.
91. Lee GY, Haverty PM, Li L, Kljavin NM, Bourgon R, Lee J, Stern H, Modrusan Z, Seshagiri S, Zhang Z, Davis D, Stokoe D, Settleman J, de Sauvage FJ, Neve RM. Comparative oncogenomics identifies PSMB4 and SHMT2 as potential cancer driver genes. Cancer Res 2014; 74:3114-26.
92. Kim D, Fiske BP, Birsoy K, Freinkman E, Kami K, Possemato RL, Chudnovsky Y, Pacold ME, Chen WW, Cantor JR, Shelton LM, Gui DY, Kwon M, et al. SHMT2 drives glioma cell survival in ischaemia but imposes a dependence on glycine clearance. Nature 2015; 520:363-67.
93. Possemato R, Marks KM, Shaul YD, Pacold ME, Kim D, Birsoy K, Sethumadhavan S, Woo HK, Jang HG, Jha AK, Chen WW, Barrett FG, Stransky N, et al. Functional genomics reveal that the serine synthesis pathway is essential in breast cancer. Nature 2011; 476:346-50.
94. Locasale JW, Grassian AR, Melman T, Lyssiotis CA, Mattaini KR, Bass AJ, Heffron G, Metallo CM, Muranen T, Sharfi H, Sasaki AT, Anastasiou D, Mullarky E, et al. Phosphoglycerate dehydrogenase diverts glycolytic flux and contributes to oncogenesis. Nat Genet 2011; 43:869-74.
95. Vié N, Copois V, Bascoul-Mollevi C, Denis V, Bec N, Robert B, Fraslon C, Conseiller E, Molina F, Larroque C, Martineau P, Del Rio M, Gongora C. Overexpression of phosphoserine aminotransferase PSAT1 stimulates cell growth and increases chemoresistance of colon cancer cells. Mol Cancer 2008; 7:14.
96. Ou Y, Wang SJ, Jiang L, Zheng B, Gu W. p53 Protein-mediated regulation of phosphoglycerate dehydrogenase (PHGDH) is crucial for the apoptotic response upon serine starvation. J Biol Chem 2015; 290:457-66.
97. Casero RA Jr, Marton LJ. Targeting polyamine metabolism and function in cancer and other hyperproliferative diseases. Nat Rev Drug Discov 2007; 6:373-90.
98. Hogarty MD, Norris MD, Davis K, Liu X, Evageliou NF, Hayes CS, Pawel B, Guo R, Zhao H, Sekyere E, Keating J, Thomas W, Cheng NC, et al. ODC1 is a critical determinant of MYCN oncogenesis and a therapeutic target in neuroblastoma Cancer Res 2008; 68:9735-45.
99. Lozier AM, Rich ME, Grawe AP, Peck AS, Zhao P, Chang AT, Bond JP, Sholler GS. Targeting ornithine decarboxylase reverses the LIN28/Let-7 axis and inhibits glycolytic metabolism in neuroblastoma. Oncotarget 2015; 6:196-206. doi: 10.18632/oncotarget.2768.
100. Zhao T, Goh KJ, Ng HH, Vardy LA. A role for polyamine regulators in ESC self-renewal. Cell Cycle 2012; 11:4517-23.
101. Grskovic M, Chaivorapol C, Gaspar-Maia A, Li H, Ramalho-Santos M. Systematic identification of cis-regulatory sequences active in mouse and human embryonic stem cells.PLoS Genet 2007; 3:e145.
102. Dolfini D, Minuzzo M, Pavesi G, Mantovani R. The short isoform of NF-YA belongs to the embryonic stem cell transcription factor circuitry. Stem Cells. 2012; 30:2450-9.
103. Bertino JR, Waud WR, Parker WB, Lubin M. Targeting tumors that lack methylthioadenosine phosphorylase (MTAP) activity: current strategies. Cancer Biol Ther 2011; 11:627-32.
104. Kim H, Lee HJ, Oh Y, Choi SG, Hong SH, Kim HJ, Lee SY, Choi JW, Su Hwang D, Kim KS, Kim HJ, Zhang J, Youn HJ, et al. The DUSP26 phosphatase activator adenylate kinase 2 regulates FADD phosphorylation and cell growth. Nat Commun 2014; 5:3351.
105. Filatov D, Thelander L. Role of a proximal NF-Y binding promoter element in S phase-specific expression of mouse ribonucleotide reductase R2 gene. J Biol Chem 1995; 270:25239-43.
106. Liu X, Zhou B, Xue L, Qiu W, Shih J, Zheng S, Yen Y. Nuclear factor Y regulation and promoter transactivation of human ribonucleotide reductase subunit M2 gene in a Gemcitabine resistant KB clone. Biochem Pharmacol 2004; 67:1499-511.
107. Shang H, Li Q, Feng G, Cui Z.Identification and characterization of alternative promoters, transcripts and protein isoforms of zebrafish R2 gene. PLoS One 2011; 6:e24089.
108. Aird KM, Zhang G, Li H, Tu Z, Bitler BG, Garipov A, Wu H, Wei Z, Wagner SN, Herlyn M, Zhang R. Suppression of nucleotide metabolism underlies the establishment and maintenance of oncogene-induced senescence. Cell Rep 2013; 3:1252-65.
109. Aird KM, Li H, Xin F, Konstantinopoulos PA, Zhang R. Identification of ribonucleotide reductase M2 as a potential target for pro-senescence therapy in epithelial ovarian cancer. Cell Cycle 2014; 13:199-207.