
Introduction
Renal cell carcinoma (RCC) is a prototype of a chemoresistant and radioresistant malignant tumor, and therapeutic possibilities for metastasized disease have been limited until recently. The introduction of tyrosine-kinase inhibitors and mammalian target of rapamycin (mTOR) inhibitors was a major breakthrough in treatment of RCCs, although primary resistance in a subgroup of patients and development of secondary resistance in almost all patients during the course of treatment are still serious shortcomings of this novel targeted therapeutic approaches. The therapeutic inhibition of the mTOR signaling pathway is clinically achieved by analogues of rapamycin, such as Temsirolimus (CCI-779) and Everolimus (RAD001). Temsirolimus is recommended as first line therapy in clear cell carcinoma with poor risk and non-clear cell carcinoma in any risk constellation. Everolimus is recommended for clear-cell carcinoma after VEGF-R based therapies (second and third line therapy) and as third line therapy after two different TKI [1, 2]. Second and third line treatment with mTOR inhibitors leads to partial response in 3-17% and stable disease in 40-70% of patients [3]. The median time to treatment failure for mTOR inhibitors (second line setting) is 2.5 months [4]. In this regard, further progress in the understanding of the molecular mechanisms of mTOR inhibition as well as novel diagnostic tools to identify patients that will respond to targeted therapy are urgently needed.
The mTOR protein complex functions as a serine/threonine kinase that is mainly activated by the phosphatidylinositol 3-kinase (PI3K)/AKT signaling pathway and plays a pivotal role in control of cell cycle, proliferation and cellular survival both in normal renal tubules and in renal cell carcinoma [5] [6] [7]. Downstream mediators of mTOR are the 70 kDa ribosomal protein S6 kinase (p70S6K), the translational repressor 4EBP1, HIF1A, p27, and Bcl-2 [8, 9]. By activating or inhibiting these targets, mTOR regulates protein synthesis, translation, cell cycle, and apoptosis. The serine/threonine kinase p70S6K can regulate protein synthesis and translation by activating the ribosomal protein S6 (rpS6), but has also other downstream effectors, such as eEF2K, eIF4B, and the GSK3-BAD axis which regulates cell survival [10]. However, despite this knowledge the precise contribution of these downstream targets of mTOR to the success or failure of a mTOR inhibitor-based treatment of RCCs is not well understood. Moreover, the identification of the main mediators of the anti-tumor effects of mTOR inhibitors are of great importance regarding the development of diagnostic techniques to predict the response of individual patients to targeted therapy. This would enable physicians to stratify patients for tailored therapy concepts, increase the invidual benefit from treatment, and prevent unwanted side effects in patients who are not responsive to treatment. Therefore, the aim of our study was to identify crucial mediators of mTOR inhibition in both in vitro and ex vivo models of RCCs. Further, we investigated the potential of mTOR pathway components as prognostic biomarkers in a large collection of patients with RCCs.
Results
Characterization of cellular effects of Everolimus
In order to functionally investigate the cellular effects of everolimus we examined clonogenicity, proliferation, and viability in a panel of different human RCC cells. Treatment with Everolimus resulted in a strong inhibition of clonogenicity (Figure 1A). In the most sensitive cell line, Caki2, number of colonies were reduced to 25% of control cells. Similarly, Everolimus significantly reduced proliferation in most cell lines except HK2 (which is an immortalized proximal tubule epithelial cell line) and A704 (Figure 1B). Since Everolimus was also reported to induce apoptosis in cancer cells [11, 12], we tested the viability of RCC cells after a 48 h treatment with Everolimus. However, viability was only marginally affected and substantial induction of apoptosis was not observed (Figure 1C). Thus, Everolimus inhibits clonogenicity and proliferation in RCC cells without significant induction of apoptosis.
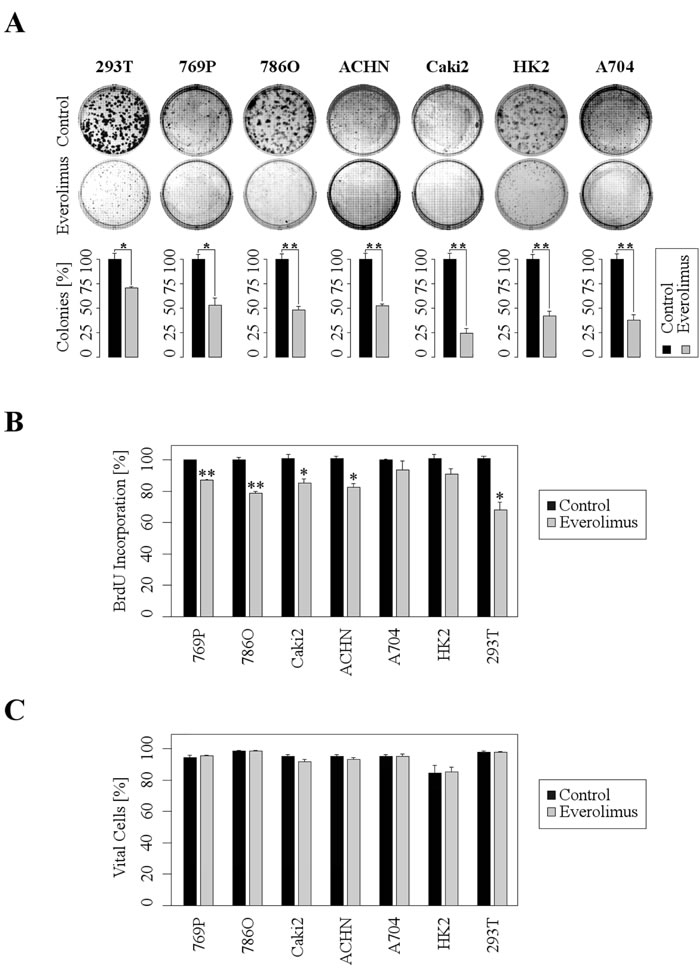
Figure 1: Everolimus leads to inhibition of clonogenicity and proliferation, whereas acute apoptosis is not induced. A. Upper images show representative wells of 6-well plates, lower bars demonstrate the decrease of colonies after 7 days (ACHN, A704: 14 days) of treatment with 1 µM Everolimus (mean ±SD; n = 3, *p < 0.05, ***p < 0.01; t-test). B. RCC cells were treated with Everolimus (1µM) for 48h and subjected to BrdU assays (mean ±SD; n = 3, *p < 0.05, **p < 0.01; t-test). C. FACS analysis shows no significant difference in cell viability after 48 h of treatment with 1µM Everolimus (mean ±SD; n = 3).
Everolimus inhibitis protein synthesis in long-term cultured RCC cells as well as in ex vivo tissue samples
Since mTOR signaling plays a central role for biosynthesis of proteins we examined to which extent Everolimus affects protein synthesis in RCC cells by a 35S-methionine protein labelling assay. Everolimus treatment induced a strong inhibition of protein synthesis in 796P and Caki2 RCC cell lines, whereas the inhibitory effect was minor in HK2 cells (Figure 2A). Next, we extended our in vitro monolayer cell culture studies by a 3D tumor model accounting for the in vivo complexity of human RCC tissue. To this end, we generated 300 µm thick slices from vital, fresh tumor tissue of RCC patients and incubated the tissue with Everolimus. In accordance with the in vitro data, Everolimus strongly inhibited protein synthesis in the tumor tissue (Figure 2B). In contrast, Everolimus-dependent inhibition of protein synthesis was only moderate in the corresponding normal tissue. Thus, Everolimus substantially blocked synthesis of proteins in RCC both in vitro and ex vivo, providing a possible explanation for the inhibitory effects on proliferation and clonogenicity.
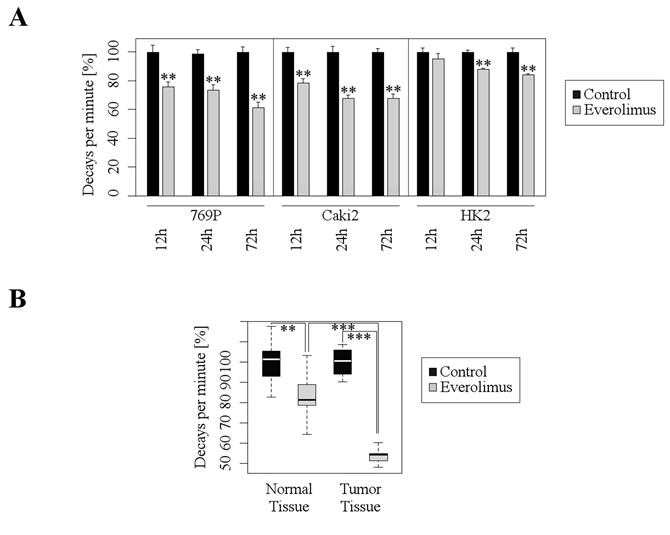
Figure 2: Everolimus inhibits protein synthesis in both cultured RCC cell lines and human tumor tissue. A. Quantitative analysis of protein synthesis by means of radioactive protein labeling with 35S-methionine after treatment with Everolimus (1 µM) shows significant decrease of protein synthesis (mean ±SD; n = 3, **p < 0.01; t-test). B. Ex vivo tissue slice experiments with 35S-methionine labeling show a significantly greater inhibition of protein synthesis after treatment with Everolimus (10 µM) in tumor tissue than in normal tissue (median and 1.+3. quartil; nTumor = 7, nControl = 5; **p < 0.01, ***p < 0.001; t-test).
Expression of mTOR pathway components in RCC cell lines and modification by Everolimus
In order to functionally investigate the mTOR pathway we characterized the expression of mTOR pathway components in several RCC cell lines by immunoblot analysis (Figure 3). mTOR and rpS6 were expressed in all cell lines tested, and treatment of cells with the mTOR inhibitor Everolimus did not substantially alter the overall expression levels. In contrast, the phosphorylation of rpS6 (p-rpS6) was completely blocked by Everolimus. As a control, cells were treated with leucine which acts as an activator of mTOR by Rheb-dependent stimulation of the mTORC1 kinase activity [13]. Total protein levels of 4ebp1, a translational repressor, were not significantly altered by Everolimus or leucine. However, phosphorylation of 4ebp1 (p-4ebp1) was increased upon leucin treatment. Everolimus treatment resulted in a non-consistent moderate up- or down-regulation of p-4ebp1. No significant regulation was observed for p27 after treatment with Everolimus or leucine. These results indicated that mTOR signaling was intact in the cell lines tested, and that rpS6 was the most significantly and consistently regulated target influenced by Everolimus.
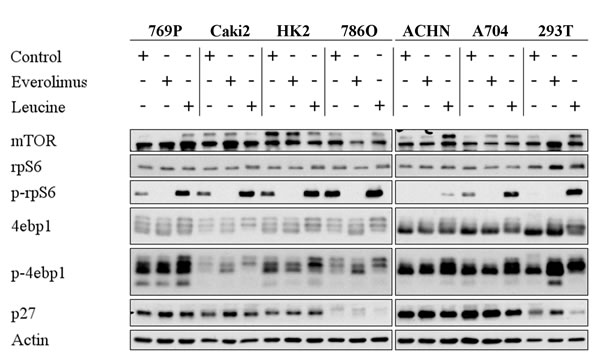
Figure 3: Everolimus leads to dephosphorylation of mTOR targets. Immunoblot analysis of whole RCC cell lysates after treatment with Everolimus (1 µM, 72h) or Leucine (10mM, 2h). 20 µg protein were loaded per lane, and Actin was used as a loading control.
rpS6 mediates the effects of Everolimus on proliferation and protein synthesis
As a next step, we investigated which of the mTOR downstream targets is most important for the mediation of the inhibitory Everolimus effects. Therefore, we downregulated rpS6, p27, and 4ebp1 by an siRNA approach and subsequently treated the RCC cells with Everolimus. Importantly, the down-regulation of rpS6 completely abolished a further Everolimus-dependent inhibition of proliferation, whereas p27- and 4ebp1-downregulated cells were still susceptible to the inhibitory effects of Everolimus (Figure 4A). Accordingly, siRNA-mediated suppression of rpS6 blocked a further inhibitory effect of Everolimus on protein synthesis (Figure 4B). These results indicate that rpS6 plays a central role in mediating the inhibitory effects of Everolimus on mTOR signaling in RCC cells.
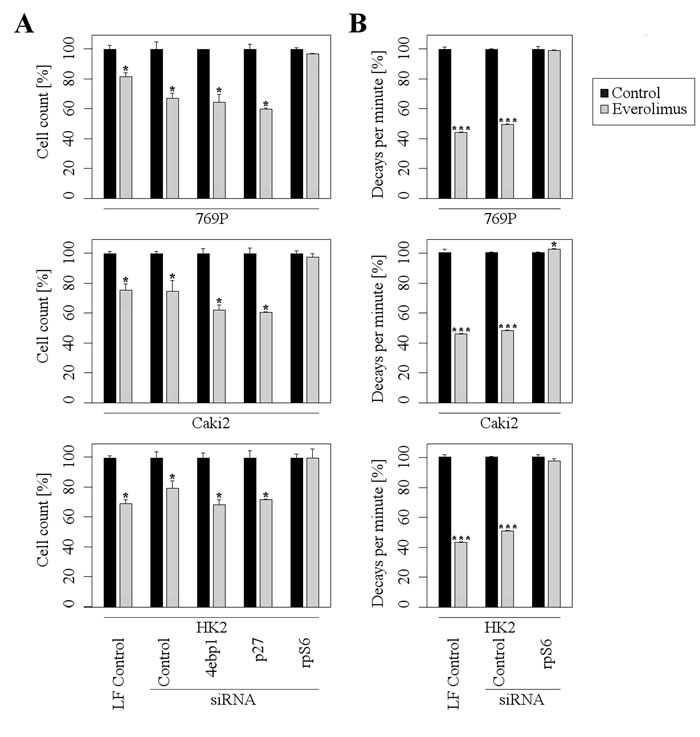
Figure 4: rpS6 mediates the inhibitory effects of Everolimus. A further inhibition of Everolimus (1µM) on proliferation A. and protein synthesis B. is abolished in rpS6 depleted cells, but not in 4ebp1 or p27 depleted cells. Note that values are normalized to 100% to allow a direct comparison between different siRNAs. LF = Lipofectamine (mean ±SD; n = 3, *p < 0.05, **p < 0.01; t-test). Protein synthesis was measured after 35S-methionine labeling.
rpS6 and p-rpS6 are independent prognostic markers in patients with RCCs
Given the paramount role of mTOR signaling in RCCs and the central functional role of rpS6, we wondered whether the expression of rpS6 and its phosphorylated form in RCCs is associated with clinical or pathological features of the tumors. To this end, we took advantage of a tissue micro array containing tumor tissue and corresponding normal renal tissue samples from 838 patients with RCCs [14, 15]. Expression of rpS6 and p-rpS6 was analyzed by immunohistochemistry. As depicted in Figure 5, rpS6 and p-rpS6 was immunohistochemically detected in the cytoplasm in variable intensity. Altogether, 580and 598 cases were successfully scored for expression of rpS6 and p-rpS6, respectively. The remaining cases with insufficient tumor tissue, fixation artefacts or tumor independent death were excluded from further analyses.
Table 1 provides a summary of the clinical and pathological features. The median follow-up time was 49 months (mean follow-up: 59 months). At the last follow-up, of 776 patients, 208 (27%) had died of RCC and 440 (57%) were still alive.
Table 1: Summary of clinical and pathologic features
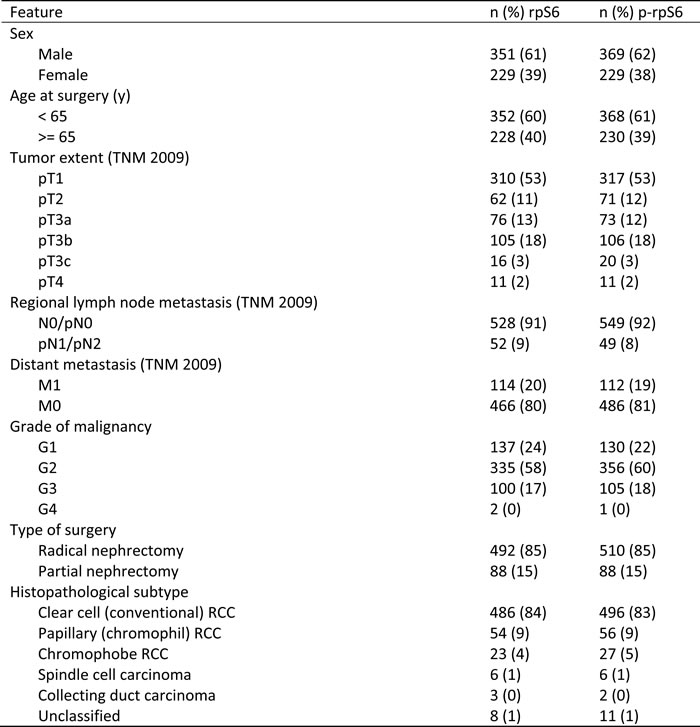
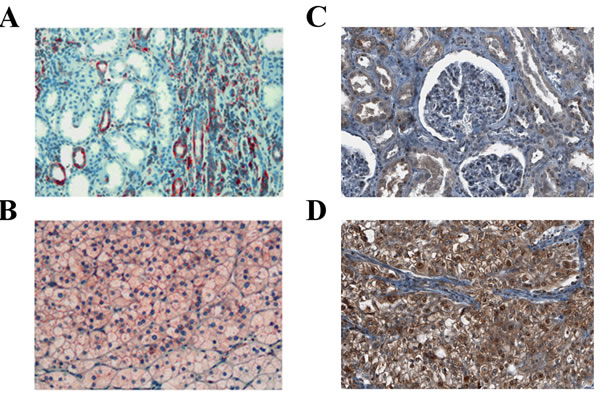
Figure 5: Expression of rpS6 and p-rpS6 in human RCC tissue. Expression of rpS6 (red staining) in normal renal tissue A. and a clear-cell RCC B., as well as expression of p-rpS6 (brown staining) in normal renal tissue C. and a clear-cell RCC D. was assessed by immunohistochemistry.
rpS6
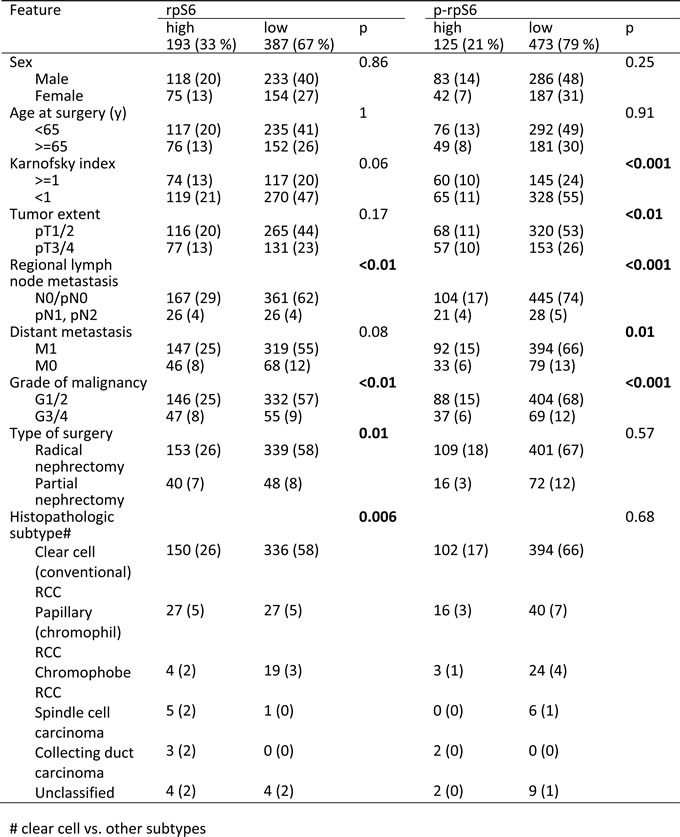
High rpS6 expression (defined as intensity > = 1) was observed in 193 patients (33 %). Using Fisher’s exact tests, high rpS6 expression levels were significantly associated with regional lymph node metastasis, grade of malignancy, partial nephrectomy, and non clear-cell histology (Table 2; for an analysis of localized vs. metastasized cases see Suppl. Table 1 and 2). Univariate survival analyses showed that high rpS6 expression is associated with a poor clinical outcome in patients with RCC (p < 0.001, Figure 6A, cancer-specific survival; for an analysis of progression-free survival see Suppl. Figure 1A; for an analysis of only clear-cell RCC see Suppl. Figure 2A). Next, we investigated the impact of rpS6 expression on the RCC related cancer specific survival and progression free survival by multivariate analysis. Multivariate Cox regression analysis included rpS6 expression, Karnofsky performance status, tumor extent, regional lymph node metastasis, distant metastasis, grade of malignancy, type of surgery, gender, and histological subtype (Table 3). RpS6 emerged as a significant prognostic factor in the whole patient group (Table 3, cancer-specific survival: 1.8 [1.4-2.4], p < 0.001; Suppl. Table 3, progression-free survival: 1.6 [1.2-2.2], p = 0.001) as well as in the group of patients with localized (Suppl. Table 4, cancer-specific survival: 1.6 [1.1-2.5], p = 0.028; Suppl. Table 3, progression-free survival: 1.5 [1-2.3], p = 0.039) and metastasized disease (Suppl. Table 4, cancer-specific survival: 2.1 [1.4-3.2], p = 0.001; Suppl. Table 3, progression-free survival: 2.1 [1.4-3.2], p = 0.001). Similar results were obtained for the histological subgroup of clear-cell RCC (Suppl. Tables 5 and 6).
Table 2: Comparison of rpS6 / p-rpS6 expression levels and clinical and pathologic features
p-rpS6
Elevated p-rpS6 expression levels were observed in the tumor tissue of 125 patients (21%). High p-rpS6 expression levels were significantly associated with tumor extent, regional lymph node metastasis, distant metastasis, and grade of malignancy (Table 2; for an analysis of localized vs. metastasized cases see Suppl. Table 1 and 2). Univariate survival analyses showed that high rpS6 expression is associated with a poor clinical outcome in patients with RCC (p < 0.001, Figure 6B, cancer-specific survival; for an analysis of progression-free survival see Suppl. Figure 1B; for an analysis of only clear-cell RCC see Suppl. Figure 2B). Multivariate Cox analysis identified p-rpS6 as a significant prognostic factor in the whole patient group (Table 3, cancer-specific survival: 1.4 [1-1.9], p = 0.03) and patients with metastatic disease (Suppl. Table 4, cancer-specific survival: 1.6 [1-2.5], p = 0.03; Suppl. Table 3, progression-free survival: 1.6 [1-2.5], p = 0.03). Similar results were obtained for the histological subgroup of clear-cell RCC (Suppl. Tables 5 and 6).
In patients with RCC expressing both high rpS6 and p-rpS6 levels, survival times were even shorter (cancer-specific survival: Figure 6C; for an analysis of progression-free survival see Suppl. Figure 1C; for an analysis of only clear-cell RCC see Suppl. Figure 2C). Multivariate analysis identifies the combination of both markers as prognostic relevant in the whole patient group (Table 3, cancer-specific survival: 1.9 [1.4-2.4], p < 0.001; Suppl. Table 3, progression-free survival: 1.8 [1.3-2.4], p < 0.001), patients with localized (Suppl. Table 4, cancer-specific survival: 1.9 [1.2-2.9], p = 0.007; Suppl. Table 3, progression-free survival: 1.7 [1.1-2.6], p = 0.013) and patients with metastasized disease (Suppl. Table 4, cancer-specific survival: 2.4 [1.6-3.9], p < 0.001; Suppl. Table 3, progression-free survival: 2.4 [16-3.9], p < 0.001).
Table 3: Uni- and multivariate analyses of rpS6 and p-rpS6 expression and clinical/pathologic features for the prediction of cancer specific survival in patients with RCCs
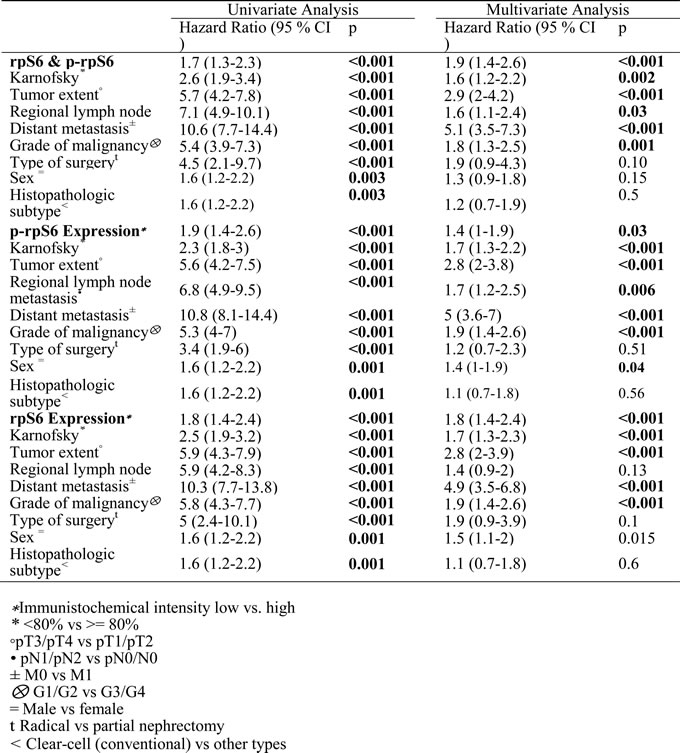
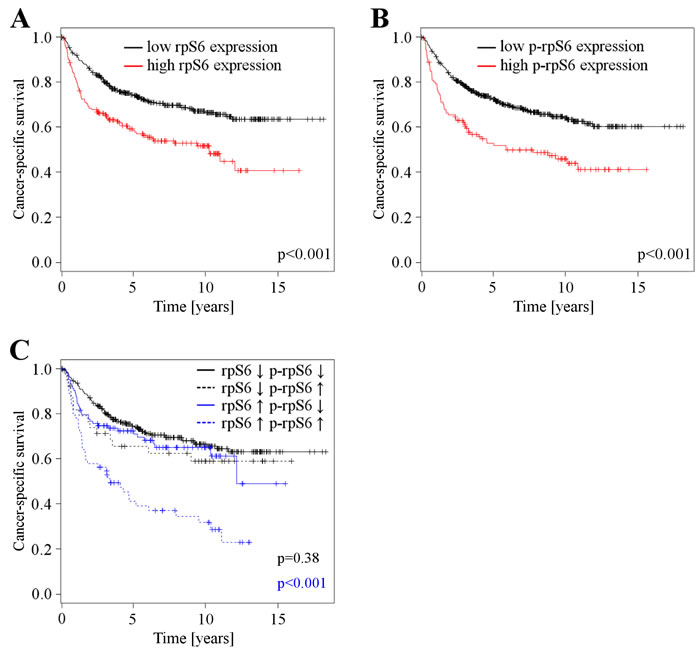
Figure 6: A. Cancer specific survival depending on rpS6 expression levels (n = 580), patients with low rpS6 expression levels (n = 387) vs. patients with high rpS6 expression levels (n = 193). B. Cancer specific survival depending on p-rpS6 expression levels (n = 598), patients with low p-rpS6 expression levels (n = 473) vs. patients with high p-rpS6 expression levels (n = 125). C. Cancer specific survival depending on p-rpS6 expression in patients with low (n = 339) and high rpS6 (n = 167) expression. Patients with low rpS6 expressing RCCs are further divided into groups with low (n = 300) and high (n = 39) p-rpS6 expression, the same partitioning is done for patients with high rpS6 expression: low p-rpS6 (n = 103) and high p-rpS6 (n = 64).
Discussion
Despite recent advances in systemic therapy of metastasized RCC, most patients are not cured and only 32% of patients treated with Temsirolimus showed clinical benefit, defined as objective response or stable disease > = 24 weeks [16]. Treatment with Everolimus leads to partial response in 14%, and stable disease in 73 % and 57 % after three and six months [17]. The application of targeted therapies is so far not guided by biomarkers. Thus, the development of predictive biomarkers is a priority in translational research in RCC to permit rational tailored treatment of individual patients.
Temsirolimus (CCI-779) and Everolimus (RAD001) are rapamycin derivatives and form a complex with the 12-kDa FK506-binding protein (FKBP12) that inhibits mTOR signaling [18] [19]. Along with several proteins, mTOR forms two distinct complexes, named mTORC1 and mTORC2, whereas mTORC1 but not mTORC2 is inhibited by rapamycin analogs. The mTORC1 pathway regulates major cellular functions, like proliferation or protein synthesis [20]. Downstream targets of mTOR signaling pathways are, among others, p70S6K, HIF1A, and 4E-BP1. The protein kinase p70S6K phosphorylates several downstream substrates, such as rpS6, and thereby promotes protein synthesis [21].
In our study, the mTOR inhibitor Everolimus mainly affected clonogenicity and proliferation of RCC cells, without substantial impact on cell death pathways. Although Everolimus was reported to induce apoptosis in leucemia cells [22], significant triggering of apoptotic cell death was not observed in our RCC model. Since Everolimus universally inhibits mTORC1, the differential apoptosis response might be caused by its varying effects on Akt dependent on cell and tissue type [23]. The major inhibitory effect of Everolimus on protein synthesis was confirmed both in vitro and ex vivo. Our innovative ex vivo tissue slice model allowed us to directly study the effects of Everolimus on human vital RCC tissue while maintaining the original tumor-stroma interaction. In this model, Everolimus substantially inhibited protein synthesis in RCC tissue, whereas the inhibitory effect on non-tumor tissue was much weaker. This finding points to a higher dependency on the mTOR pathway in tumor samples.
One important result of our study is the crucial functional relevance of rpS6 in mediating the anti-tumor effects of Everolimus. The siRNA-mediated downregulation of rpS6, but not of 4ebp1 or p27, abolished the inhibitory effects on proliferation and protein synthesis of Everolimus. In contrast, the functionality of 4ebp1 to repress translation could be taken over by its counterpart 4ebp2 and therefore compensate for its loss. Functional redundancy exists also for the cell cycle inhibitor p27, e.g. by the other Kip/Cip proteins p21 and p57. Although the importance of the protein kinase p70S6K for mTOR-mediated cellular effects is well established, the contribution of the various downstream effectors of p70S6K, such as rpS6 and others, is far from clear. Other effectors modulate protein synthesis (eEF2K, eIF4B, Pdcd4), cytoskeletal rearrangement, proliferation, splicing, cell survival and an mTOR feedback loop [24].
Importantly, the central functional role of rpS6 opens up the possibility to exploit the measurement of rpS6 expression levels as a predictive biomarker that prognosticates whether a tumor will respond to pharmaceutical mTOR inhibition or not. A limited number of studies addressed this question. Iwenofu et al. identified p-rpS6 in a group of 20 patients with high grade metastatic sarcoma as an marker for early clinical response to AP23573 treatment (an mTOR inhibitor). Highly p-rpS6 expressing tumor samples showed stable disease after two cycles of therapy, low expressing tumors showed progressive disease [25]. In RCCs, Cho et al. showed that immunohistochemical detection of p-rpS6 may have predictive potential for treatment with mTOR inhibitors. Tissue samples of 20 patients were stained for p-rpS6 and subsets of them for CA IX, p-Akt and PTEN. Partial or minimal response to Temsirolimus was associated with high p-rpS6 expression (p = 0.02) [26]. Li et al. confirmed p-rpS6 as a potential predictive marker (n = 18, improved PFS) and identified p-mTOR as an additional marker [27]. However, due to the limited study population results were preliminary and have to be confirmed by further studies. On the other hand, baseline amounts of PTEN and HIF-1α are not usable as predictive markers in Temsirolimus treated RCCs [28].
Since it is difficult to recruit enough eligible patients for a well designed study with sufficient statistical power that addresses the question of predicting mTOR inhibitor efficacy, future multicentric trials will have to validate the predictive power of rpS6 expression in a clinical setting. In any case, the results presented in this paper warrant a further evaluation of rpS6 as a companion diagnostic for the therapeutic use of mTOR inhibitors.
Although the identification of a predictive biomarker for targeted therapies is clinically most urgently required, in the case of RCCs there is also a medical need for reliable prognostic markers that are able to distinguish high risk from low risk patients. Patients who are at high risk for relapse or metastasis could be monitored more closely and offered more aggressive therapies or the inclusion into clinical trials. Therefore, we studied the expression of rpS6 and p-rpS6 in a large collection of RCC patients and compared the expression levels with clinical and pathological features. We found that high expression of rpS6 or p-rpS6 is associated with high grade RCCs. Furthermore, univariate and multivariate survival analyses showed that high expression of either one is associated with a poor clinical outcome in patients. Importantly, the combined assessment of rpS6 and p-rpS6 expression could further improve the prognostic significance. Since the immunohistochemical assessment of protein expression levels for prognostic and/or predictive purposes is already in clinical use in other tumor types (e.g. hormone receptors and proliferative activity in breast cancer), the analysis of rpS6 and p-rpS6 for prognostication of RCC patients seems feasible. Taken together, rpS6 and p-rpS6 represent promising candidates for prognostic and predictive biomarkers in patients with RCCs, and their possible clinical usage should be further validated by future investigations.
materials and Methods
Cell culture
Human RCC cell lines 769-P, 786-O, Caki-2, ACHN, A704, 293T and HK-2 were purchased from ATCC (Rockville, MD, USA). These celllines where authenticated by ATCC through short tandem repeat profiling. Cells where cultured for at most 10 passages at 37°C in 5% CO2 atmosphere and maintained in RPMI-1640 medium (Life Technologies, Gaithersburg, MD, USA) with additional 10% fetal calf serum, 1 mM glutamine, 25 mM glucose and 1 % penicillin/streptomycin (Life Technologies, Gaithersburg, MD, USA).
Transfection
Endogenous protein was specifically knocked down transiently by transfecting cell lines with short interfering RNA (siRNA) oligonucleotides at concentration of 10 nM (p27 and 4ebp1) and 20 nM (rpS6) using Lipofectamine 2000 (Invitrogen, Carlsbad, CA, USA). Three different rpS6 siRNAs were obtained from Dharmacon (Lafayette, CO, USA) and Santa Crus (Dallax, TX, USA): #J-003024-11, #J-003472-07, #sc-36424. Other siRNAs used were obtained from Dharmacon as well: #J-003472-07 against p27 and #J-003005-13 against 4ebp1. Non-specific siRNA was used as a control (#D-001810-10).
Immunoblot analysis
Ice-cold PBS was used to rinse cells, followed by lysis with lysis buffer (50 mM Tris-HCl (pH 8.0), 120 mM NaCl, 5 mM EDTA, 0,5% Triton X-100) containing PMSF (1 mM), proteinase inhibitors (Roche, Mannheim, Germany, #1697498) and phosphatase inhibitors (10 mM NaPPi, 200 µM NaVO3, 25 mM NaF). Incubation for 15 min on ice was followed by centrifugation of lysates at 16 000 g for 20 min. Bradford Assays (Bio-Rad, Munich, Germany) were used to measure protein concentrations. For electrophoresis, 20-40 µg of protein was separated with 10-15% polyacrylamid gels and blotted onto nitrocellulose membranes (Bio-Rad) by standard procedures. Membranes where washed, incubated over night with primary antibody, washed again and incubated with secondary antibody (1:3000) coupled to horseradish peroxidase (Bio-Rad). Visualization was performed by an enhanced chemiluminescence detection system (GE Healthcare, Munich, Germany). Following primary antibodies were used: anti-beta-Actin (Sigma, Deisenhofen, Clone AC15, A5441), anti-4ebp1 (Cell Signaling, Boston, #9644), anti-p-4ebp1 (Cell Signaling, #2855), anti-rpS6 (Cell Signaling, #2317), anti-p-rpS6 (Cell Signaling, #4858), anti-p27 (DakoCytomation, Clostrup, Clone SX53G8, M 7203). Everolimus was usually used in concentrations of 1 µM for 72 h, leucine (Sigma-Aldrich, St. Louis, MO) for 2 h at concentrations of 10 mM.
Cytotoxicity assays
104 cells were plated in 96-well plates, adhered for 24 h and treated with Everolimus for 72 h. The surviving ratio was assessed by staining with crystal violet [29]. After removing of the supernatant, the cells were incubated in 2% crystal violet solution in 20% methanol for 10 min. After washing in running-tap water the plates were air-dried for 24 h. The portion of bound crystal violet was solubilized by the addition of a 0.1 M sodium citrate buffer in 50% ethanol. Absorption was measured at 550 nm using a microplate reader (Bio-Rad, Munich, Germany).
FACS
FACS measurements of propidium iodid dyed cells and their supernatants were performed with a PAS II Flowmeter (Partec, Munich, Germany) to assess the amount of vital cells and their cell cycle distribution. Cells were centrifuged at 1000 rpm for 5 min and Nicoletti agens added (0.1 % Na-Citrat, 0.1 % Triton X-100, pH 7.4). Data was acquired and analysed with the MultiCycle software (Phoenix Flow Systems, San Diego, CA, USA).
Proliferation assay
Assessment of proliferation was performed in 96-well plates. 104 cells were seeded, adhered for 24 hours and treated with BrdU for 48h (Amersham Cell Proliferation Kit, RPN250, GE Healthcare, Solingen). Incubation with an enzyme-linked antibody against BrdU followed, which allowed photometrical quantification of incorporated BrdU at 450 nm.
Clonogenicity assays
500 cells were seeded into 6-well culture dishes and incubated for seven days (14 days for cell lines ACHN and A704) prior to crystal violet staining and colony counting with ClonoCounter [30].
Ex vivo tissue slice technique
Fresh human renal cell carcinoma tissue samples were obtained from the Tissue Bank of the Center for National Tumor Diseases (NCT, Heidelberg, Germany) directly after surgery. They were maintained in DMEM medium on ice, cut into 300 µm thick slices (Leica VT1200 S vibrating blade microtome; Leica, Wetzlar, Germany). Tissue slices were then placed onto porous filter membranes, suspended in six-well plates and cultured in DMEM supplemented with penicillin (100 U/ml, Sigma Aldrich, St. Louis, MO, USA) and steptomycin (100 mg/ml, Sigma Aldrich) in a conventional CO2 incubator. Slices were then incubated in 10 µM Everolimus for 72 h. Approvement of the local ethics committee of the University Hospital of Heidelberg, Germany, was acquired for usage of tumor tissue for research purposes. Anonymization of the data was performed prior to analysis of the data and written consent from the donors or the next of kin obtained for the use of these samples in research.
35S-methionine labeling
Protein synthesis was assessed through labeling of cells with the beta-emitting radioisotope 35S-methionine. Cells were treated with 1 µM Everolimus in Methionine depleted RMPI medium, followed by addition of radioactive 35S-methionine for one hour. They were then lysed in 0.2N NaOH, part of which was used for Lowry protein concentration measurement [31]. BSA and 50 % trichloracetic acid was added, the sample 10 min incubated on ice followed by centrifugation at 15 000 rpm for 5 min. After addition of 0.25N NaOH, 1.25 N trichloracetatacid and ULTIMA GoldTM the sample was measured in a scintillation counter (Packard TriCarb 2900, Meriden, IL). Tissue samples were incubated in 10 µM Everolimus in standard RPMI for 72h and labeled with radioactive 35S-methionine for 2 h.
Patients
Tissue samples from 838 patients with primary renal cell carcinoma (RCC) treated at the Department of Urology at the University of Heidelberg between 1987 and 2005 were collected. The human tissue samples were provided by the Tumor Tissue Bank of the NCT Heidelberg after approval by the ethics committee of the University of Heidelberg (ethics approval number: 206 / 2005). Clinical follow-up was available for all cases. Patients were prospectively evaluated every 3 months for the first 2 years after treatment, every 6 months for the next 3 years, and yearly thereafter (chest x-ray or thoracic CT scan; abdominal sonography or CT scan or MRI; serum chemistry). Survival was calculated from the date of nephrectomy until last visit or death. Follow-up was performed according to the guidelines. All tissue samples were reviewed by experienced pathologists. The tumors were graded according to the 4-tiered nuclear grading system [32] and pathologically staged based on the TNM classification (2002). A tissue micro array containing 838 primary and corresponding normal tissue samples was created. All cases of RCC were centrally reviewed by an experienced GU pathologist (S.M.G.). Sections were cut from representative donor blocks for the tissue microarray, and stained with hematoxylin and eosin. Afterwards, morphologically representative regions were chosen from the tumor and normal renal tissue samples. With the help of a semiautomatic system (Beecher Instruments, Silver Spring, MD), two cyclindrical core tissue specimens were punched from these regions and arrayed into a recipient paraffin block. 19 tissue arrays were generated, each containing 200 core tissue samples, according to 50 patients per array [14, 15].
Immunohistochemistry
The tissue micro array slides were dewaxed and rehydrated using xylene and a series of graded alcohols, followed by heat-induced antigen retrieval using a target retrieval solution (S2031, DakoCytomation, Glostrup, Denmark) in a pressure cooker for 10 min. Staining was performed using an automated staining system (Techmate 500, DakoCytomation) with anti-rpS6 (S6 (5G10) Rabbit mAb #2217, Cell Signaling, Boston, USA) and anti-p-rpS6 (S6-p240 Mouse mAbDAK-S6-240, DakoCytomation, Glostrup, Denmark) for 90 min, and avidin-biotin-complex peroxidase technique using aminoethylcarbazole for visualisation and hematoxylin for counterstaining. In accordance with the manufacturers’ instructions, the following solutions were used: ChemMate Detection Kit (K5003, DakoCytomation, containing Dako REAL™ Link, ready-to-use biotinylated goat anti-mouse and anti-rabbit immunoglobulins, and Dako REAL™ AEC/H2O2 Substrate Solution), ChemMate Buffer Kit (K5006, DakoCytomation), and for reduction of non-specific avidin/biotin-related staining Avidin/Biotin Blocking Kit (SP-2001, Vector Laboratories, Burlingame, U.S.A.). As a negative control for the immunohistochemical staining procedure, the primary antibody was omitted or an isotype control antibody (IgG1) was used, with all other experimental conditions kept constant. For the immunohistochemical assessment of rpS6 and p-rpS6 expression, intensity was divided into four groups: 0 = negative to very low, 1 = low, 2 = medium, 3 = high expression. The arrays were independently scored by two pathologists (MK, SMG) blinded to tissue annotations and patient outcomes. In the few instances of discrepant scoring, a consensus score was determined.
Statistical methods
Data were analysed using the R software package (version 3.0.1, http://www.rproject.org). For count data, Fisher’s exact test (two-sided) was used. The Kaplan-Meier method was applied to calculate survival rates for both progression-free and cancer-specific overall survival. For multivariate analysis, the Cox proportional hazards regression model was used. Univariate survival data were tested for significance using the Mantel-Haenszel log rank test. P-values less than 0.05 were considered significant.
Acknowledgments
We thank all laboratory members for helpful suggestions and for expert technical assistance. Furthermore, we would like to thank all associates of the NCT tissue bank and PD Dr. Volker Ehemann for his assistance with the FACS analyses. A special word of thanks is due to Dr. Katrin Tagscherer and Dr. Anne Faßl for their help with laboratory methods. We thank Humphrey Gardner for his help with the immunohistochemistry.
Conflicts of Interest
The authors have nothing to disclose.
We declare that the content of the manuscript is original and that it has not been published or accepted for publication, either in whole or in part, in any form. We declare that no part of the manuscript is currently under consideration for publication elsewhere.
Grant Support
This work had no grant support.
References
1. Escudier B, Porta C, Schmidinger M, Algaba F, Patard JJ, Khoo V, Eisen T, Horwich A and Group EGW. Renal cell carcinoma: ESMO Clinical Practice Guidelines for diagnosis, treatment and follow-up. Annals of oncology. 2014; 25 Suppl 3:iii49-56.
2. Ljungberg B, Bensalah K, Canfield S, Dabestani S, Hofmann F, Hora M, Kuczyk MA, Lam T, Marconi L, Merseburger AS, Mulders P, Powles T, Staehler M, Volpe A and Bex A. EAU Guidelines on Renal Cell Carcinoma: 2014 Update. European urology. 2015; 67:913-24.
3. Hutson TE, Bukowski RM, Cowey CL, Figlin R, Escudier B and Sternberg CN. Sequential use of targeted agents in the treatment of renal cell carcinoma. Critical reviews in oncology/hematology. 2011; 77:48-62.
4. Vickers MM, Choueiri TK, Rogers M, Percy A, Finch D, Zama I, Cheng T, North S, Knox JJ, Kollmannsberger C, McDermott DF, Rini BI and Heng DY. Clinical outcome in metastatic renal cell carcinoma patients after failure of initial vascular endothelial growth factor-targeted therapy. Urology. 2010; 76:430-434.
5. Ghosh AP, Marshall CB, Coric T, Shim EH, Kirkman R, Ballestas ME, Ikura M, Bjornsti MA and Sudarshan S. Point mutations of the mTOR-RHEB pathway in renal cell carcinoma. Oncotarget. 2015; 6:17895-17910. Doi: 10.18632/oncotarget.4963.
6. Habib SL and Liang S. Hyperactivation of Akt/mTOR and deficiency in tuberin increased the oxidative DNA damage in kidney cancer patients with diabetes. Oncotarget. 2014; 5:2542-2550. Doi: 10.18632/oncotarget.1833.
7. Ribback S, Cigliano A, Kroeger N, Pilo MG, Terracciano L, Burchardt M, Bannasch P, Calvisi DF and Dombrowski F. PI3K/AKT/mTOR pathway plays a major pathogenetic role in glycogen accumulation and tumor development in renal distal tubules of rats and men. Oncotarget. 2015; 6:13036-13048. Doi: 10.18632/oncotarget.3675.
8. Hay N and Sonenberg N. Upstream and downstream of mTOR. Genes & development. 2004; 18:1926-1945.
9. Calastretti A, Bevilacqua A, Ceriani C, Vigano S, Zancai P, Capaccioli S and Nicolin A. Damaged microtubules can inactivate BCL-2 by means of the mTOR kinase. Oncogene. 2001; 20:6172-6180.
10. Zhang HH, Lipovsky AI, Dibble CC, Sahin M and Manning BD. S6K1 regulates GSK3 under conditions of mTOR-dependent feedback inhibition of Akt. Molecular cell. 2006; 24:185-197.
11. Thimmaiah KN, Easton J, Huang S, Veverka KA, Germain GS, Harwood FC and Houghton PJ. Insulin-like growth factor I-mediated protection from rapamycin-induced apoptosis is independent of Ras-Erk1-Erk2 and phosphatidylinositol 3’-kinase-Akt signaling pathways. Cancer research. 2003; 63:364-374.
12. Avellino R, Romano S, Parasole R, Bisogni R, Lamberti A, Poggi V, Venuta S and Romano MF. Rapamycin stimulates apoptosis of childhood acute lymphoblastic leukemia cells. Blood. 2005; 106:1400-1406.
13. Menon S, Dibble CC, Talbott G, Hoxhaj G, Valvezan AJ, Takahashi H, Cantley LC and Manning BD. Spatial control of the TSC complex integrates insulin and nutrient regulation of mTORC1 at the lysosome. Cell. 2014; 156:771-785.
14. Macher-Goeppinger S, Aulmann S, Tagscherer KE, Wagener N, Haferkamp A, Penzel R, Brauckhoff A, Hohenfellner M, Sykora J, Walczak H, Teh BT, Autschbach F, Herpel E, Schirmacher P and Roth W. Prognostic value of tumor necrosis factor-related apoptosis-inducing ligand (TRAIL) and TRAIL receptors in renal cell cancer. Clinical cancer research. 2009; 15:650-659.
15. Macher-Goeppinger S, Aulmann S, Wagener N, Funke B, Tagscherer KE, Haferkamp A, Hohenfellner M, Kim S, Autschbach F, Schirmacher P and Roth W. Decoy receptor 3 is a prognostic factor in renal cell cancer. Neoplasia. 2008; 10:1049-1056.
16. Hudes G, Carducci M, Tomczak P, Dutcher J, Figlin R, Kapoor A, Staroslawska E, Sosman J, McDermott D, Bodrogi I, Kovacevic Z, Lesovoy V, Schmidt-Wolf IG, Barbarash O, Gokmen E, O’Toole T, et al. Temsirolimus, interferon alfa, or both for advanced renal-cell carcinoma. The New England journal of medicine. 2007; 356:2271-2281.
17. Amato RJ, Jac J, Giessinger S, Saxena S and Willis JP. A phase 2 study with a daily regimen of the oral mTOR inhibitor RAD001 (everolimus) in patients with metastatic clear cell renal cell cancer. Cancer. 2009; 115:2438-2446.
18. Peralba JM, DeGraffenried L, Friedrichs W, Fulcher L, Grunwald V, Weiss G and Hidalgo M. Pharmacodynamic Evaluation of CCI-779, an Inhibitor of mTOR, in Cancer Patients. Clinical cancer research. 2003; 9:2887-2892.
19. Sabatini DM, Erdjument-Bromage H, Lui M, Tempst P and Snyder SH. RAFT1: a mammalian protein that binds to FKBP12 in a rapamycin-dependent fashion and is homologous to yeast TORs. Cell. 1994; 78:35-43.
20. Laplante M and Sabatini DM. mTOR signaling in growth control and disease. Cell. 2012; 149:274-293.
21. Ma XM and Blenis J. Molecular mechanisms of mTOR-mediated translational control. Nature reviews Molecular cell biology. 2009; 10:307-318.
22. Teachey DT, Obzut DA, Cooperman J, Fang J, Carroll M, Choi JK, Houghton PJ, Brown VI and Grupp SA. The mTOR inhibitor CCI-779 induces apoptosis and inhibits growth in preclinical models of primary adult human ALL. Blood. 2006; 107:1149-1155.
23. Sabatini DM. mTOR and cancer: insights into a complex relationship. Nature reviews Cancer. 2006; 6:729-734.
24. Fenton TR and Gout IT. Functions and regulation of the 70kDa ribosomal S6 kinases. The international journal of biochemistry & cell biology. 2011; 43:47-59.
25. Iwenofu OH, Lackman RD, Staddon AP, Goodwin DG, Haupt HM and Brooks JS. Phospho-S6 ribosomal protein: a potential new predictive sarcoma marker for targeted mTOR therapy. Modern pathology. 2008; 21:231-237.
26. Cho D, Signoretti S, Dabora S, Regan M, Seeley A, Mariotti M, Youmans A, Polivy A, Mandato L, McDermott D, Stanbridge E and Atkins M. Potential histologic and molecular predictors of response to temsirolimus in patients with advanced renal cell carcinoma. Clinical genitourinary cancer. 2007; 5:379-385.
27. Li S, Kong Y, Si L, Chi Z, Cui C, Sheng X and Guo J. Phosphorylation of mTOR and S6RP predicts the efficacy of everolimus in patients with metastatic renal cell carcinoma. BMC cancer. 2014; 14:376.
28. Figlin RA, de Souza P, McDermott D, Dutcher JP, Berkenblit A, Thiele A, Krygowski M, Strahs A, Feingold J, Boni J and Hudes G. Analysis of PTEN and HIF-1alpha and correlation with efficacy in patients with advanced renal cell carcinoma treated with temsirolimus versus interferon-alpha. Cancer. 2009; 115:3651-3660.
29. Gillies RJ, Didier N and Denton M. Determination of cell number in monolayer cultures. Analytical biochemistry. 1986; 159:109-113.
30. Niyazi M, Niyazi I and Belka C. Counting colonies of clonogenic assays by using densitometric software. Radiation oncology. 2007; 2:4.
31. Lowry OH, Rosebrough NJ, Farr AL and Randall RJ. Protein measurement with the Folin phenol reagent. The Journal of biological chemistry. 1951; 193:265-275.
32. Sobin LH, Gospodarowicz MK and Wittekind Ch. (2009). TNM. Classification of Malignant Tumours. 7th ed. (New York: Wiley).