
Introduction
Breast cancer is the most frequent cancer in women worldwide, accounting for 23% of total cancer cases and 14% of cancer deaths according to Global Cancer Statistics from 2011 [1]. Encouraging and advanced medical treatments that focus on systemic therapy and earlier diagnosis have been largely developed for breast cancer [2], however, many mechanisms underlying breast cancer progression are still not completely understood.
Mitochondria are the powerhouse of eukaryotic cells and are responsible for regulating energy metabolism, respiration and cell apoptosis [3]. Multiple investigators have demonstrated that mitochondria play an important role in cancers, and emerging evidences indicate that cancer cells are generally accompanied by mitochondrial dysfunction, such as the production of copious amounts of reactive oxygen species (ROS) or metabolic disorders [4-6]. High levels of ROS accumulation can promote DNA damage and genetic instability, which finally induce cell death and senescence [7]. Mitochondrial membrane potential has also been linked to an increase in malignant transformation [8]. Besides, metabolic changes are the hallmarks of cancer cells. Many cancer cells preferentially use glycolysis to generate ATP and metabolic intermediates, even in the presence of oxygen [9]. This preference is manifested by active glucose uptake and increased lactate production [10, 11]. Impaired mitochondrial metabolism subsequently contributed to the development of cancer progression [12]. Recent studies indicate that mitochondria proteins play a pivotal role in the respiration chain, and a loss of these proteins can induce mitochondrial dysfunction [13-15].
In our previous study, we conducted a SILAC (stable isotope labeling with amino acids in cell culture) assay in mammary epithelial cells (16N) and breast tumor cells (NT) that were both isolated from a single patient and found that COX5B was upregulated in breast cancer cells compared with normal cells [16]. COX5B is a peripheral nuclear-encoded subunit of CcO (cytochrome c oxidase), which is a multisubunit bigenomic protein complex that catalyzes the last step of the mitochondrial electron transport chain. Previous studies showed that the depletion of COX5B resulted in decreased CcO activity and suggested a regulatory role for COX5B [17]. However, few studies have reported the role of COX5B in human breast cancer. In this study, we first report that loss of COX5B inhibited cell proliferation and promoted cell senescence in breast cancer. We further explore the function and mechanism of COX5B in breast cancer..
Results
COX5B is upregulated in breast cancer tissue and cell lines
By performing stable isotope labeling with amino acids in cell culture (SILAC) in the normal epithelial cell line (16N) and primary breast tumor cell line (NT), we obtained many candidate genes, of which COX5B was increased in NT compared with 16N (Fig. 1A-1D). The peptide sequences of COX5B were also showed in Supplementary Figure S1. To validate the expression level of COX5B in breast cancer, we examined the expression of COX5B in two pairs of fresh, patient-derived tissue, including normal tissues, primary tumor tissues and metastatic lymph nodes. The results showed that COX5B was significantly increased in the two breast cancer samples compared with normal tissues, which was consistent with the results of SILAC (Fig. 1E). Interestingly, the COX5B expression was also elevated in metastatic lymph nodes. Furthermore, COX5B expression was examined in 40 tumor tissue and 20 normal or benign tissue samples. Upregulation of COX5B were detected in 26 of 40 samples, whereas 6 of 20 normal tissues with COX5B overexpression (Fig. 1F). In addition, COX5B was also upregulated in most breast cancer cell lines than the non-malignant cell line MCF10A, both at the mRNA and protein levels (Fig. 1G, 1H). The results indicated that COX5B was upregulated in breast cancer tissues and cell lines.
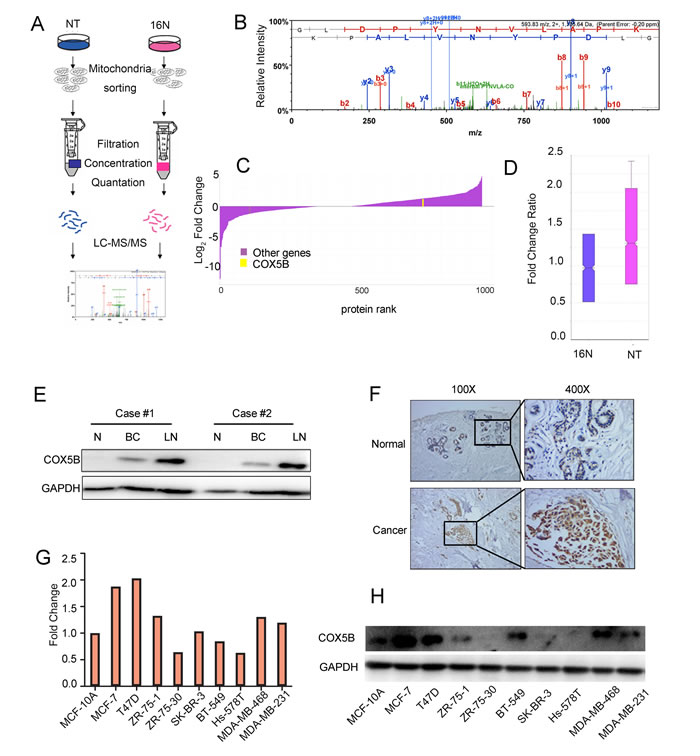
Figure 1: COX5B is upregulated in breast cancer tissues and cells. (A) Schematic overview of quantitative stable isotope labelling by amino acids in cell culture (SILAC) and label-free mitochondrial proteomic analysis approaches. (B) The spectrum of COX5B obtained from MS. (C) The fold change of the total proteins from SILAC and the yellow line indicated the relative expression of COX5B (NT VS 16N). (D) The fold change ratio of the breast cancer cells (NT and 16N). (E) Expression of COX5B in two paired normal breast (N), breast cancer (BC) and lymph node (LN) tissues analyzed by Western blot. (F) Immunohistochemistry images of COX5B protein are shown in the large (400 × magnification) and small images (100 × magnification). (G) The mRNA level of COX5B expression in breast cancer cell lines. (H) The protein level of COX5B expression in breast cancer cell lines.
Low expression of COX5B is associated with good prognosis
To further confirm the correlation between COX5B expression and clinical outcome, an online Kaplan-Meier plotting tool was employed to analyze survival according to Gyorffy. The results showed that low COX5B expression was associated with better DFS (disease-free survival) in patients with breast cancer (Fig. 2A). The similar results were also obtained in Luminal A, Luminal B and Basal subtypes, except for the HER2 subgroup (Fig. 2B-2E). We obtained the similar results when using the other probes of COX5B except the probe 213736_at in the Kaplan-Meier plotting tool (Fig S2-S4). We also utilized another online prediction tool, Oncomine, and found that COX5B expression was much higher in breast cancer tissues than in normal breast tissues (Fig. 2F). Taken all together, our findings suggested that low COX5B expression may indicate a good prognosis for breast cancer patients.
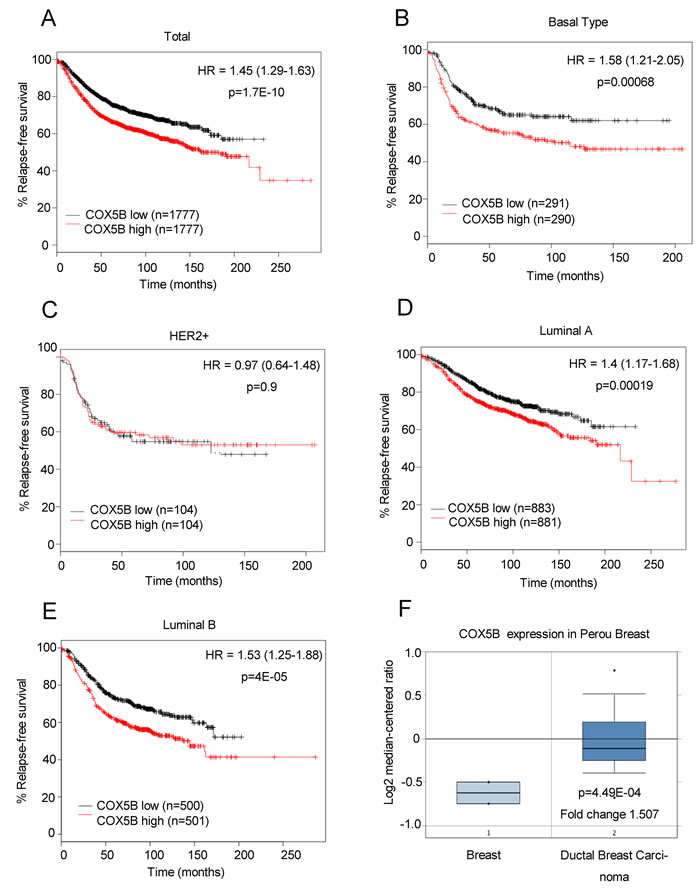
Figure 2: Low COX5B is associated with poor survival of breast cancer patients. (A-E) Survival analysis of COX5B expression in patients with indicated subtype using the online Kaplan-Meier plotting tool (Total; Basal Type; Her2+; Lumina A; Lumina B). (F) Oncomine plots of COX5B expression pattern in human breast cancers vs normal tissues.
Loss of COX5B inhibits breast cancer cell proliferation and induces cell senescence
To assess COX5B function in breast cancer progression, we stably knocked down COX5B in 3 breast cancer cell lines (MDA-MB-231, MDA-MB-468 and MCF-7). The efficiency of knockdown was confirmed with mRNA and protein level analyses (Fig. 3A, 3B). We then explored the effects of COX5B depletion on cell proliferation and migration. The result showed that loss of COX5B inhibited both cell proliferation and migration in the three cell lines (Fig. 3C, 3D). In the process, cells with sh-COX5B became flattened and elongated after three passages, which were morphological transformation of cell senescence. Thus, a β-galactosidase staining assay was used to determine whether the cells undergo cell senescence. We found that more COX5B-depleted cells (25~45%) stained positively than control cells (7~16%) (Fig. 3E), suggesting that loss of COX5B induced senescence.
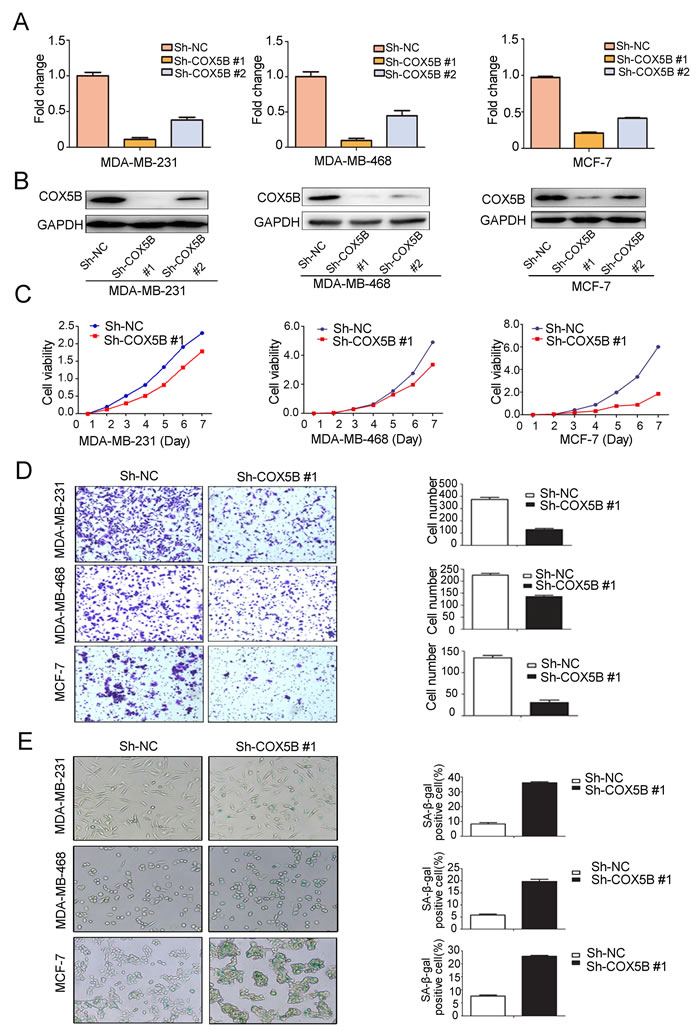
Figure 3: Loss of COX5B inhibits breast cancer cell proliferation and migration but induces cell senescence. (A) The mRNA level of COX5B after its stable knockdown in MDA-MB-231, MDA-MB-468, and MCF-7 cells by Real-time PCR. (B) The expression of COX5B protein in three stably knocked down cell lines by Western blot. (C) The proliferation of three stably knocked down cell lines. (D) The migration ability of each cell line was evaluated with a transwell assay in vitro. The left panel shows photos of representative fields (100 × magnifications) of migratory cells, and the right panel shows histograms of the results. (E) Representative images of β-galactosidase staining assay (left) and positive cell quantification (right) showed a marked increment in three stably knocked down cell lines. The statistical analysis was performed using Student’s t-test (n=3) (P < 0.05).
Loss of COX5B enhanced IL-8 and other associated cytokines releasing
In regard to the mechanisms by which loss of COX5B inhibited cell movement and induced cell senescence, microarray expression profile analysis were performed and revealed about 1000 genes changing at least 2-fold expression in response to COX5B down-regulation (Fig. 4A), of which are involved in various pathways, including the “chemokine signal”, “oxidative phosphorylation”, “NOD-like receptor signaling”, “Toll-like receptor signaling” and “cytokine-cytokine receptor interaction” pathways, through GO enrichment analyses (Fig. 4B).
We then picked genes showing the most statistically significant expression differences, including both up- and down-regulated genes, to validate by real-time PCR analysis in MDA-MB-468 and MDA-MB-231 cell lines. Six of these showed validated expression differences by this method: CXCL1, CXCL16, IL-8, IL-10, CSF2, CES1 (Fig. 4C). It had been widely demonstrated that IL-8 could alter the microenvironment to impact cell migration, we then detected IL-8 secretion with ELISA assay and the results were consistent with the mRNA expression data (Fig. 4D). To evaluate whether the upregulation of cytokines may influence cell migration, transwell assay was performed in MDA-MB-231 cells, with sh-COX5B and sh-NC cells cultured medium as chemoattractant in the lower chamber. We found that condition medium from COX5B knockdown cells promoted cell migration (Fig. 4E). To further explore the metastatic ability of COX5B shRNA stable cancer cell line in the xenograft tumor model, two groups of mice were equally injected with sh-NC or sh-COX5B cells vis tail vein. The result showed that mice with sh-COX5B group increase the average number of metastatic lung foci compare with sh-NC group (Fig. 4F).
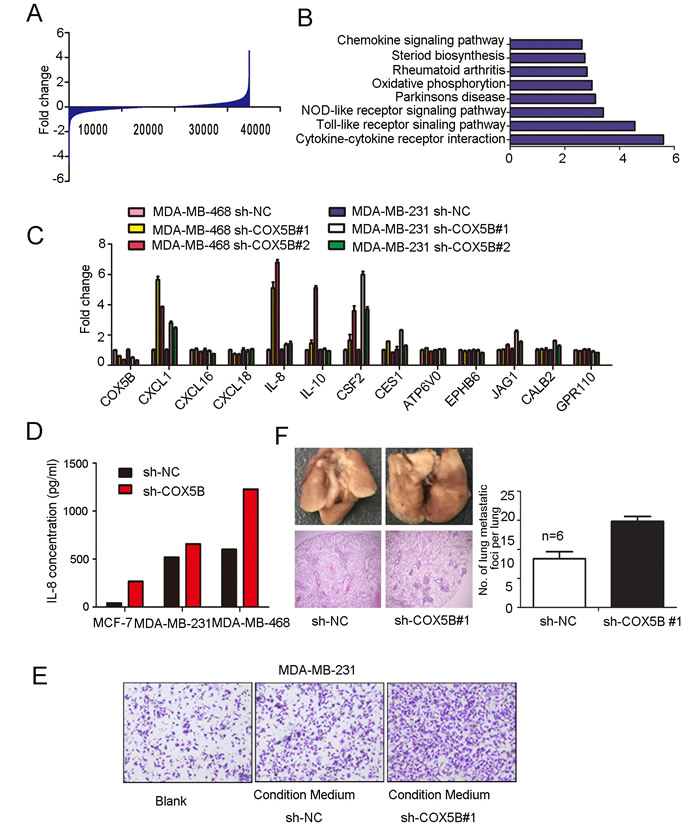
Figure 4: Loss of COX5B enhanced IL-8 and other associated cytokines releasing. The entire genes obtained from microarray profile assay. (B) GO enrichment analyses of COX5B knockdown and control cells. (C) Real-time PCR validated the candidate genes. (D) IL-8 secretion analyzed by ELISA. (E) Migration assay of MDA-MB-231 induced by MDA-MB-231 sh-COX5B #1- and sh-NC-conditioned medium. (F) Left panel shows representative images for the lung metastatic nodules, the upper two photos show number of metastatic nodules in lungs surface indicated by red arrows and the lower ones display hematoxylin-eosin stained sections of lungs (magnification ×40). Right panel, quantification of the number of lung metastatic foci per lung, the number of foci was counted in three sections per lung under the microscope n=6 p<0.05.
Loss of COX5B leads to mitochondrial dysfunction.
Given that COX5B is a subunit of cytochrome c oxidase and plays a crucial role in the mitochondrial electron transport chain, we further evaluated the effect of COX5B on mitochondrial metabolic function in stable knockdown cell lines.
Intracellular ATP measurement indicated that COX5B knockdown significantly decreased the levels of cellular ATP compared with the control group (Fig. 5A). Because the source of ATP is dependent on the processes of aerobic respiration and anaerobic respiration, we further detected the glucose uptake and lactate secretion to assess the metabolic pathway. The results showed that glucose uptake was slightly elevated in response to COX5B depletion compared with the control group (Fig. 5B). However, lactate secretion decreased in the COX5B down-regulation group (Fig. 5C). In addition, down-regulation of COX5B resulted in a significant loss of mitochondrial potential and increase in ROS production (Fig. 5D, 5E). Taken together, these results suggested that COX5B knockdown promoted aerobic respiration and led to internal mitochondrial dysfunction, which may be associated with cell senescence and cytokine increase.
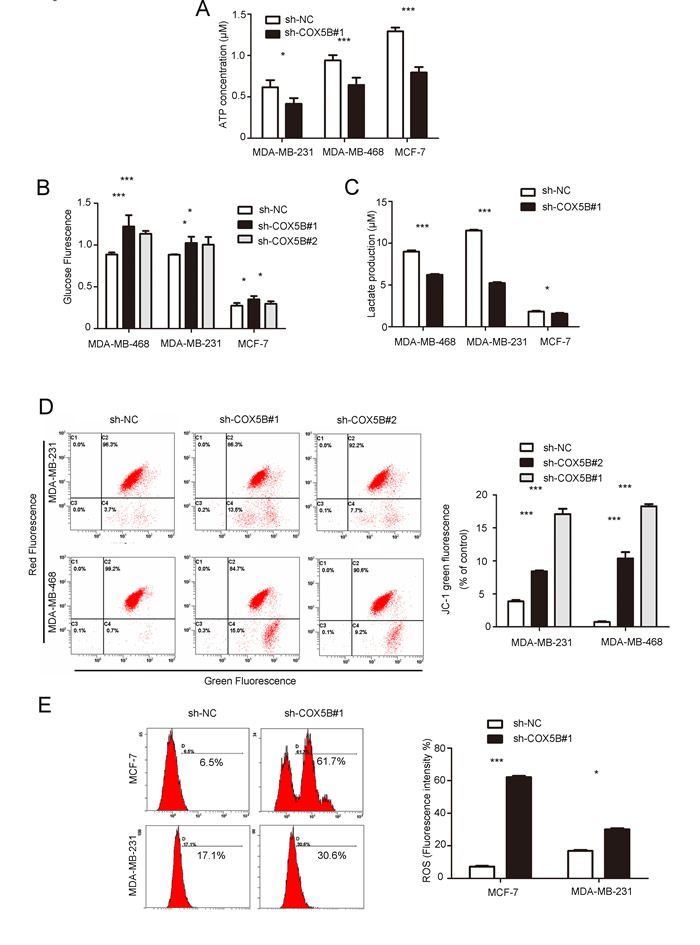
Figure 5: Down-regulation of COX5B leads to mitochondrial dysfunction. (A) ATP production in COX5B-depleted and control MDA-MB-231, MDA-MB-231, and MCF-7 cells. (B, C) Glucose uptake and lactate secretion were detected in COX5B knockdown or control MDA-MB-231, MDA-MB-231, and MCF-7 cells. (D) FACS analysis of mitochondrial membrane potential. The left panel shows a representative graph of the indicated cells, the right panel shows statistical data (E) FACS analysis (left) and Statistical data (right) of mitochondrial ROS generation in indicated cells. Data were presented as mean ± SD from three independent experiments. *P < 0.05, ***P < 0.001 compared with control.
Discussion
Breast cancer is a multifaceted disease with a variety of biological subtypes. Breast cancer relapse remains an obstacle in successful treatment. Recently, selective targeting of breast cancer by some small molecules may hold promise in a subset of patients [18]. However, more biomarkers and targets for the management of this disease are still needed.
Our work revealed that COX5B was overexpressed in human breast cancer tissues and cell lines, in line with this, Chen et al. have reported that COX5B expression was elevated in both MCF-7 and MDA-MB-231 cells compared with MCF-10A cells (normal epithelial cell) by proteomic analysis [19]. Coincidentally, COX5B upregulation was also reported in prostate cancer and cutaneous squamous cell carcinoma [20, 21]. In our study, we further validated that COX5B expression was higher in primary tumor tissues and metastatic lymph nodes than in normal tissue. In addition, a high expression of COX5B predicted a poor prognosis for breast cancer patients based on analyses using the Oncomine database and a Kaplan Meier plot. These results indicated that COX5B was associated with poor prognosis.
Considering the role COX5B in mitochondrial electron transport chain, COX5B knockdown may be associated with mitochondrial dysfunction and metabolic disorder. Indeed, our results supported that COX5B-depletion induced mitochondrial dysfunction by increasing ROS production and decreasing MMP depolarization and intracellular ATP generation. Previous studies reported that mitochondrial dysfunction was associated with senescence [22]. Besides, mitochondrial ROS and mitochondrial membrane potential (MMP) are involved in senescence-associated retrograde signaling [23, 24]. Emerging evidence indicates that glucose metabolism also shifts in senescent cells [25-27]. Taken together, the mitochondrial dysfunction and metabolic disorder may play vital role in cell senescence.
In our study, we also found that loss of COX5B induced senescence and increased multiple cytokines secretion such as IL-8, CXCL1, CSF2 and most of which were enriched in cytokine-cytokine receptor interaction pathway. Previous studies have predicted that multiple cytokines or growth factors were involved in the tumor progression of metastasis [9, 28]. For example, IL-8 expression was associated with pathologic stage, high tumor grade and metastatic property in prostate cancer [29] and breast cancer [30, 31]. What’s more, IL-8 was also correlated with an increased vascularization in gastric carcinoma [32]. CXCL1 also plays a vital role in multiple tumor progression. It was reported that increased CXCL1 protein levels were associated with higher-grade stage in prostate cancer [33], advanced tumor stage and poorer prognosis in gastric cancer through VEGF signaling. Those studies suggested that IL-8 or CXCL1 might be potent to improve anti-angiogenic therapy for multiple cancers [34].
However we didn’t probe deep into the linkage between COX5B silence and these cytokines expression. This linkage may be associated with MAVS (mitochondrial antiviral signaling) pathway and excessive activation of MAVS-mediated antiviral signaling leads to dysfunction of mitochondrion [35]. COX5B was validated to reduce MAVS signaling by repressing ROS production. These alterations may induce cell endoplasmic reticulum stress and finally lead to cytokines secretion. Taken together, cytokines secretion induced by loss of COX5B may be associated activation of MAVS signaling.
Recent research reported that certain chemotherapy or radiotherapy agents can also induce cell senescence. However, clinical treatment may also induce cell cytokines secretion. In brief, these findings suggested that anti-cancer regimes may not only suppress the proliferation of target cells but also alter its microenvironment. Therefore, clinical performance should combine anti-cancer drugs with inflammation inhibitors such as IL-8 blockers.
Loss of COX5B could inhibit cancer cell proliferation and lead to mitochondrial dysfunction. It is very interesting to understand whether those phenomena are tumor specific. In our study, we found that knockdown of COX5B in MCF10A (breast epithelial cell) can slightly inhibit cell proliferation and elevated the expression of IL-8. However, loss of COX5B in MCF10A only made a little decrease in depolarization of MMP (25 folds change in MDA-MB-468 vs 1.7 in MCF10A) and didn’t alter the production of ROS (9.5 folds change in MCF7 vs 1.15 in MCF10A). Those results suggested that breast cancer cell was more sensitive to COX5B depletion than MCF10A cells (Figure S5).
In summary, we identified that COX5B was upregulated in breast cancer tissue and cell lines, which was associated with poor prognosis. Furthermore, loss of COX5B inhibited proliferation and induced the senescence and SASP. The mechanisms might be associated with mitochondrial dysfunction with increased ROS production and decreased MMP and metabolism disorder. However, the precise mechanism remained unclear and needed to be further explored. Indeed, loss of COX5B may have different functions on target cells and the surrounding environment. These findings may provide a new perspective for combined treatment of anti-cancer agents with inflammation inhibitors such as IL-8 blockers for breast cancer patients.
Materials and Methods
Cell culture and breast tumor specimens
HEK-293T and the breast cancer cell lines MDA-MB-231, MDA-MB-468, and MCF-7 were obtained from the American Type Culture Collection (ATCC) and maintained under conditions specified by the provider. The 16N (mammary epithelial) and NT (breast tumor) cells were separated from a patient with breast cancer. All cells were cultured in a 5% CO2 incubator at 37°C.
Human breast cancers specimens were obtained from patients undergoing surgery for breast cancer at the Shanghai Cancer Center. All patients provided written informed consent and the study was approved by the Ethics Committee of the Cancer center of Fudan University
shRNA transfection and virus packaging
The sh-COX5B and sh-NC (blank vector) plasmids were purchased by GeneChem (GeneChem). The target sequences were as follows: 5’-CTGGGTTGGAGAGGGAGAT-3’(sh-COX5B#1); 5’-GCTGTGGAGCCCATTACAA-3’ (sh-COX5B#2). The plasmids were transfected into 293T cells using Lipofectamine 2000 (Invitrogen) according to the manufacturer’s instructions. Virus-containing medium was collected 48 h after the transfection of 293T cells and added to the cancer cells.
RNA isolation and Real-time PCR.
Total RNA was purified using TRIzol Reagent (Invitrogen Life Technologies). Equivalent amounts of cDNA were synthesized for each sample using Reverse Transcriptase Reagents (TakaRa) according to manufacturer’s instructions. Real-time PCR was performed on an ABI Prism 7900HT detection system using the Premix ExTaq perfect real-time system (TakaRa) with gene-specific primer pairs. Quantitation was performed using the ΔΔCt method, and GAPDH expression used as an internal reference. Each sample was given in three replicates. All used primer sequences were shown in Supplementary Table 1.
Protein extraction and Western blot analysis
Whole-cell lysates were obtained using Pierce T-PER (Tissue Protein Extraction Reagent; Thermo Fisher Scientific Inc.), which contained protease inhibitor cocktail tablets (Roche). In total, 30 µg of the cell lysate was subjected to SDS-PAGE and transferred to PVDF membranes (Pall). The membranes were blocked in 5% milk for 1 h and then washed with Tris-Buffered Saline (TBS) containing 0.1% Tween-20 and incubated with primary antibodies within 2 h (COX5B 1:1000, GAPDH 1:3000, protein tech), followed by incubation with HRP-conjugated secondary antibodies for 1 h. The immunoreactive bands were identified using enhanced chemiluminescence.
Cell proliferation
Cell viability was determined using Cell Counting Kit-8 (Sigma-Aldrich). The cells were seeded on 96-well plates at a density of 2 × 10³ cells/well and then every 24 h incubated with CCK-8 agent for 3 h at 37°C for 7 days. The cell viability signal was detected at 450 nm using a microplate reader (Tecan Sunrise, Switzerland).
β-galactosidase staining
The cells were stained using a cellular senescence β-galactosidase staining kit (Beyotime) strictly according to the manufacturer’s recommendation. The blue stained cells were detected every 2 h for 12 h. At least 5 representative fields were randomly selected to quantitate the percentage of SA-β-gal-positive cells.
Cell migration assays
Cells (5 × 10⁴) were plated in the top chamber of transwell chambers (BD Biosciences) in media without FBS. Medium with 20% FBS was used as a chemoattractant in the lower chamber. The cells were incubated for 15-20 h, then removed the cells that did not migrate. The cells on the lower surface of the membrane were stained with methanol and 0.25% crystal violet and five fields of each membrane should be counted for each sample.
As for conditioned transwell, cells (3 × 10⁵) were seeded in 6-well plate. After cell adherence overnight, the cells were washed three times with PBS and refreshed with 1.2 ml FBS-free DMEM culture medium for 36 h. The supernatant of each sample was collected and added in lower chamber as attractants, cell suspension solution without FBS was placed in upper chamber. The remaining steps were in line with above.
ATP assay
Cells were harvested, washed, and lysed in ATP buffer. The ATP standard solutions and samples were added to a 96-well plate involving several other agents according to ATP assay kit (BioVision). Then all wells were incubated for 30 min and measured at 570 nm by a microplate reader (Tecan Sunrise)
Mitochondrial ROS determination
Cells (5 × 10⁵) were harvested, washed and resuspended in (Invitrogen Corp.) working solution with 5 μM MitoSOX for 15 min at 37 °C. After centrifuging, cells were resuspended in 500 μL PBS and analyzed for mitochondria ROS production by flow cytometry (BD Biosciences).
Mitochondria membrane potential (MMP)
Cells of 106 were washed, resuspended and incubated at 37 °C for 15 min using MMP detection kit (Yisheng). Cells were analyzed using a BD FACS flow cytometer. Loss of mitochondrial ΔΨm is presented as the relative ratio of green to red fluorescence.
Glucose uptake assay
The cells were seeded at a density of 2 × 10⁴ cells/well in 96-well black, clear bottom plate (Corning) and disposed by Glucose Uptake Cell-Based Assay Kit (Cayman) according to the manufacturer’s operations. Cells were measured using a plate reader (excitation/emission=485 nm/535 nm).
Lactate production assay.
A total of 3 × 10⁵ cells were cultured in a 6-well plate for 72 h. Supernatant was collected and was deproteinized due to high LDH content. Supernatant was collected and measured by lactate assay kit from BioVision (Mountain View).
ELISA
Supernatants from sh-COX5B or sh-NC cells were collected respectively and centrifuged at 400 × g for 5 min at 4°C, then performed using human IL-8 ELISA kit (Neobioscience) following the manufacturer’s instructions. The absorbance was finally monitored at 450 nm microplate reader.
Transcriptome Microarray Analysis
Total RNA was submitted to Bioassay Laboratory of CapitalBio Corporation (CapitalBio) for gene expression profiling using the Agilent Human Gene Expression. Candidate genes were defined as 2.0 folds expression change.
In vivo tumor metastasis assay
MDA-MB-231 cells treated with sh-NC or sh-COX5B virus were suspended in PBS to an appropriate concentration (2 × 10 6 cells/mL) and mice were injected with 0.2 mL cell suspension via the tail vein (6 mice/group). After about 2 months, the mice were sacrificed and the lungs were removed and fixed in 4% paraformaldehyde in phosphate-buffered saline overnight and subsequently embedded in paraffin wax. Sections were cut at a thickness of 4 μm and stained with hematoxylin and eosin for histological analysis. The number of tumor metastatic nodules was counted under a dissecting microscope.
Immunohistochemistry
The tumors were dewaxed, hydrated, and the endogenous peroxidase activity was quenched. After antigen retrieval, the tissue were blocked and incubated with primary antibody and secondary antibody. Staining was visualized using colorimetric detection with 3, 3-diaminobenzidine. For semi-quantitative classes were used to describe staining intensity (1, weak; 2, moderate; and 3, intense) and the staining distribution was determined a value from 0 to 4 as follows: 0, <5%; 1, 5%-25%; 2, 25%-50%; 3, 50%-75%; and 4, >75%. The staining distribution and the staining intensity were multiplied for each case. Tissues with an immunohistochemical score of 3 or less were considered to have low expression, and those with a score of 4 to 12 were considered to have high expression.
Kaplan-Meier plotter analysis
The Kaplan-Meier survival analysis was performed as previously descripted. COX5B disease-free survival curve were analyzed by probe 202343_x_at.
Statistical analysis
The means ± the standard deviation (S.D.) were calculated and presented for each data point. Statistical analyses were performed using a paired Student’s t test. For all experiments, P values < 0.05 were considered statistically significant.
Acknowledgments
This work was supported by the grants from National Natural Science Foundation of China (81472669 and 81272923), Program for New Century Excellent Talents in University (NCET-12-0127).
Conflicts of interest
The authors declare no conflicts of interest.
References
1. Jemal A, Bray F, Center MM, Ferlay J, Ward E and Forman D. Global cancer statistics. CA Cancer J Clin. 2011; 61:69-90.
2. Eccles SA and Welch DR. Metastasis: recent discoveries and novel treatment strategies. Lancet. 2007; 369:1742-1757.
3. McBride HM, Neuspiel M and Wasiak S. Mitochondria: more than just a powerhouse. Curr Biol. 2006; 16:R551-560.
4. Ames BN, Shigenaga MK and Hagen TM. Oxidants, antioxidants, and the degenerative diseases of aging. Proc Natl Acad Sci U S A. 1993; 90:7915-7922.
5. Gogvadze V, Orrenius S and Zhivotovsky B. Mitochondria in cancer cells: what is so special about them? Trends Cell Biol. 2008; 18:165-173.
6. Schieber M and Chandel NS. ROS function in redox signaling and oxidative stress. Curr Biol. 2014; 24:R453-462.
7. Gorrini C, Harris IS and Mak TW. Modulation of oxidative stress as an anticancer strategy. Nat Rev Drug Discov. 2013; 12:931-947.
8. Heerdt BG, Houston MA and Augenlicht LH. The intrinsic mitochondrial membrane potential of colonic carcinoma cells is linked to the probability of tumor progression. Cancer Res. 2005; 65:9861-9867.
9. Hanahan D and Weinberg RA. Hallmarks of cancer: the next generation. Cell. 2011; 144:646-674.
10. Gatenby RA and Gillies RJ. Why do cancers have high aerobic glycolysis? Nat Rev Cancer. 2004; 4:891-899.
11. Ferreira LM. Cancer metabolism: the Warburg effect today. Exp Mol Pathol. 2010; 89:372-380.
12. Andreyev AY, Kushnareva YE and Starkov AA. Mitochondrial metabolism of reactive oxygen species. Biochemistry (Mosc). 2005; 70:200-214.
13. Calvo SE and Mootha VK. The mitochondrial proteome and human disease. Annu Rev Genomics Hum Genet. 2010; 11:25-44.
14. Chan HL, Gharbi S, Gaffney PR, Cramer R, Waterfield MD and Timms JF. Proteomic analysis of redox- and ErbB2-dependent changes in mammary luminal epithelial cells using cysteine- and lysine-labelling two-dimensional difference gel electrophoresis. Proteomics. 2005; 5:2908-2926.
15. Chan HL, Sinclair J and Timms JF. Proteomic analysis of redox-dependent changes using cysteine-labeling 2D DIGE. Methods Mol Biol. 2012; 854:113-128.
16. Xu X, Qiao M, Zhang Y, Jiang Y, Wei P, Yao J, Gu B, Wang Y, Lu J, Wang Z, Tang Z, Sun Y, Wu W, et al. Quantitative proteomics study of breast cancer cell lines isolated from a single patient: discovery of TIMM17A as a marker for breast cancer. Proteomics. 2010; 10:1374-1390.
17. Galati D, Srinivasan S, Raza H, Prabu SK, Hardy M, Chandran K, Lopez M, Kalyanaraman B and Avadhani NG. Role of nuclear-encoded subunit Vb in the assembly and stability of cytochrome c oxidase complex: implications in mitochondrial dysfunction and ROS production. Biochem J. 2009; 420:439-449.
18. Yu Z, Schmaltz RM, Bozeman TC, Paul R, Rishel MJ, Tsosie KS and Hecht SM. Selective tumor cell targeting by the disaccharide moiety of bleomycin. J Am Chem Soc. 2013; 135:2883-2886.
19. Chen YW, Chou HC, Lyu PC, Yin HS, Huang FL, Chang WS, Fan CY, Tu IF, Lai TC, Lin ST, Lu YC, Wu CL, Huang SH, et al. Mitochondrial proteomics analysis of tumorigenic and metastatic breast cancer markers. Funct Integr Genomics. 2011; 11:225-239.
20. Herrmann PC, Gillespie JW, Charboneau L, Bichsel VE, Paweletz CP, Calvert VS, Kohn EC, Emmert-Buck MR, Liotta LA and Petricoin EF, 3rd. Mitochondrial proteome: altered cytochrome c oxidase subunit levels in prostate cancer. Proteomics. 2003; 3:1801-1810.
21. Dang C, Gottschling M, Manning K, O’Currain E, Schneider S, Sterry W, Stockfleth E and Nindl I. Identification of dysregulated genes in cutaneous squamous cell carcinoma. Oncol Rep. 2006; 16:513-519.
22. Passos JF, Saretzki G and von Zglinicki T. DNA damage in telomeres and mitochondria during cellular senescence: is there a connection? Nucleic Acids Res. 2007; 35:7505-7513.
23. Wellen KE, Hatzivassiliou G, Sachdeva UM, Bui TV, Cross JR and Thompson CB. ATP-citrate lyase links cellular metabolism to histone acetylation. Science. 2009; 324:1076-1080.
24. Kaelin WG, Jr. and McKnight SL. Influence of metabolism on epigenetics and disease. Cell. 2013; 153:56-69.
25. Kaplon J, Zheng L, Meissl K, Chaneton B, Selivanov VA, Mackay G, van der Burg SH, Verdegaal EM, Cascante M, Shlomi T, Gottlieb E and Peeper DS. A key role for mitochondrial gatekeeper pyruvate dehydrogenase in oncogene-induced senescence. Nature. 2013; 498:109-112.
26. Kondoh H, Lleonart ME, Gil J, Wang J, Degan P, Peters G, Martinez D, Carnero A and Beach D. Glycolytic enzymes can modulate cellular life span. Cancer Res. 2005; 65:177-185.
27. Dorr JR, Yu Y, Milanovic M, Beuster G, Zasada C, Dabritz JH, Lisec J, Lenze D, Gerhardt A, Schleicher K, Kratzat S, Purfurst B, Walenta S, et al. Synthetic lethal metabolic targeting of cellular senescence in cancer therapy. Nature. 2013; 501:421-425.
28. Quail DF and Joyce JA. Microenvironmental regulation of tumor progression and metastasis. Nat Med. 2013; 19:1423-1437.
29. Benoy IH, Salgado R, Van Dam P, Geboers K, Van Marck E, Scharpe S, Vermeulen PB and Dirix LY. Increased serum interleukin-8 in patients with early and metastatic breast cancer correlates with early dissemination and survival. Clin Cancer Res. 2004; 10:7157-7162.
30. Zakrzewska I, Kozlowski L and Wojtukiewicz M. [Value of interleukin-8 determination in diagnosis of benign and malignant breast tumor]. Pol Merkur Lekarski. 2002; 13:302-304.
31. Basu D, Reyes-Mugica M and Rebbaa A. Role of the beta catenin destruction complex in mediating chemotherapy-induced senescence-associated secretory phenotype. PLoS One. 2012; 7:e52188.
32. Yu YC, Yang PM, Chuah QY, Huang YH, Peng CW, Lee YJ and Chiu SJ. Radiation-induced senescence in securin-deficient cancer cells promotes cell invasion involving the IL-6/STAT3 and PDGF-BB/PDGFR pathways. Sci Rep. 2013; 3:1675.
33. Miyake M, Lawton A, Goodison S, Urquidi V and Rosser CJ. Chemokine (C-X-C motif) ligand 1 (CXCL1) protein expression is increased in high-grade prostate cancer. Pathol Res Pract. 2014; 210:74-78.
34. Wei ZW, Xia GK, Wu Y, Chen W, Xiang Z, Schwarz RE, Brekken RA, Awasthi N, He YL and Zhang CH. CXCL1 promotes tumor growth through VEGF pathway activation and is associated with inferior survival in gastric cancer. Cancer Lett. 2015; 359:335-343.
35. Zhao Y, Sun X, Nie X, Sun L, Tang TS, Chen D and Sun Q. COX5B regulates MAVS-mediated antiviral signaling through interaction with ATG5 and repressing ROS production. PLoS Pathog. 2012; 8:e1003086.