
Introduction
Head and neck squamous cell carcinomas (HNSCC) arise from the epithelium of the upper digestive tract, including the oral cavity, the pharynx and the larynx. With over 600,000 new cases diagnosed each year, HNSCC is the 6th most frequent malignancy in the world. Tobacco and alcohol are two important risk factors responsible for 72% of HNSCC cases [1]. Human papilloma virus (HPV) was recently shown as a causative agent for 26% of HNSCC [2]. In the absence of suitable biomarkers, therapeutic decisions are based on tumor localization and TNM staging (evaluation of tumor size (T), lymph node involvement (N) and the presence of distant metastases (M)). However, lesions with similar pathological features can differ in clinical outcome. Despite advances in the understanding of the molecular features of HNSCC along with improved treatments, the survival rate has been unchanged in the past 30 years. Lymph node metastasis (LNM) detected in 50% of patients at the time of diagnosis and distant metastases observed in about 20-30% of patients 2 years after the treatment of the primary tumor account for such persistent bad prognosis. The 5-year survival rate is 54% for patient with LNM and 32% for patients with distant metastasis [3]. Chemoradiation regimens have become a standard of care for the management of locally advanced HNSCC (for review [4] and references therein). However, the prognosis of recurrent/metastatic HNSCC remains poor, and few therapeutic options are available. Induction chemotherapy followed by chemoradiotherapy has been shown to have a benefit in the reduction of distant metastasis [5]. However, the therapeutic index (efficacy vs. toxicity ratio) of these protocols is poor. Thus, the identification of molecular prognostic biomarkers and potential alternative drug targets should help to guide therapeutic choices and identify patients who will most benefit from innovative therapeutic approaches and avoid aggressive treatments. To identify prognostic HNSCC molecular subgroups and potential biomarkers, we have recently conducted genome-wide integrated analysis of four omic data sets [6]. The integrated analysis of 3 omics (methylome, transcriptome and miRNome) uncovered a common robust subgroup of patients, called “R1”, which is characterized by high propensity for rapid distant metastasis. The way tumor cells interact with and modify their environment is a key issue in the acquisition of metastatic properties. In accordance, “R1” tumors are characterized by alterations of pathways involved in cell-cell adhesion, extracellular matrix (ECM), epithelial-to-mesenchymal transition (EMT), immune response and apoptosis [6]. Similarly, alterations of genes controlling adhesion, motility and invasiveness especially integrins were reported as the major molecular differences among metastatic and non-metastatic HNSCC tumors [7-9].
We previously reported that stronger adhesion, motility and invasiveness can be observed in glioblastoma expressing high levels of α5β1 integrins induced by the disappearance of Cav1 from cells [10, 11]. Subclassification of patients according to α5β1 integrins/Cav1 levels showed the existence of a cluster of patients exerting low Cav1/high α5β1 integrins levels [11] which was correlated with reduced overall survival [12]. Cav1 is the principal structural protein of caveolae able to control the subcellular distribution, activity and expression of molecules and receptors [13, 14]. Cav1 regulates therefore multiple cancer-associated processes including cellular transformation, tumor growth, cell migration and metastasis, cell death and survival, multidrug resistance and angiogenesis [15, 16]. Up-regulation of Cav1 is associated with metastatic disease progression of various cancers and appears therefore as a good promoter of tumor dissemination [17, 18, 19, 20]. In contrast, reduced expression of Cav1 was observed in HNSCC LNM [21, 22], correlates with breast cancer nodal metastasis [23] and is prometastatic in malignant melanoma [24]. Downregulation of Cav1 induced EMT and enhanced tumor cell invasion in various cancer cell lines [25].
We therefore addressed the role of Cav1 in the regulation of HNSCC metastasis in the metastatic-prone “R1” and the non metastatic prone “non-R1” subgroups and investigated the molecular mechanisms underlying the acquisition of the metastatic phenotype.
Results
Cav1 expression is reduced in prometastatic tissue
Analysis of Cav1 expression using a real-time qRT-PCR approach on RNA extracts from fresh-frozen tumours confirmed a strong and significant decrease of Cav1 expression in “R1” patients as compared to “non-R1” tumours (Figure 1A). Downregulation of Cav1 was further confirmed by immunohistochemical (IHC) analysis in the corresponding formalin fixed paraffin embedded (FFPE) tissues (Figure 1B). “Non-R1” tumors expressed Cav1 both at the plasma membrane and in the cytosol, with variable staining intensity. Cav1 staining was found to be largely weaker in “R1” tumour specimen. A semi-quantitative analysis of IHC staining was performed and tumours were classified in 4 categories according to the percentage of Cav1-positive carcinoma cells: 0%; 1-25%; 26-75%; > 75%. A majority of “non-R1” specimens showed > 75% of Cav1-positive cells, whereas no “R1” tumours belonged to that later category. This differences were found to be statistically significant (Figure 1B, χ2 test p = 0,007). Patients were stratified according to the Cav1 gene expression (see suppl. material and methods for cut-off value determination), and a Kaplan-Meier analysis of the distant metastasis-free survival (MFS) and of the overall survival (OS) were performed. Cav1 was found to have a prognosis value, since low caveolin expression correlated to adverse prognosis (shorter time to metastasis; p < 0.001; Figure 1C) and reduced OS (p < 0.005; Figure 1D).
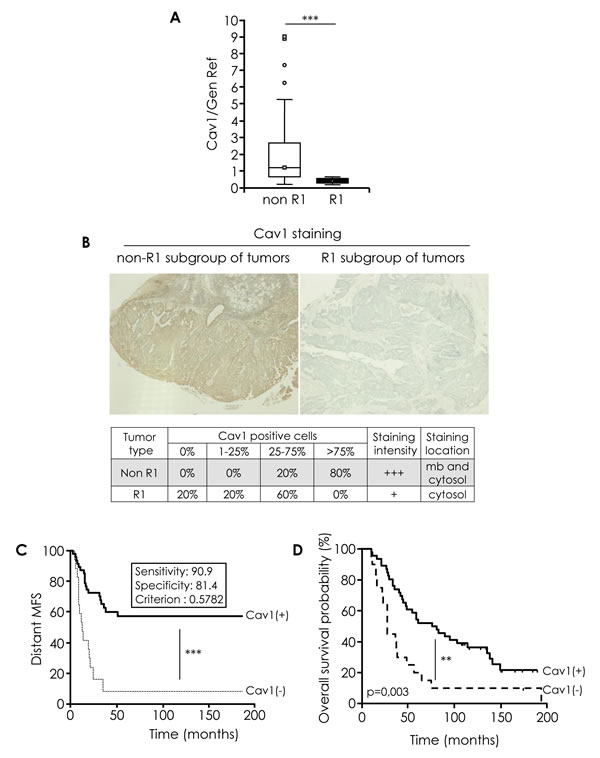
Figure 1: Cav1 expression in human HNSCC tissue specimens. A. Quantified analysis of CAV1 transcripts determined in 11 primary tumor samples of patients that developed metastasis (“R1”) and 57 primary tumor samples of patients that did not developed metastasis (“non-R1”). The line within the bar represents the mean value and “ᴏ” represent individual data point. (***p < 0.001). B. Immunohistochemical analysis of Cav1 in R1 and non-R1 FFPE tissus (original magnification: X100). Table show % of non-R1 and R1 tumors with 0%, 1-25%, 25-75% and >75% Cav1-positive cells. C. Kaplan-Meier analysis of the distant metastasis-free survival (MFS) in patients stratified according Cav1 gene expression (CAV1(+) and CAV1 (-)). A cut-off value was determined for Cav1 gene expression (measured by qRT-PCR), corresponding to a 90.1% sensitivity and a 81.4% specificity with respect to the “R1” status (i.e. 90.1% of the “R1” lesions display a Cav1 expression level below this cut-off, and 81.4% of the “non-R1” tumours express Cav1 levels above this cut-off. More detail in suppl. material and methods). Samples were considered as Cav1-negative is the qRT-PCR value was ≤ to the cut-off. Shorter time to metastasis ***p < 0.001). D. Kaplan-Meier analysis of the overall survival (OS) in patients stratified according Cav1 gene expression (CAV1(+) and CAV1 (-)) as described in Fig 1C. Shorter time to death, **p = 0.003) .
Low Cav1 expression increases cell motility and invasion
In order to evaluate the impact of the deregulation of Cav1 expression on the propensity of tumour cells to form distant metastasis, we generated a cell line expressing low level Cav1 and performed functional analysis (shRNAcav1-SCC9, Figure 2A). Migration was analyzed in single and collective cell migration assays. Individual cell migration was examined by live cell imaging in low density cell cultures (Figure 2B). Cell tracking measurements revealed that shRNAcav1-cells have a more persistent migration and a significant increase in the speed and velocity of migration than their control counterparts (Figure 2B). In other terms SCC9-shRNAcav1 explored larger areas than control cells. Consequences of Cav1 reduction were also determined in a collective 3D cell migration model using SCC9 spheroid. SCC9-shRNActrl poorly migrated out of the spheres on plastic or fibronectin (FN)-coated dishes but strongly on collagen-coated dishes (Figure 2C). Independently of the matrix used, shRNAcav1-cells migrated out of aggregates more efficiently and covered an area significantly more important than control cells (Figure 2C). Data suggested that although collagen promoted strong evasion of cells, removal of Cav1 not only reinforced the process on collagen but also conferred cells the capacity to efficiently and significantly evade on a new matrix, FN. A strong secretion of FN into the extracellular environment was observed by microscopy in shRNAcav1-cells although no increased expression of FN was detected at the RNA and protein levels (Figure 2D).
To ascertain the role of Cav1 in the migration of HNSCC through 3D matrixes, matrigel® invasion assays were performed. shRNAcav1-cells navigated through matrigel® more efficiently than their control counterpart (Figure 2E). As invasion requires the degradation of underlying basement membrane, expression of matrix metalloproteases (MMPs) was analyzed. The reduction of Cav1 expression was associated with the apparition of an active cleaved MMP2 and a significant decrease of pro-MT1-MMP and pro-MMP9 (suggesting the activation of those MMP) in shRNAcav1-cells compared to control cells (Figure 2F). MT1-MMP transcript was significantly increased in shRNAcav1-cells (Figure 2F right panel). Altogether data showed that extinction of Cav1 in HNSCC resulted in enhanced migratory capacity and invasiveness.
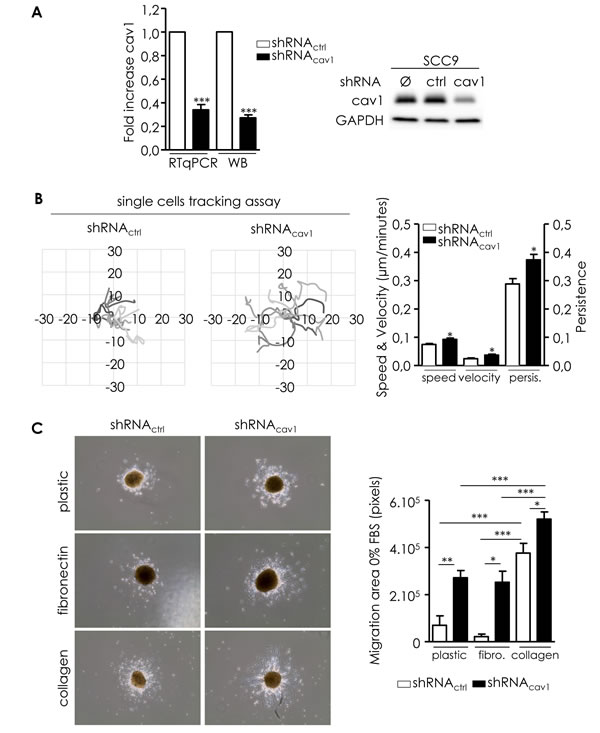
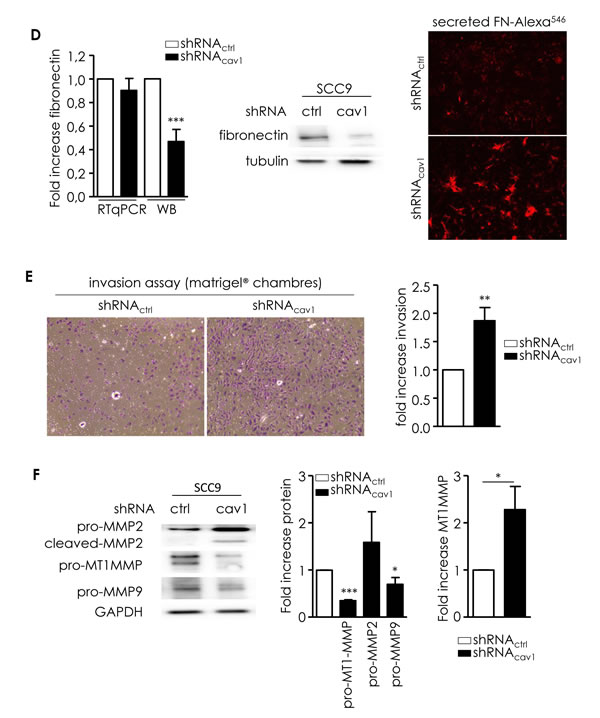
Figure 2: Reduction of Cav1 enables cells motile and invasive properties. A. Quantitative determination of transcripts and protein expression of Cav1 in shRNActrl- or shRNAcav1-SCC9 cells using qRT-PCR with RNA18S as control and western blot using GAPDH as a loading control. Each bar represents the mean±SEM with ***p < 0.001. B. Analysis of single cell migration of shRNActrl- and shRNAcav1-transfected SCC9. Diagrams represent the migrating trajectories of cells covered during 6 hours by ten representative shRNActrl and shRNAcav1-transfected SCC9. Each bar represents the mean±SEM of the speed, the velocity and the persistence recorded during 6 hours for each cell type (n = 4, *p < 0.05). C. Analysis of collective cell migration of shRNActrl- and shRNAcav1-transfected SCC9. Phase contrast images showing the evasion of shRNActrl- and shRNAcav1-transfected SCC9 from spheroids after 12 hours growth on plastic-, fibronectin- or collagen-coated cells. Each bar represents the mean±SEM area covered by cells evading from the spheroid (n = 7-9, *p < 0.05, **p < 0.01 and ***p < 0.001). D. Left panel: quantitative determination of transcripts and protein expression of fibronectin in shRNActrl- or shRNAcav1-SCC9 cells using qRT-PCR with RNA18S as control and western blot using tubulin as a loading control. Each bar represents the mean±SEM with ***p < 0.001, n = 8. Right panel: immunofluorescence analysis of extracellular secreted fibronectin by shRNActrl- or shRNAcav1-SCC9 cells. Images were taken at 4x magnification with an AXIO Zeiss microscope. E. Phase contrast images showing the invasion of shRNActrl- and shRNAcav1-transfected SCC9 through BioCoat Matrigel® invasion chambers. Cells were stained with crystal violet after 22 hours invasion. Each bar represents the mean±SEM fold increase in invasion (n = 6, **p < 0.01). F. MMPs protein levels were analyzed by western blot analysis using GAPDH as a loading control. Each bar represents the mean±SEM with *p < 0.05 and ***p < 0.001. MT1-MMP was analyzed in shRNActrl- or shRNAcav1-SCC9 cells using qRT-PCR with RNA18S as control. Each bar represents the mean±SEM with *p < 0.05, n = 4.
Low Cav1 expression induces the expression of specific integrins required for efficient migration and invasion
Acquisition of invasiveness is crucial for metastatic dissemination. Invasion requires the modulation of cell-ECM adhesions mainly dependent on integrins. We previously reported that depletion of Cav1 significantly modified the expression of integrins in glioblastoma [10, 11]. shRNAcav1-cells expressed significantly more α2, α5, β1 and β3 integrin subunits than control cells at the RNA and protein level (Figure 3A). α3, α5, α7 and β5 integrin subunits were not significantly altered (Figure 3A). αv integrin subunit was increased at the RNA level but decreased discreetly at the protein level in shRNAcav1 versus shRNActrl (Figure 3A). Data suggested that two integrins were strongly increased following extinction of Cav1, α2β1 and α5β1 integrins. Those integrins were probably involved in the increase of cell migration on collagen and FN.
We ought to determine if resulting increased motile and invasive capabilities are dependent on those integrins. Cell tracking measurements revealed that compound 1, an antagonist of α5β1 integrin, totally abolished the increased speed of migration observed in shRNAcav1-cells without affecting basal migration of control cells (Figure 3B). Compound 1 did not affect velocity or persistence of cells as previously reported (Figure 3B, [26]). Data suggested that α5β1 integrin might be the integrin responsible for acquired motility of shRNAcav1-cells.
Consequences of α5β1 integrin inhibition (using an antibody blocking selectively the β1 integrin subunits and compound 1) were also determined in the collective cell migration model. Although migration of SCC9-shRNActrl was not significantly altered by any drugs on FN-coated plates, evasion of SCC9-shRNAcav1 cells was abolished by the β1 antibody and by compound 1 (Figure 3C, left). Evasion of both cell lines was abolished by the β1 antibody but not compound 1 on collagen-coated plates (Figure 3C, middle). The involvement of α2β1 integrin in the increased motility of cells on collagen was determined after silencing α2β1 integrin (siRNAα2 versus siRNActrl, suppl. data 1). In contrast with K34c that only affected the evasion of SCC9-shRNAcav1 on FN, silencing α2β1 integrin reduced the evasion of both SCC9-shRNActrl (by 31.5%) and SCC9-shRNAcav1 (by 52.9%, Figure 3C, right). The increase of cell migration observed in SCC9-shRNAcav1 cells on both collagen and FN are linked to the increase of α2β1 and α5β1 integrin expression.
Blocking α5β1 integrin with another non peptidic α5β1 integrin antagonist, K34c, also totally abolished the invasive capacity of shRNAcav1-cells in 3D matrigel® invasion assays (Figure 3D). K34c remained without effect on basal invasion of control cells. Silencing α5 integrin subunits or inhibiting α5β1 integrin using K34c did not affect either basal levels of MT1-MMP or MT1-MMP-induced expression in shRNAcav1-cells suggesting that the induction of MMPs was driven by Cav1 independently of integrins activation (Figure 3E). Data suggested that the extinction of Cav1 in HNSCC resulted in enhanced migratory capacity and invasiveness that is dependent of α5β1 integrin.
To ascertain that the alteration of α5β1 integrin expression observed following depletion of Cav1 had clinical significance, we performed IHC analysis in the corresponding FFPE tissues. “Non-R1” tumors which expressed Cav1 showed no or weak α5 integrin subunit expression. “R1” tumours specimen which express weak or no Cav1 exert α5 integrin subunit staining confirming in vitro data (Figure 3F).
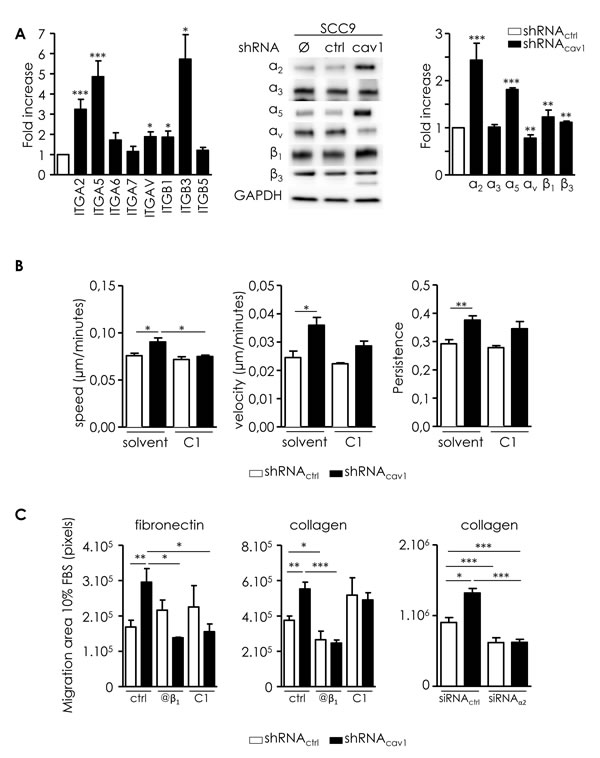
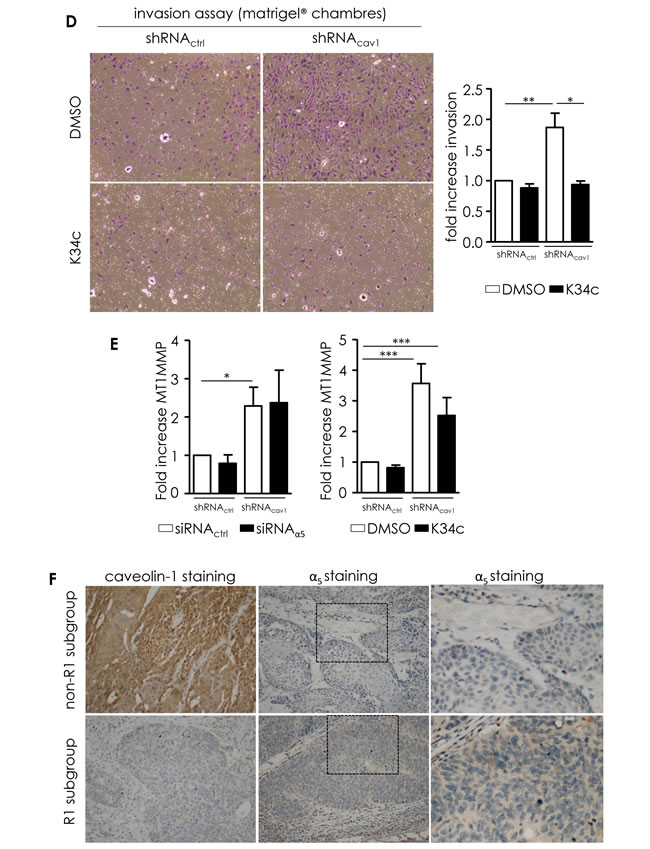
Figure 3: Integrins are involved in the motile and invasive properties of low Cav1 expressing cells. A. Left panel: quantitative determination of transcripts expression of integrins (α2, α5, α6, α7, αv, β1, β3, β5 integrin subunits) in shRNActrl- or shRNAcav1-SCC9 cells using qRT-PCR with RNA18S as control. Each bar represents the mean±SEM with *p < 0.05, and ***p < 0.001. Right panel: integrin subunit protein levels (α2, α3, α5, αv, β1 and β3 integrin subunits) were analyzed by western blot analysis using GAPDH as a loading control. Each bar represents the mean±SEM with **p < 0.01 and ***p < 0.001. B. Analysis of single cell migration of shRNActrl- and shRNAcav1-transfected SCC9. Migrating trajectories of shRNActrl- and shRNAcav1-transfected SCC9 exposed to solvent or to a specific α5β1 integrin antagonist component 1 (C1, 20µmol/L) were recorded during 6 hours. Each bar represents the mean±SEM of the speed, the velocity and the persistence recorded during 6h for each cell type (n = 3-5, *p < 0.05 and **p < 0.01). C. Analysis of collective cell migration of shRNActrl and shRNAcav1-transfected SCC9. Evasion of shRNActrl- and shRNAcav1-transfected SCC9 from spheroids exposed to solvent, to a specific α5β1 integrin antagonist component 1 (C1, 20 µmol/L) and to a β1 integrin specific blocking antibody OS2966 (10 µg/mL) were determined after 12 hours growth on fibronectin- or collagen-coated cells. Evasion of shRNActrl- and shRNAcav1-SCC9 transfected with siRNActrl or siRNAα2 from spheroids were determined after 12 hours growth on collagen-coated cells. Each bar represents the mean±SEM area covered by cells evading from the spheroid (n = 4, *p < 0.05, **p < 0.01 and ***p < 0.001). D. Phase contrast images showing the invasion of shRNActrl- and shRNAcav1-transfected SCC9 exposed to solvent or to a specific α5β1 integrin antagonist K34c (20 µmol/L) through BioCoat Matrigel® invasion chambers. Cells were stained with crystal violet after 22 hours invasion. Each bar represents the mean±SEM fold increase in invasion (n = 4-6, *p < 0.05 and **p < 0.01). E. Quantitative determination of transcripts expression of MT1-MMP in shRNActrl- or shRNAcav1-SCC9 cells transfected with siRNActrl and siRNAα5 integrin subunits or exposed to solvent and K34c (20 µmol/L) using qRT-PCR with RNA18S as control. Each bar represents the mean±SEM with *p < 0.05 and ***p < 0.001. F. Immunohistochemical (IHC) analysis of Cav1 (left panels) and α5 integrin subunit (middle panels) in representative “R1” and “non-R1” FFPE tissues are shown (original magnification: X200). Magnifications of insets shown in middle pictures are shown in the corresponding right panels (original magnification: X400).
Low Cav1 expression forces HNSCC cells to undergo an EMT
Enhanced migration and invasion, increased production of ECM and degradation of underlying basement membrane are multiple biochemical changes of a biological process allowing a polarized epithelial cell to acquire a mesenchymal phenotype so called EMT. Cav1 reduction in SCC9 resulted in a switch from a cuboid epithelial shape to a more fibroblastic appearance (Figure 4A). EMT was associated with a loss of E-cadherin and a reduction of β-catenin expression (Figure 4B). Simultaneously, the mesenchymal marker vimentin was significantly increased (Figure 4B). Analysis of the expression of key transcriptional regulators of EMT showed that shRNAcav1 cells expressed increased level of repressors of E-cadherin expression such as Slug, Snail, Twist, Zeb1 and Zeb2 (Figure 4C). We concluded that the extinction of Cav1 induces HNSCC cells to undergo EMT. We previously showed that the “R1” cluster of patient was characterized by alterations of pathways involved in EMT [6]. In accordance, a significant reduction of E-cadherin expression and an increase of the vimentin/E-cadherin ratio were found in “R1” patients compared to “non-R”1 tumours. In addition, “R1” patients exhibited significantly higher levels of Twist than “non-R1” tumours. Twist expression was found to be anti-correlated with Cav1 expression. Altogether, patient data confirmed in vitro studies showing an induction of EMT in “R1” tumors depleted in Cav1 (Figure 4D). To go further, we silenced both Slug and Twist to determine whether EMT induced by suppression of Cav1 is dependent on both transcription factors. Inhibition of Slug significantly increased SNAIL and TWIST expression in both shRNActrl and shRNAcav1-SCC9 (Figure 4E). We hypothesise that such an increase in EMT markers after Slug inhibition might be due to the repression of Cav1 expression by Slug itself (suppl. data 2). Slug inhibition did not repress the increase of SNAIL, TWIST or ZEB1 in shRNAcav1-SCC9 and did not prevent the disappearance of E-cadherin in shRNAcav1-SCC9. However, Slug inhibition prevented the induction of vimentin in shRNAcav1-SCC9 (Figure 4E). Turning to Twist, its inhibition did not affect Cav1 expression or the increase of Slug, SNAIL, TWIST or ZEB1 in shRNAcav1-SCC9 and did not prevent the disappearance of E-cadherin in shRNAcav1-SCC9 (Figure 4E). Data suggest therefore that Slug contribute to the full transition as the absence of Slug prevents the appearance of the mesenchymal marker vimentin in shRNAcav1-SCC9.
α5β1 integrin was inhibited using K34c to determine its contribution to EMT in shRNAcav1 cells. K34c did not affect basal levels of TWIST, Zeb1 or vimentin but slightly inhibited Slug, Snail and E-cadherin. K34c only affected Slug induction in shRNAcav1-SCC9 cells (Figure 4F). Except for Slug, EMT gene expressions were activated independently of α5β1 integrin upon Cav1 removal.
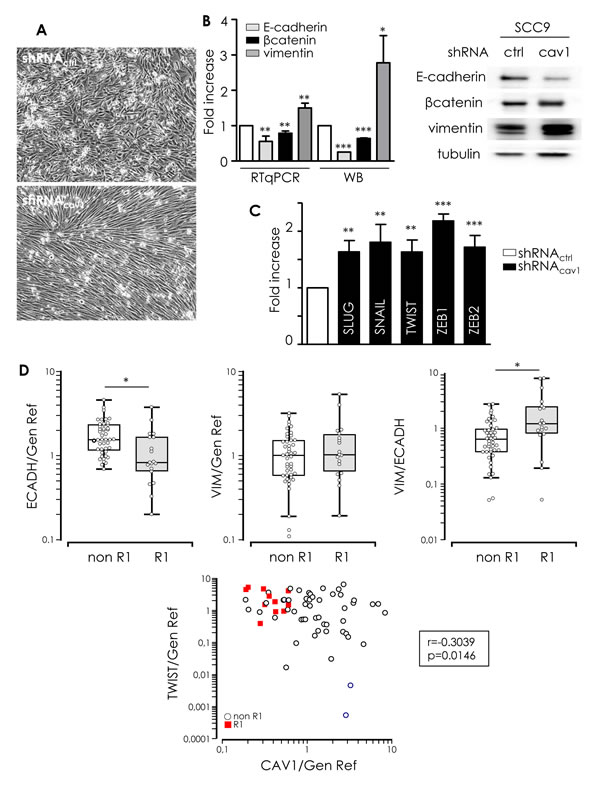
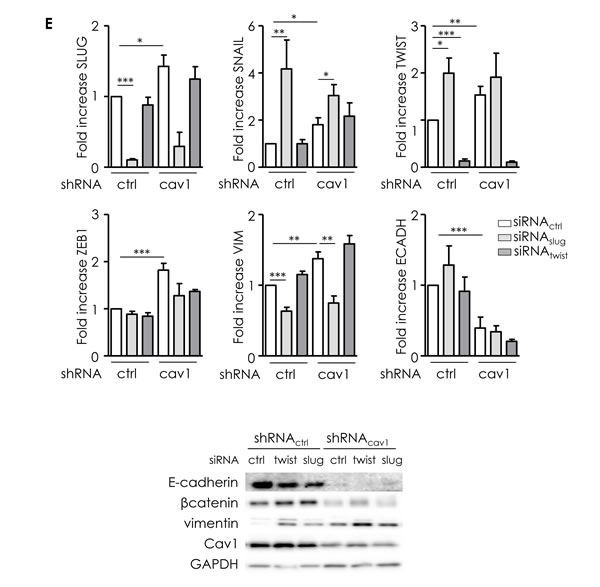
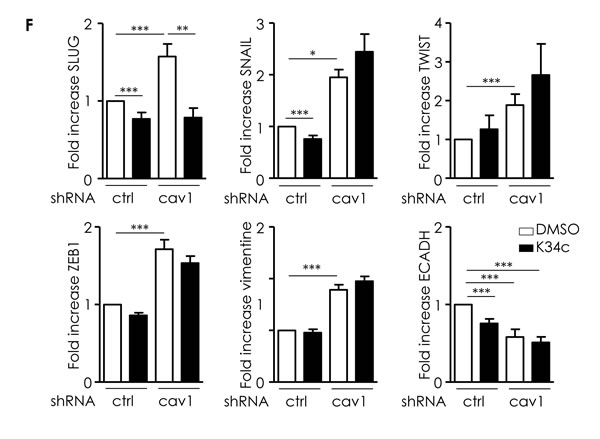
Figure 4: Low Cav1 expressing cells undergo an EMT. A. Phase contrast images of stable SCC9 cells expressing shRNActrl or shRNAcav1 in culture. B. Quantitative determination of transcripts expression of epithelial (E-cadherin and β-catenin) and mesenchymal (vimentin) markers in shRNActrl- or shRNAcav1-SCC9 cells using qRT-PCR with RNA18S as control and western blot using tubulin as a loading control. Each bar represents the mean±SEM with **p < 0.01 and *** < p0.001. C. Quantitative determination of transcripts expression of key regulator of E-cadherin and EMT (including Slug, Snail, Twist, ZEB1 and ZEB2) in shRNActrl- or shRNAcav1-SCC9 cells using qRT-PCR with RNA18S as control. Each bar represents the mean±SEM with **p < 0.01 and ***p < 0.001. D. Quantified analysis of E-cadherin, vimentin, Twist and Cav1 transcripts determined in primary tumor samples of patients that developed metastasis (“R1”) and primary tumor samples of patients that did not developed metastasis (“non-R1”). The line within the bar represents the mean value and “ᴏ” represent individual data point. (***p < 0.001). E. Quantitative determination of transcripts expression of Slug, Snail, Twist, Zeb1, vimentin and E-cadherin in shRNActrl- or shRNAcav1-SCC9 cells transfected by siRNActrl or siRNASLUG or siRNATWIST using qRT-PCR with RNA18S as control. Each bar represents the mean±SEM with *p < 0.05, **p < 0.01 and *** < p0.001. F. Quantitative determination of transcripts expression of Slug, Snail, Twist, Zeb1, vimentin and E-cadherin in shRNActrl- or shRNAcav1-SCC9 cells exposed to DMSO or 20 µmol/L K34c using qRT-PCR with RNA18S as control. Each bar represents the mean±SEM with *p < 0.05, **p < 0.01 and *** < p0.001.
Low Cav1 expression is associated with a reduction of growth and survival capacities partially preserved by α5β1 integrins
Although reduction of Cav1 expression enabled cell invasive properties, one striking phenotype of shRNAcav1-SCC9 cells was a 57% reduction in the growth index of cells (Figure 5A) and a 40% reduction in the number of colonies in a clonogenic assay (Figure 5B). Although shRNAcav1-cells displayed reduced growth and fewer colonies, cells retained their ability to self-renew (right panel of photographs, Figure 5B) allowing maintenance of a population of tumorigenic cells. As α5β1 integrin played a crucial role in the acquisition of proliferative and clonogenic ability of Cav1-depleted glioma cells [10, 11], its role in the reduction of proliferation and clonogenicity observed in HNSCC cells with reduced expression of Cav1 was determined.
Involvement of α5β1 integrin in the growth and colony formation was analyzed using the selective antagonist K34c. K34c by itself did not affect basal proliferation but slightly reduced viability of control cells (Figure 5C). The inhibition of proliferation observed after Cav1 depletion was reduced even further in presence of K34c most probably because under such conditions viability of cells is significantly reduced (Figure 5C). As a consequence, surviving fraction of control cells as well as shRNAcav1 cells exposed to K34c was significantly reduced in clonogenic assays (Figure 5D). Depletion of α2β1 integrins did not affect clonogenic survival by itself and did not improve or worsened that of shRNAcav1-cells (suppl. data 3) suggesting that α5β1 integrins are the main integrins involved in the regulation of growth/survival/clonogenicity of HNSCC cells. Data suggested therefore that the reduction of growth and clonogenicity observed in shRNAcav1-cells was not due to α5β1 integrins. However as the inhibition of α5β1 integrin activity in those cells reduced even further the growth and the survival, α5β1 integrins seems crucial to maintain residual growth and survival of shRNAcav1 cells. To conclude, α5β1 integrins mediate both motile/invasive and survival properties of cells expressing low levels of Cav1.
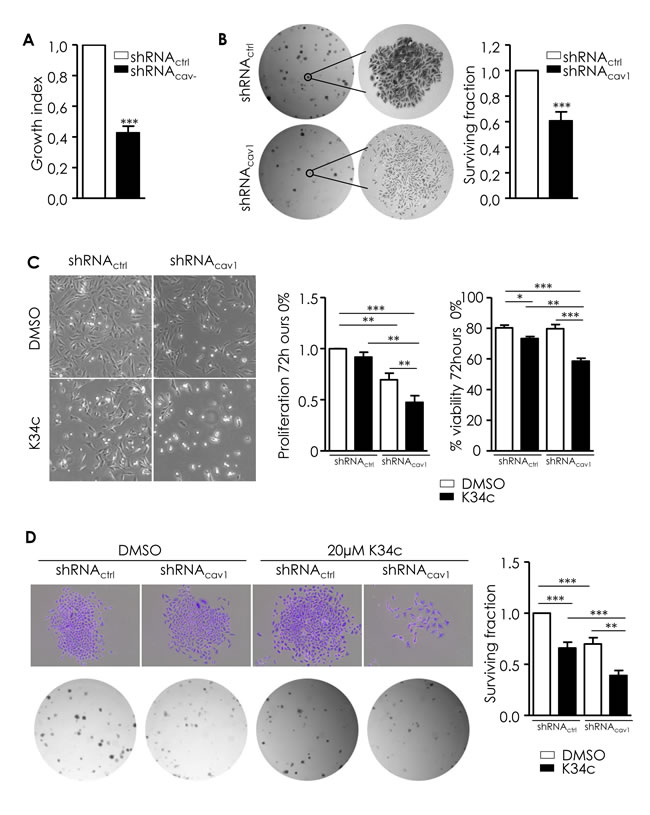
Figure 5: Low Cav1 expression is associated with a reduction of growth and survival capacities partially preserved by α5β1 integrins. A. shRNActrl- and shRNAcav1-transfected SCC9 growth index was analyzed by regular cell counting using the TC20 counter (BioRad). Each bar represents the mean±SEM growth index of shRNAcav1- versus shRNActrl-transfected cells (n = 14, ***p < 0.001). B. ShRNActrl- and shRNAcav1- SCC9 were subjected to a clonogenic assay. Photograph represents phase contrast images of shRNActrl- and shRNAcav1- SCC9 colonies after staining with crystal violet. Each bar represents the mean±SEM surviving fraction of shRNAcav1- versus shRNActrl-transfected cells. Plating efficiency are 0.23±0.02, and 0.17±0.02 for shRNActrl and shRNAcav1-transfected SCC9 respectively (n = 17, ***p < 0.001). C. Phase contrast images of stable shRNActrl or shRNAcav1 SCC9 cells exposed to solvent or 20 µmol/L K34c up to 72 hours in 0% FBS containing medium. Each bar represents the mean±SEM number of cells and the percentage of proliferation and viability after trypan blue staining with *p < 0.05, **p < 0.01 and *** < p0.001. D. Phase contrast images of shRNActrl- and shRNAcav1- SCC9 colonies stained with crystal violet exposed to solvent or 20 µmol/L K34c up to 72 hours in 0% FBS containing medium. After refreshment, cells are allowed to grow 7 days in 10% FBS containing medium. Each bar represents the mean±SEM surviving fraction with **p < 0.01 and *** < p0.001.
Discussion
Therapeutic options for the management of metastatic HNSCC are limited, and the outcome of the patients is poor. Predictive biomarkers of metastatic tumors as well as therapies tied to genetic alterations involved in the metastatic process are urgently needed. Our study showed that the absence or low expression of Cav1 is observed in primary “R1” tumors with high propensity for distant metastasis. To date, only a few studies addressed the role of Cav1 in the metastatic process of HNSCC. However the reported data are inconsistent. Masuelli et al. showed that Cav1 is highly increased in well and poorly differentiated HNSCC and its overexpression was associated with LNM [18]. Increased expression of Cav1 was also observed in HNSCC cell lines selected for their aggressive metastatic phenotype [27]. Silencing Cav1 via lentiviral RNAi miR133a was shown to delay tumor growth in vivo, cell migration and invasion [28, 29]. On the contrary, significant decrease in Cav1 expression was observed in poorly differentiated HNSCC tumors and in LNM tissues of patients [21] without significant differences between primary tumors of patients who did or not have LNM. In an earlier study Zhang et al. reported a similar loss of Cav1 in cell lines generated from LNM tissues [9]. Here, we confirmed that low level of Cav1 correlates with adverse prognosis, reduced distant MFS and OS. We can therefore hypothesize that Cav1 expression is dramatically reduced in metastatic tissue as compared to primary tumour, as reported by Zhang et al. [22], but that this downregulation is also a hallmark of metastasis-prone HNSCC before extension to distant sites. To our knowledge, our study is the first showing rational and clinical evidence that no or low levels of Cav1 expression in primary HNSCC tumors might be predictive of patient with high metastasis risk as well as being of bad prognosis. However, due to a small cohort size and the retrospective nature of our study, our observations must be interpreted with caution. The prognostic power of Cav1 expression requires confirmation in a larger prospective clinical study in newly diagnosed HNSCC patients. IHC is a technique routinely used by pathologists for the diagnosis of solid tumors, we think that IHC staining of Cav1 might be easily translated in the future to the clinic. Patients with high nodal stage (N ≥ 2) tumours are at risk for distant metastasis. Monitoring the expression of Cav1 might be a useful tool for a more reliable evaluation of tumour propensity for metastasis, and to identify patients who could benefit from a new and more personalized medicine. For example, Mercier et al. reported that mTOR inhibitors such as rapamycin prevented tumor growth and increased survival rates in breast cancer patients with decrease stromal Cav1 expression [30]. In addition, our study showed that drugs targeting α5β1 integrins might also be effective in preventing HNSCC metastasis. Here we propose a biomarker that could rationally select specific subpopulation of HNSCC patients that might be responsive to more targeted therapy.
Consistently with patient data, decreased expression of Cav1 in HNSCC cell lines heightened pro-metastatic features reflected by increased migration, enhanced evasion and stronger invasion. Cav1 up-regulation enhanced cell mobility/migration, increased directional motility and invasion in vitro in Ewing’s sarcoma tumors, hepatocellular tumors, lung carcinoma or even HNSCC [16]. In contrast, Cav1 promote proliferation whereas it suppressed migration and invasion of melanoma cells through the inhibition of the integrin/FAK/Src signaling pathway [24]. Silencing Cav1 in glioblastoma endowed cells mobility and invasion mediated by α5β1 integrins [11]. Downregulation of Cav1 induced EMT and enhanced tumor cell migration and invasion in various cancer cell lines [25]. Increased cell motility coupled to reduced growth observed here in HNSCC cells expressing reduced Cav1 expression suggest that Cav1 expression in primary HNSCC might contribute to tumor growth, whereas its loss is a key factor in metastatic progression. Acquisitions of migratory and invasive capacities are main characteristics of cells undergoing an EMT [31, 32]. Interestingly, beside alterations of pathways involved in cell-cell adhesion, ECM, immune response and apoptosis, “R1” tumors are characterized by alterations of the EMT pathway [6]. Cav1 deficiency induces EMT during peritoneal dialysis [33] and in HNSCC [21] as well as EndoMT in pulmonary endothelial cells [34]. In accordance, reduced expression of Cav1 in our model is linked to a loss of the cobblestone epithelial morphology, a switch from epithelial (E-cadherin) to mesenchymal (vimentin) marker expression and the expression of various transcription factors such as Twist, Snail, Slug, ZEB1 and ZEB2 known to orchestrate EMT. Induction of EMT following reduction of Cav1 expression might likely be due to the release of the TGFβ and/or the ERK1/2 pathways which are major inducers of EMT. Both pathways were shown to be activated in glioblastoma [10] and in human peritoneal cells following Cav1 silencing [33].
The way tumor cells interact with and modify their environment is crucial for the metastatic process. Cells undergoing type 3 EMT (carcinoma-metastatic transitions) are characterized by an integrin switch and a change in the extracellular matrix (for review [35]). Reduction of Cav1 expression in our model led to a change in the expression of integrins with the silencing of αv integrins and the induction of α5 and α2 integrins. Although the regulation of α5β1 integrin expression deserves further studies, it is most probable that its overexpression in shRNAcav-1-cells is a consequence of EMT in those cells as inhibition of α5β1 integrin using K34c could not restore EMT markers at the level of control cells in shRNAcav-1-cells. EMT markers such as Zeb2 [36], Twist-AP1 [37] and SNAIL [38] were all described as direct inducers of α5 integrin expression. In addition α5β1 integrin expression was shown to be negatively regulated by E-cadherin [39]. If α5β1 integrins did not drive EMT, they seemed to play a crucial role in the motile and invasive phenotype acquired by cells expressing low level of Cav1 as their ligand FN clearly boosted the evasion of shRNAcav-1-cells out of the tumor spheres in contrast to control cells. Moreover α5β1 integrin inhibition totally prevented shRNAcav-1-cell migration, evasion and invasion. Although αvβ1 and αvβ3 integrins can also bind FN, it is unlikely that these integrins support the metastatic phenotype as the expression of the αv integrin subunit is downregulated. α5β1 integrin was recently shown to have important role in tumor progression [40], metastasis [39] and/or resistance to therapies [41] in various cancers. Its involvement in the metastatic extension of HNSCC was suggested by Wang et al. who showed that FN clearly enhanced the invasive ability of β1 integrin expressing cells [42]. Overexpression of this integrin indicated a very poor prognosis in epithelial ovarian cancer [39] and glioblastoma [12]. In accordance, blocking α5β1 integrin activity using specific antagonist such as K34c and compound 1, used to successfully block this integrin in other model of solid tumors [10-12, 26, 43], strongly impaired single cell migration, evasion and invasion suggesting that α5β1 integrin is the main integrin involved in the motility and invasiveness of shRNAcav-1-cells. As shown in glioblastoma, depletion of Cav1 in HNSCC enhanced α5β1 integrin expression endowing cells with an aggressive phenotype [10, 11]. It is obvious that beside FN, collagen also efficiently promotes evasion out of the tumor mass. However, in primary tumors of metastatic cases of oral squamous cell carcinoma (OSCC), the expression of various ECM molecules such as laminin or collagen is decreased, while the expression of FN is increased when compared with the non-metastatic cases [44]. Anti-α2 blocking antibodies were reported not to affect the invasion of OSCC cells in contrast to those targeting α5 [45]. Coupled to the fact that α5β1 integrin antagonist totally blocked migration, evasion and invasion, data suggest that collagen/α2β1 integrin are not crucial for HNSCC metastasis in contrast to fibronectin/α5β1 integrin that seems to efficiently drive such process. However it remains true that if cells evolve in a collagen-rich environment targeting α2β1 integrins seems an efficient anti-metastasis strategy as evasion of the tumor mass is totally abolished by anti-β1 antibodies as well as by the silencing of the α2 integrin subunit. In addition, α5β1 integrin antagonist K34c significantly altered the viability of shRNAcav-1-cells and to a lesser extent of control cells that lead to a significant reduction of the clonogenic survival and therefore the self renewal capacity of SCC9 cells. Silencing α2β1 integrin has no effect. α5β1 integrin antagonist were previously reported to significantly alter the proliferation of glioblastoma cell lines [43, 46]. Data suggest therefore that α5β1 integrin plays a crucial role in the viability of HNSCC cells. In addition, α5β1 integrin was recently described as a master regulator of anoïkis in hepatocellular cancer [47]. In accordance, preliminary study showed that cells expressing low levels of Cav1 exerted strong resistance to anoïkis (not shown), a prerequisite for systemic circulation and secondary tumor formation in distant organs. Anti-α5β1 integrins therapy might therefore be a new therapeutic option for the “R1” subgroup of patient exerting low levels of Cav1 expression in order to prevent the development of metastasis but also the development of primary “R1” tumours.
In conclusion, our study showed for the first time that primary tumors from patients at high risk of distant metastasis express very low level of Cav1. It also clearly shows that low or no expression of Cav1 correlates with adverse prognosis. Disappearance of Cav1 enables cells to undergo EMT leading to increased motility, evasion and invasion capacities due to increased production of FN, an overexpression of its receptor α5β1 integrin and MMPs. Our study uncovered a new target that might open new therapeutic options for the clinical management of those patients. Targeting α5β1 integrins might not only prevent metastasis of HNSCC but also reduce the development of the primary tumor by reducing tumor cell viability. In conclusion, Cav1 detection might be taken into consideration in the future in the clinic not only to identify patients at high risk of metastasis but also to select patient who might benefit from an anti-integrin therapy.
Materials and Methods
Cell lines, culture conditions
SCC9 cell lines were purchased from the ATCC and grown in DMEM-F12 (PAN Biotech) supplemented with 2mmol/L L-glutamine, 0.4µg/mL hydrocortisone (Sigma) and 10% FBS (Gibco). Cell lines were authenticated as described in suppl. material and methods.
Human tissue samples
All tumor specimens (N = 68) were collected, stored and used with the patients’ informed consent. Patients from the North-East region of France underwent initial surgical resection of their localized HNSCC between 1989 and 2002. Hematoxylin-eosin slides of paraffin-embedded tumor (FFPE) specimens were examined by two pathologists. All of the tumors were squamous cell carcinomas. For detailed patients demographics, see Suppl. Table 1. Gene expression assays were performed on total RNA from frozen tumor tissues as described in [6] (see also Suppl. Material and Methods). The following genes were evaluated: Cav-1, E-Cadherin, Twist, Vimentin (see suppl. Table 2 for the sequence of specific primers). The expression of Cav1 and α5 integrin subunit was evaluated by immunohistochemical analysis (IHC) as described in [48] (see also suppl. material and methods).
Short interfering RNA and plasmids
ShRNA (OpenBiosystems) were transfected at 4 μg using 10µg/mL Arrest In™ and stable cell lines were selected with 1 µg/mL puromycine. SiRNA (Dharmacon) were transfected at 100 nmol/L using Lipofectamine™ 2000 (Invitrogen). Efficiency of protein silencing was determined by western blotting and RT-qPCR.
Chemicals
The compound 34c (2-(S)-2,6-dimethlybenzamido)-3-[4-(3-pyridin-2-ylaminopro oxy)-phenyl] propionic acid) named K34c [12] was synthesized in our laboratory according the procedure described by Heckmann et al. [49]. Compound 1 [26] is one of the most selective non peptidic α5β1 integrin antagonist and was synthetized (as the compound 44) as described in Heckmann et al. [49]. OS2966, an anti-β1 integrin blocking antibody was kindly provided by OncoSynergy.
Real-time quantitative PCR
RNA was extracted as previously described [11]. mRNA expression was evaluated by relative quantitative RT-qPCR analysis using the StepOne Plus (Applied Biosystems) FastSYBRGreen PCR detector with primers (Invitrogen) described in suppl. Table 2. Target cDNA expression was quantified using the comparative ΔΔCt method with 18S rRNA as an internal control.
Western blot
Cells were lysed (1% Triton-X100, NaF 100 mmol/L, NaPPi 10 mmol/L, Na3VO4 1mmol/L in PBS, supplemented with Complete anti-protease cocktail; Roche) and 1-20 µg of protein was separated by SDS-PAGE (BioRad) and transferred to PVDF membranes (Amersham). Blots were probed with various antibodies described in suppl. Table 3. Proteins were visualized with enhanced chemiluminescence using the LAS4000 imager and densitometry analysis was performed using the ImageQuant Software (GE Healthcare).
Immunostaining of secreted fibronectin
Cells were plated at 2x10⁵ cells per chamber in Lab-Tek II CC2 chamber slide (Nunc) for 24 hours. Cells were fixed 10 minutes at room temperature with 4% PFA, blocked 1 hour with 1% BSA and stained for extracellular secreted fibronectin (1:200) 1 hour at room temperature. After extensive wash, anti-Alexa546 was incubated an additional 1 hour at room temperature. Slides were mounted using Prolon Gold antifade reagent (Invitrogen) and observed using a fluorescent microscope (AXIO, Zeiss) with a 4X magnification.
Growth assay
shRNActrl and shRNAcav1-transfected SCC9 were counted at each passage after plating at similar density using the TC20 cell counter (BioRad).
Clonogenic assay
Clonogenic assays were performed as previously described [50]. Data were expressed as surviving fraction as described by Cosset et al. [10]. Plating efficiency are 0.23±0.02, and 0.17 ± 0.02 for shRNActrl and shRNAcav1-transfected SCC9 respectively.
Single cell tracking
Cells were seeded at 500 cells/well with 1µg/mL Hoechst3342 (Sigma) in µClear 96 well black plate (Dutscher) in L-15 medium (Sigma) supplemented with 10%FBS. After 24 hours, medium was removed and fresh medium containing DMSO or 20 µmol/L compound 1 was added. Migration was followed by fluorescent microscopy (IN Cell Analyzer 1000, GE Healthcare) during 6 hours. Analyses were performed only on cells tracked during the entire assay. Speed and trajectories were computed with Excel software as previously reported [26].
Spheres evasion assay
Cells were seeded at 1x10⁴ per 100µL of regular culture supplemented with 20% methylcellulose per well in 96 well plate with round bottom for 12 hours to allow spheroid formation. Spheroids were collected and seeded in plastic, fibronectin- or collagen-coated (10µg/mL) 24 well plates (1 sphere/well) for additional 12 hours to allow evasion of cells from attached spheres. Pictures were taken using the Evos Core microscope (AMG) with a 10X magnification. Results were expressed as the area of evasion of cells from the area of the attached sphere (total area - sphere area) determined using the ImageJ software and results are expressed in pixels.
Invasion assay
Lower chambers of BD BioCoat Matrigel invasion chamber (24 well, 8 µm pores, BD Biosciences) were filled with 750µl of 10% FCS culture medium. 2.5x10⁴ cells were seeded in the upper compartment in 0% FCS culture medium containing DMSO or 20 µM K34c for 22 hours according to manufacturer’s instructions. Cells that had transmigrated and adhered to the lower surface were fixed in glutaraldehyde for 15 minutes, stained with 0.1% crystal violet for 30 minutes and counted. No cells were detected in the lower chamber.
Statistical analysis
Data are represented as mean ± SEM. In all cases, n refers to the number of independent experiments. Statistical analyses were done with the Student’s t-test or ANOVA where p < 0.05 was considered significant.
Acknowledgments
The authors thank Dr F. Carreiras (Cergy-Pontoise, France) for the gift of human fibronectin, Dr W.S. Carbonell from OncoSynergy for anti-β1 integrin subunit antibody (San Fransisco, USA) and the CRLC Paul Strauss (Strasbourg, France) for immunohistochemical analysis. Work is supported by the University of Strasbourg, the Ligue Contre le Cancer (Comité du Grand Est), by the Fondation ARC pour la Recherche sur le Cancer, by the Canceropole Grand-Est and by the Region Alsace. G. Renner and A.F. Blandin are predoctoral fellow from the French Ministère de l’Enseignement Supérieur et de la Recherche.
CONFLICTS OF INTEREST
The authors declare that they have no conflict of interest.
References
1. Hashibe M, Brennan P, Chuang SC, Boccia S, Castellsague X, Chen C, Curado MP, Dal Maso L, Daudt AW, Fabianova E, Fernandez L, Wunsch-Filho V, Franceschi S, Hayes RB, Herrero R, Kelsey K, et al. Interaction between tobacco and alcohol use and the risk of head and neck cancer: pooled analysis in the International Head and Neck Cancer Epidemiology Consortium. Cancer epidemiology, biomarkers & prevention : a publication of the American Association for Cancer Research, cosponsored by the American Society of Preventive Oncology. 2009; 18:541-550.
2. Dayyani F, Etzel CJ, Liu M, Ho CH, Lippman SM and Tsao AS. Meta-analysis of the impact of human papillomavirus (HPV) on cancer risk and overall survival in head and neck squamous cell carcinomas (HNSCC). Head & neck oncology. 2010; 2:15.
3. Jemal A, Bray F, Center MM, Ferlay J, Ward E and Forman D. Global cancer statistics. CA: a cancer journal for clinicians. 2011; 61:69-90.
4. Denaro N, Russi EG, Adamo V and Merlano MC. State-of-the-art and emerging treatment options in the management of head and neck cancer: news from 2013. Oncology. 2014; 86:212-229.
5. Ma J, Liu Y, Yang X, Zhang CP, Zhang ZY and Zhong LP. Induction chemotherapy in patients with resectable head and neck squamous cell carcinoma: a meta-analysis. World journal of surgical oncology. 2013; 11:67.
6. Jung AC, Job S, Ledrappier S, Macabre C, Abecassis J, de Reynies A and Wasylyk B. A poor prognosis subtype of HNSCC is consistently observed across methylome, transcriptome, and miRNome analysis. Clinical cancer research : an official journal of the American Association for Cancer Research. 2013; 19:4174-4184.
7. Pavon MA, Parreno M, Tellez-Gabriel M, Sancho FJ, Lopez M, Cespedes MV, Casanova I, Lopez-Pousa A, Mangues MA, Quer M, Barnadas A, Leon X and Mangues R. Gene expression signatures and molecular markers associated with clinical outcome in locally advanced head and neck carcinoma. Carcinogenesis. 2012; 33:1707-1716.
8. Rickman DS, Millon R, De Reynies A, Thomas E, Wasylyk C, Muller D, Abecassis J and Wasylyk B. Prediction of future metastasis and molecular characterization of head and neck squamous-cell carcinoma based on transcriptome and genome analysis by microarrays. Oncogene. 2008; 27:6607-6622.
9. Zhang X, Su L, Pirani AA, Wu H, Zhang H, Shin DM, Gernert KM and Chen ZG. Understanding metastatic SCCHN cells from unique genotypes to phenotypes with the aid of an animal model and DNA microarray analysis. Clinical & experimental metastasis. 2006; 23:209-222.
10. Cosset EC, Godet J, Entz-Werle N, Guerin E, Guenot D, Froelich S, Bonnet D, Pinel S, Plenat F, Chastagner P, Dontenwill M and Martin S. Involvement of the TGFbeta pathway in the regulation of alpha5 beta1 integrins by caveolin-1 in human glioblastoma. International journal of cancer Journal international du cancer. 2012; 131:601-611.
11. Martin S, Cosset EC, Terrand J, Maglott A, Takeda K and Dontenwill M. Caveolin-1 regulates glioblastoma aggressiveness through the control of alpha(5)beta(1) integrin expression and modulates glioblastoma responsiveness to SJ749, an alpha(5)beta(1) integrin antagonist. Biochimica et biophysica acta. 2009; 1793:354-367.
12. Janouskova H, Maglott A, Leger DY, Bossert C, Noulet F, Guerin E, Guenot D, Pinel S, Chastagner P, Plenat F, Entz-Werle N, Lehmann-Che J, Godet J, Martin S, Teisinger J and Dontenwill M. Integrin alpha5beta1 plays a critical role in resistance to temozolomide by interfering with the p53 pathway in high-grade glioma. Cancer research. 2012; 72:3463-3470.
13. Couet J, Li S, Okamoto T, Ikezu T and Lisanti MP. Identification of peptide and protein ligands for the caveolin-scaffolding domain. Implications for the interaction of caveolin with caveolae-associated proteins. The Journal of biological chemistry. 1997; 272:6525-6533.
14. Okamoto T, Schlegel A, Scherer PE and Lisanti MP. Caveolins, a family of scaffolding proteins for organizing “preassembled signaling complexes” at the plasma membrane. The Journal of biological chemistry. 1998; 273:5419-5422.
15. Martinez-Outschoorn UE, Sotgia F and Lisanti MP. Caveolae and signalling in cancer. Nature reviews Cancer. 2015; 15:225-237.
16. Senetta R, Stella G, Pozzi E, Sturli N, Massi D and Cassoni P. Caveolin-1 as a promoter of tumour spreading: when, how, where and why. Journal of cellular and molecular medicine. 2013; 17:325-336.
17. Kato K, Hida Y, Miyamoto M, Hashida H, Shinohara T, Itoh T, Okushiba S, Kondo S and Katoh H. Overexpression of caveolin-1 in esophageal squamous cell carcinoma correlates with lymph node metastasis and pathologic stage. Cancer. 2002; 94:929-933.
18. Masuelli L, Budillon A, Marzocchella L, Mrozek MA, Vitolo D, Di Gennaro E, Losito S, Sale P, Longo F, Ionna F, Lista F, Muraro R, Modesti A and Bei R. Caveolin-1 overexpression is associated with simultaneous abnormal expression of the E-cadherin/alpha-beta catenins complex and multiple ErbB receptors and with lymph nodes metastasis in head and neck squamous cell carcinomas. Journal of cellular physiology. 2012; 227:3344-3353.
19. Arpaia E, Blaser H, Quintela-Fandino M, Duncan G, Leong HS, Ablack A, Nambiar SC, Lind EF, Silvester J, Fleming CK, Rufini A, Tusche MW, Brustle A, Ohashi PS, Lewis JD and Mak TW. The interaction between caveolin-1 and Rho-GTPases promotes metastasis by controlling the expression of alpha5-integrin and the activation of Src, Ras and Erk. Oncogene. 2012; 31:884-896.
20. Tahir SA, Yang G, Ebara S, Timme TL, Satoh T, Li L, Goltsov A, Ittmann M, Morrisett JD and Thompson TC. Secreted caveolin-1 stimulates cell survival/clonal growth and contributes to metastasis in androgen-insensitive prostate cancer. Cancer research. 2001; 61:3882-3885.
21. Zhang H, Su L, Muller S, Tighiouart M, Xu Z, Zhang X, Shin HJ, Hunt J, Sun SY, Shin DM and Chen ZG. Restoration of caveolin-1 expression suppresses growth and metastasis of head and neck squamous cell carcinoma. British journal of cancer. 2008; 99:1684-1694.
22. Zhang X, Liu Y, Gilcrease MZ, Yuan XH, Clayman GL, Adler-Storthz K and Chen Z. A lymph node metastatic mouse model reveals alterations of metastasis-related gene expression in metastatic human oral carcinoma sublines selected from a poorly metastatic parental cell line. Cancer. 2002; 95:1663-1672.
23. Alevizos L, Kataki A, Derventzi A, Gomatos I, Loutraris C, Gloustianou G, Manouras A, Konstadoulakis MM and Zografos G. Breast cancer nodal metastasis correlates with tumour and lymph node methylation profiles of Caveolin-1 and CXCR4. Clinical & experimental metastasis. 2014; 31:511-520.
24. Trimmer C, Whitaker-Menezes D, Bonuccelli G, Milliman JN, Daumer KM, Aplin AE, Pestell RG, Sotgia F, Lisanti MP and Capozza F. CAV1 inhibits metastatic potential in melanomas through suppression of the integrin/Src/FAK signaling pathway. Cancer research. 2010; 70:7489-7499.
25. Lu Z, Ghosh S, Wang Z and Hunter T. Downregulation of caveolin-1 function by EGF leads to the loss of E-cadherin, increased transcriptional activity of beta-catenin, and enhanced tumor cell invasion. Cancer cell. 2003; 4:499-515.
26. Ray AM, Schaffner F, Janouskova H, Noulet F, Rognan D, Lelong-Rebel I, Choulier L, Blandin AF, Lehmann M, Martin S, Kapp T, Neubauer S, Rechenmacher F, Kessler H and Dontenwill M. Single cell tracking assay reveals an opposite effect of selective small non-peptidic alpha5beta1 or alphavbeta3/beta5 integrin antagonists in U87MG glioma cells. Biochimica et biophysica acta. 2014; 1840:2978-2987.
27. Masood R, Hochstim C, Cervenka B, Zu S, Baniwal SK, Patel V, Kobielak A and Sinha UK. A novel orthotopic mouse model of head and neck cancer and lymph node metastasis. Oncogenesis. 2013; 2:e68.
28. Zhao X, Ma C, Cai X, Lei D, Liu D, Xu F, Jin T, Liu J and Pan X. RNA interference of caveolin-1 via lentiviral vector inhibits growth of hypopharyngeal squamous cell carcinoma FaDu cells In Vitro and In Vivo. Asian Pacific journal of cancer prevention : APJCP. 2011; 12:397-401.
29. Nohata N, Hanazawa T, Kikkawa N, Mutallip M, Fujimura L, Yoshino H, Kawakami K, Chiyomaru T, Enokida H, Nakagawa M, Okamoto Y and Seki N. Caveolin-1 mediates tumor cell migration and invasion and its regulation by miR-133a in head and neck squamous cell carcinoma. International journal of oncology. 2011; 38:209-217.
30. Mercier I, Camacho J, Titchen K, Gonzales DM, Quann K, Bryant KG, Molchansky A, Milliman JN, Whitaker-Menezes D, Sotgia F, Jasmin JF, Schwarting R, Pestell RG, Blagosklonny MV and Lisanti MP. Caveolin-1 and accelerated host aging in the breast tumor microenvironment: chemoprevention with rapamycin, an mTOR inhibitor and anti-aging drug. The American journal of pathology. 2012; 181:278-293.
31. Thiery JP, Acloque H, Huang RY and Nieto MA. Epithelial-mesenchymal transitions in development and disease. Cell. 2009; 139:871-890.
32. Kalluri R and Weinberg RA. The basics of epithelial-mesenchymal transition. The Journal of clinical investigation. 2009; 119:1420-1428.
33. Strippoli R, Loureiro J, Moreno V, Benedicto I, Perez Lozano ML, Barreiro O, Pellinen T, Minguet S, Foronda M, Osteso MT, Calvo E, Vazquez J, Lopez Cabrera M and Del Pozo MA. Caveolin-1 deficiency induces a MEK-ERK1/2-Snail-1-dependent epithelial-mesenchymal transition and fibrosis during peritoneal dialysis. EMBO molecular medicine. 2014; 7:102-123.
34. Li Z, Wermuth PJ, Benn BS, Lisanti MP and Jimenez SA. Caveolin-1 deficiency induces spontaneous endothelial-to-mesenchymal transition in murine pulmonary endothelial cells in vitro. The American journal of pathology. 2013; 182:325-331.
35. Zeisberg M and Neilson EG. Biomarkers for epithelial-mesenchymal transitions. The Journal of clinical investigation. 2009; 119:1429-1437.
36. Nam EH, Lee Y, Zhao XF, Park YK, Lee JW and Kim S. ZEB2-Sp1 cooperation induces invasion by upregulating cadherin-11 and integrin alpha5 expression. Carcinogenesis. 2014; 35:302-314.
37. Nam EH, Lee Y, Moon B, Lee JW and Kim S. Twist1 and AP-1 cooperatively upregulate integrin alpha5 expression to induce invasion and the epithelial-mesenchymal transition. Carcinogenesis. 2015; 36:327-337.
38. Haraguchi M, Okubo T, Miyashita Y, Miyamoto Y, Hayashi M, Crotti TN, McHugh KP and Ozawa M. Snail regulates cell-matrix adhesion by regulation of the expression of integrins and basement membrane proteins. The Journal of biological chemistry. 2008; 283:23514-23523.
39. Sawada K, Mitra AK, Radjabi AR, Bhaskar V, Kistner EO, Tretiakova M, Jagadeeswaran S, Montag A, Becker A, Kenny HA, Peter ME, Ramakrishnan V, Yamada SD and Lengyel E. Loss of E-cadherin promotes ovarian cancer metastasis via alpha 5-integrin, which is a therapeutic target. Cancer research. 2008; 68:2329-2339.
40. Roman J, Ritzenthaler JD, Roser-Page S, Sun X and Han S. alpha5beta1-integrin expression is essential for tumor progression in experimental lung cancer. American journal of respiratory cell and molecular biology. 2010; 43:684-691.
41. Nam JM, Onodera Y, Bissell MJ and Park CC. Breast cancer cells in three-dimensional culture display an enhanced radioresponse after coordinate targeting of integrin alpha5beta1 and fibronectin. Cancer research. 2010; 70:5238-5248.
42. Wang D, Muller S, Amin AR, Huang D, Su L, Hu Z, Rahman MA, Nannapaneni S, Koenig L, Chen Z, Tighiouart M, Shin DM and Chen ZG. The pivotal role of integrin beta1 in metastasis of head and neck squamous cell carcinoma. Clinical cancer research : an official journal of the American Association for Cancer Research. 2012; 18:4589-4599.
43. Maglott A, Bartik P, Cosgun S, Klotz P, Ronde P, Fuhrmann G, Takeda K, Martin S and Dontenwill M. The small alpha5beta1 integrin antagonist, SJ749, reduces proliferation and clonogenicity of human astrocytoma cells. Cancer research. 2006; 66:6002-6007.
44. Harada T, Shinohara M, Nakamura S and Oka M. An immunohistochemical study of the extracellular matrix in oral squamous cell carcinoma and its association with invasive and metastatic potential. Virchows Archiv : an international journal of pathology. 1994; 424:257-266.
45. Ryu MH, Park HM, Chung J, Lee CH and Park HR. Hypoxia-inducible factor-1alpha mediates oral squamous cell carcinoma invasion via upregulation of alpha5 integrin and fibronectin. Biochemical and biophysical research communications. 2010; 393:11-15.
46. Martinkova E, Maglott A, Leger DY, Bonnet D, Stiborova M, Takeda K, Martin S and Dontenwill M. alpha5beta1 integrin antagonists reduce chemotherapy-induced premature senescence and facilitate apoptosis in human glioblastoma cells. International journal of cancer Journal international du cancer. 2010; 127:1240-1248.
47. Zhang X, Cheng SL, Bian K, Wang L, Zhang X, Yan B, Jia LT, Zhao J, Gammoh N, Yang AG and Zhang R. MicroRNA-26a promotes anoikis in human hepatocellular carcinoma cells by targeting alpha5 integrin. Oncotarget. 2015; 6:2277-2289.
48. Jung AC, Guihard S, Krugell S, Ledrappier S, Brochot A, Dalstein V, Job S, de Reynies A, Noel G, Wasylyk B, Clavel C and Abecassis J. CD8-alpha T-cell infiltration in human papillomavirus-related oropharyngeal carcinoma correlates with improved patient prognosis. International journal of cancer Journal international du cancer. 2013; 132:E26-36.
49. Heckmann D, Meyer A, Marinelli L, Zahn G, Stragies R and Kessler H. Probing integrin selectivity: rational design of highly active and selective ligands for the alpha5beta1 and alphavbeta3 integrin receptor. Angew Chem Int Ed Engl. 2007; 46:3571-3574.
50. Martin S, Phillips DC, Szekely-Szucs K, Elghazi L, Desmots F and Houghton JA. Cyclooxygenase-2 inhibition sensitizes human colon carcinoma cells to TRAIL-induced apoptosis through clustering of DR5 and concentrating death-inducing signaling complex components into ceramide-enriched caveolae. Cancer research. 2005; 65:11447-11458.