
Introduction
Alzheimer-type dementia (AD) is a neurodegenerative disorder and the most common form of dementia [1-3]. Dementia is a syndrome applied to a group of symptoms that can be caused by a variety of conditions, the most common of which is Alzheimer’s disease; unfortunately, due in part to this ambiguity, the aetiology of AD is not well understood [4]. The onset and risk of -development is still mostly unexplained, and only very partially so by genetic factors [4]. Today AD is the largest unmet medical need in neurology [5-7], and is a condition characterized by neuroinflammation [8, 9]. Neuroinflammation is a multi-faceted and complex phenomenon where the precise mechanisms have not been completely elucidated [10], but where activated astrocytes and microglia are usually the trigger in the neuroinflammatory process. They become reactive in response to virtually all pathological situations in the brain such as axotomy (neuritic dystrophy), ischemia, infection, and existing neurodegenerative diseases [11-15].
In this paper, we discuss the factors involved in systemic inflammation and show that they are also typically prevalent in neuroinflammation. We focus specifically on literature that shows a changed iron profile, increased fibrinogen levels and oxidative stress; these have each been implicated in a typical hypercoagulable (thrombotic) state, but are also present in AD (the literature is discussed fully in the different sections). Figure 1 shows the layout of this paper, where the focus is on 3 main characteristics of AD, namely (1) neuroinflammation (2) systemic inflammation and (3) oxidative stress. We briefly discuss specific changes in brain morphology (A) and shared inflammatory mediators between neuroinflammation and systemic inflammation (B) (with special reference to a changed iron profile). Factors that are typically implicated in systemic inflammation, but that have an impact on the brain (C) are then examined. We then consider how the three main characteristics are affected by and also result in (4) hypercoagulation and how we can measure this by using electron microscopic and viscoelastic techniques. Lastly, we conclude by discussing possible reasons for this hypercoagulability in AD, and we discuss that the presence of a dormant blood microbiome, and in particular the lipopolysaccharides (LPS) that they can shed, may be central to the hypercoagulable state in this condition [16, 17].
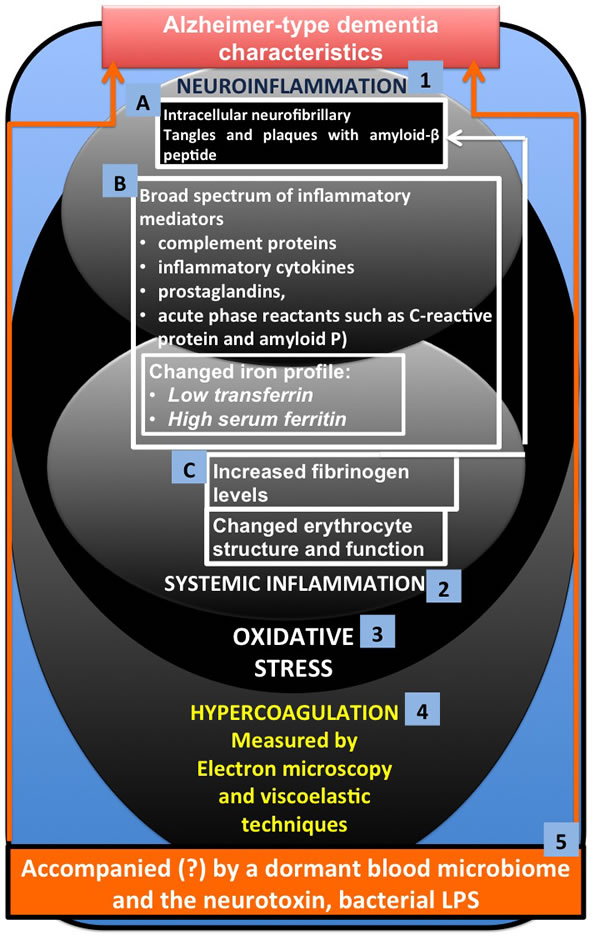
Figure 1: Alzheimer-type dementia (AD) and three of its main characteristics (1) neuroinflammation (2) systemic inflammation and (3) oxidative stress, where A. involves specific changes in brain morphology and B. shows shared inflammatory mediators between neuroinflammation and systemic inflammation (with special reference to a changed iron profile) and C. factors that are typically implicated in systemic inflammation, but that have an impact on the brain. The three main characteristics are affected by and also result in (4) hypercoagulation, which we can measure using electron microscopy and viscoelastic techniques. We conclude by discussing how the presence of a dormant blood microbiome, and in particular the lipopolysaccharides (LPS) and other cell wall materials that they can shed, may be central to the hypercoagulable/neuroinflammatory state in this condition.
Neuroinflammation and the iron link
The next paragraphs will briefly discuss presentation of neuroinflammation and the involvement of iron and its accompanying oxidative damage in AD etiology. We will make the link between the presence of hypercoagulability in AD and oxidative damage, changed iron levels and inflammation (both neuro- and systemic inflammation).
The hallmarks of dementia in AD, as well as the severity and state of neurodegeneration, are closely linked to the presence of tau phosphorylation, amyloid-β peptide aggregation, neurofibrillary tangle formation, neuroinflammation, and neurodegeneration [18, 19]. If we look closely at the presentation of AD, it is characterized by brain lesions known as intracellular neurofibrillary tangles and extracellular neuritic plaques surrounded by activated astrocytes and microglia [20]. The neurofibrillary tangles consist of paired helical filaments of truncated tau protein that is abnormally hyperphosphorylated [21, 22]. The main component in the plaques is the amyloid-β peptide [1, 23], though its role in the actual disease pathology is more than questionable [24]. The brain lesions in AD are also characterized by the presence of a broad spectrum of inflammatory mediators (complement proteins, inflammatory cytokines, prostaglandins, and acute phase reactants such as C-reactive protein and amyloid P) [25, 26]. Resident brain cells, including neurons produce these mediators [27, 28]. Neuroinflammation is therefore key in AD [26, 28-33]. Central to this neuroinflammation in AD is the involvement of iron and its accompanying oxidative damage in AD etiology [34-48]. Oxidative damage is one of the earliest pathological changes in AD, and the aberrant redox activity is therefore also among the earliest changes in the transition to the disease state [49]. Note that as long ago as 1991 it was shown that chelators of free iron improved cognitive function in AD sufferers [40, 50].
Oxidative damage, iron, inflammation and hypercoagulability
Oxidative damage, increased iron levels and inflammation are all linked to the development of hypercoagulability [51-58]. Increased fibrin(ogen) levels have also been noted in hypercoagulation [53, 59-65] and this is also observed in blood vessels positive for amyloid in mouse and human AD samples [66]. Fibrinogen extravasation in the AD brain has also been noted [67]. Thus, fibrin(ogen) may play an important role in AD etiology as it has been implicated in the neuroinflammation, neurovascular damage, blood-brain barrier permeability, vascular amyloid deposition, and memory deficits, all of which are associated with AD [68]. Increased fibrinogen levels in AD are therefore a strong cerebrovascular risk factor in these patients, as fibrinogen specifically binds to β-amyloid, thereby altering fibrin clot structure and delaying clot degradation [69]. However, there is currently no evidence regarding the extent to which delayed clot degeneration might contribute to AD.
Thrombosis, and therefore hypercoagulation, is typically associated with increased levels of fibrin(ogen) [58, 70, 71]. A changed iron profile (e.g. low transferrin and/or high serum ferritin) is also central to thrombosis and hypercoagulation [38, 58, 72-79] and iron dysregulation is heavily implicated in AD [38, 80]. Changes in fibrin fibre structure (due to hypercoagulation and a changed iron profile) can be visualized using various ultramicroscopy techniques [54, 58, 81-86]. In addition, these changes might be correlated with results from viscoelastic techniques like thromboelastography (TEG®) [52, 79, 85, 87, 88]. Figure 2 shows how the intrinsic and extrinsic coagulation process causes fibrin fibre formation under normal conditions, and how fibrin fibre formation is changed under the influence of a changed (aberrant) iron profile, whether by generating hydroxyl radicals (resulting in oxidative stress, and also during systemic inflammation) [89] or by electrostatic means [57, 58].
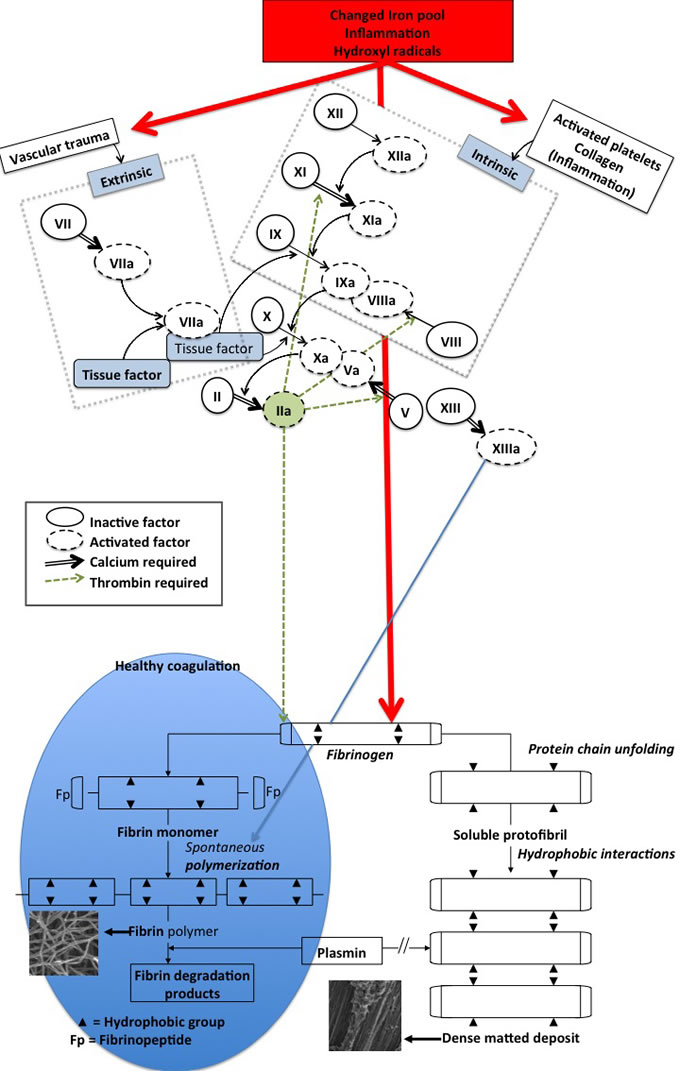
Figure 2: Schematic representation of the intrinsic and extrinsic coagulation pathway and the conversion of soluble fibrinogen into insoluble polymers. Thrombin‘s action on fibrinogen results in the formation of fibrin strands (left insert) that are in time degradable with plasmin. By contrast, iron-induced dense matted deposits (right insert) are less degradable [89] - this is during normal blood coagulation. Iron-induced blood coagulation is seen as dense matted deposits under scanning electron microscopy and viscoelastically [85, 87, 88].
Link between a hypercoagulable state, iron dysregulation, changes in fibrin fibre structure and a sterile microbiome
This said, there is still no clear reason precisely why (a) this hypercoagulable state, (b) iron dysregulation and (c) changes in fibrin fibre structure could together lead to the loss of neuronal structure and cognitive function in AD. The following paragraphs will discuss the link between (a to c) and a supposedly sterile blood microbiome.
Recently, we showed (with ultrastructural microscopy techniques) that, in the “sterile” blood microbiome of AD patients, there are bacteria present, that we have suggested are normally dormant [16, 90]. Dormancy is in fact the norm in environmental and general microbiology [91, 92]. We note that there is a substantial literature implicating chronic infection [93-97] as well as the gastrointestinal tract microbiome in AD [98-100]. In particular, periodontal disease related pathogens and their inflammatory products have been shown to contribute to, or at least to accompany, systemic inflammation and the pathogenesis of AD [93, 101-105]. Particularly, periodontal pathogens Porphyromonas gingivalis, Tannerella forsythia, and Treponema denticola have been implicated in the development of AD [106, 107]. Infections with Herpes simplex virus type 1 [97], picornavirus, Borna disease virus, Chlamydia pneumoniae, Helicobacter pylori, and spirochetes [96, 108] and pathogens causing urinary tract infections [94, 109-111] are also implicated and co-occurring in AD.
Recently, immunoblotting demonstrated bands corresponding to lipopolysaccharides (LPS) (also known as endotoxin), produced or shed by P. gingivalis in 40% of AD brain specimens [107]. Indeed, there is evidence that bacterial endotoxins are directly involved in the inflammatory and pathological processes associated with AD [112]. Interestingly, it has been observed that chronic infusion of the bacterial LPS, the outer cell wall component of Gram negative bacteria, into the fourth brain ventricle of rats reproduces many of the inflammatory and pathological features seen in the brain of AD patients [112]. Apolipoprotein E (ApoE) is an intermediate-density lipoprotein that is essential for the normal catabolism of triglyceride-rich lipoprotein constituents. It also transports cholesterol (its primary function), and regulates amyloid-β (Aβ) metabolism, aggregation, and deposition [113]. Interestingly, LPS may disturb the typically anti-inflammatory effect of ApoE. ApoE function is known to be down-regulated in AD patients [114, 115], and carrying the ApoE4 allele increases risk of Alzheimer’s disease [113, 116, 117]. The down-regulating effect on ApoE by LPS was also seen in an animal model [118]. Furthermore, LPS is used in animal models to induce AD-like symptoms, as well as neuroinflammation [119, 120], as well as Parkinson’s disease-like symptoms [17, 121-128]. Recently it was also noted that LPS can produce myelin injury and plaque-like aggregates of myelin in mice, and amyloid-β and amyloid-β protein precursor co-localize with these myelin aggregates. Cortical amyloid plaques also co-localized with myelin aggregates [129]. Following LPS injection, Alzheimer-like amyloidogenic axonal pathology also occur in the normal mammalian brain in partnership with neuroinflammation [130], and LPS is associated with the development of neuroinflammation in animals [130], as well as in primary culture neuroinflammatory models [131].
From the above, and other literature reviewed elsewhere [17, 132], there is ample evidence that LPS can cause neuroinflammation and amyloid-β formation. There is also evidence for the involvement of LPS in cognitive impairment in AD. For instance,
• LPS is used to induce cognitive impairment in mice [120, 133].
• LPS induces stress and depression in late onset AD [134].
• Neuro-inflammation, amyloidogenesis and memory impairment in a mouse model is seen following the systemic inflammation generated by LPS [120].
• Intraperitoneal injection of LPS causes attention deficits [135] and severe and fluctuating cognitive deficits in 16-week ME7 mice [136].
Where does this bacteria/LPS argument lead us to? It is known that LPS can also cause hypercoagulation [137, 138]; this has been referred to as endotoxin-mediated hypercoagulation [139]. There is substantial evidence in the literature that microbes have a prominent involvement in AD, but it seems that only a few researchers have taken the final step to suggest that such bacteria may actually cause or exacerbate AD (in the sense of “Koch’s postulates”) [96], and that shedding of LPS from the (dormant) blood microbiome may exacerbate or even cause the hypercoagulability seen in AD. Clearly the measurement of hypercoagulability is considerably easier than the estimation of cognitive function.
In the current paper we used scanning electron microscopy, together with viscoelastic techniques, to study whole blood and plasma in AD patients and compared the results with those of age- and gender-matched healthy individuals. We also studied iron profiles and general hematological parameters. Lastly, we simulated the effect of “physiological” levels of LPS, by adding it to healthy, uncitrated blood. We determine if LPS has an effect on platelets by using a novel technique called the Global Thrombosis Test (GTT) [140, 141]. This allows for the detection of thrombin generation by activated platelets, the major determinant of arterial thrombogenesis and measured endogenous (spontaneous) thrombolytic activity (http://www.globalthrombosis.com). Typical LPS concentrations in ‘normal’ whole blood in healthy subjects seem to be of the order of 10-15 ng.L-1 [17, 142, 143], while those of LBP are roughly 1,000,000 times greater at 5-15 mg.L-1 (with both values increasing during sepsis). The exact significance of these numbers is not clear [17] as LPS is so hydrophobic that most is bound to the LPS-binding protein or lipoproteins [144-146]. We also added LPS to naïve whole blood and measured coagulation parameters with the TEG®, to determine directly if added LPS causes hypercoagulability. If this were to be the case, it would imply that LPS can bind directly to fibrinogen.
Results
Healthy individual and Alzheimer-type dementia patient data
Table 2 show demographics for healthy and AD individuals, iron profiles, and data for the TEG®, GTT® and SEM.
Literature suggests that normal values for serum iron are between 11.6 and 31.4 μmol.L-1 [158], for transferrin they are 2.2 - 3.7 g.L-1 [158], normal % saturation is 20-50% [158], and serum ferritin for males are between 25 - 300 μg.L-1 and females are between 25 - 200 μg.L-1 [159]. However, values for normal ranges vary between pathology laboratories. Our values are therefore taken according to the values for South Africa (http://ampath.co.za) and indicated in the table. In the current sample, the iron and transferrin showed significant differences between the healthy and AD population, with the transferrin for the AD individuals being mostly lower (see Table 2).
In our previous paper on the hematological system and systemic inflammation of AD, we reviewed the importance of increased iron, and particularly serum ferritin [160]. Results from the current AD sample show that both iron and transferrin levels were significantly different between the healthy and AD individuals. Transferrin is lowered in inflammation [72, 161], and is known as a “negative” acute-phase protein [161]; it is also decreased in in AD [162]. In the present sample most of the AD individuals have serum ferritin levels within the normal ranges for their genders.
Table 1: Thromboelastograph® parameters typically generated for whole blood and platelet poor plasma [153, 154].
THROMBOELASTIC PARAMETERS |
||
R value: reaction time |
Minutes |
Time of latency from start of test to initial fibrin formation (amplitude of 2mm); i.e. initiation time |
K: kinetics |
Minutes |
Time taken to achieve a certain level of clot strength (amplitude of 20mm); i.e. amplification |
Α (Alpha): Angle (slope between the traces represented by R and K) |
Angle in degrees |
The angle measures the speed at which fibrin build up and cross linking takes place, hence assesses the rate of clot formation; i.e. thrombin burst |
MA: Maximal Amplitude |
mm |
Maximum strength/stiffness of clot. Represents the ultimate strength of the fibrin clot, i.e. overall stability of the clot |
Maximum rate of thrombus generation (MRTG) |
Dyn.cm-2.s-1 |
The maximum velocity of clot growth observed |
Time to maximum rate of thrombus generation (TMRTG) |
Minutes |
The time interval observed before the maximum speed of the clot growth |
Total thrombus generation (TTG) |
Dyn.cm-2 |
The clot strength: the amount of total resistance (to movement of the cup and pin) generated during clot formation. This is the total area under the velocity curve during clot growth representing the amount of clot strength generated during clot growth |
Thromboelastography® results
The following parameters were all changed in the AD patients, and showed a significant difference between the healthy and AD individuals:
• Increased maximum rate of thrombus generation (MRTG),
• Decreased time to maximum rate of thrombus generation (TMRTG) which is the time interval (s) observed before maximum velocity of clot growth,
• Shorter time taken to achieve final clot strength i.e. amplification (K)
• as well as an increased Alpha or Angle representing the speed at which the fibrin build-up and crosslinking of the fibrinogen fibres takes place, or therefore to stabilize the clot.
The results are in line with a faster initial clot formation but and increased time to stabilize the clot in AD compared to controls.
Table 2: Demographics of participants, as well as iron levels, thromboelastography® (TEG®) of plasma, fibrin fiber thickness, and thromboelastography® (TEG®) and global thrombosis test (GTT®) of naïve blood of age-matched controls (without dementia) and Alzheimer-type dementia (AD) patients, showing medians, standard deviation and p-values (values lower than 0.05 are indicated in blue) obtained using the Mann- Whitney U test.
Variables |
Healthy individuals (n = 20) |
Alzheimer-type dementia individuals (n = 40) |
P-value |
Confidence interval (95%) relative to median |
AGE years |
68.5 (±22.21) |
79 (±11.8) |
0.316 |
-4 to 21 |
GENDER |
||||
Male |
6 (40%) |
12 (30%) |
||
Female |
14 (60%) |
28 (70%) |
||
IRON PROFILES |
||||
Iron µM |
18.8 (± 5.74) |
13.55 (±4.98) |
0.0293 |
0.4 to 6.8 |
Transferrin g.L-1 |
2.55 (± 0.39) |
2.11 (± 0.39) |
0.0001 |
0.2 to 0.7 |
% Saturation |
28 (± 10.32) |
26 (± 9.95) |
0.6543 |
-5 to 8 |
Serum Ferritin ng.mL-1 |
79 (±78.39) |
99 (±128.84) |
0.457 |
-59 to 21 |
THROMBOELASTOGRAPHY® OF PLATELET POOR PLASMA |
||||
MRTG |
5.35 (± 2.83) |
8.47 (± 4.82) |
0.0013 |
1.21 to 4.79 |
TMRTG |
9.46 (± 4.24) |
7.79 (± 5.02) |
0.0428 |
0.08 to 2.67 |
TTG |
243.89 (± 85.66) |
283.97 (± 116.51) |
0.157 |
-97.47 to 16.3 |
R |
7.2 (± 3.60) |
6.2 (± 4.18) |
0.122 |
-0.2 to 2 |
K |
2.35 (± 0.73) |
1.4 (± 4.23) |
0.0015 |
0.3 to 1.2 |
Angle |
66.85 (± 9.60) |
74.05 (± 8.64) |
< 0.0001 |
-10.6 to -3.9 |
MA |
32.7 (± 8.96) |
36.1 (± 9.67) |
0.15 |
-8.3 to 1.4 |
FIBRIN FIBRE THICKNESS |
n = 1000 |
n = 2000 |
||
Fibre thickness in nm |
110 (± 33.8) |
115 (± 44.18) |
<0.0001 |
6 to 12 |
TEG® RESULTS OF NAÏVE WHOLE BLOOD WITH AND WITHOUT ADDED LPS |
||||
Healthy Whole Blood (n = 10) |
Healthy Whole Blood with added LPS (n = 10) |
|||
MRTG |
2.42 (± 0.41) |
2.835 (± 0.67) |
0.404 |
-0.82 to 0.44 |
TMRTG |
15.04 (± 2.98) |
11.835 (± 1.92) |
0.0003 |
1.66 to 6.25 |
TTG |
605.21 (± 122.53) |
620.89 (± 133.94) |
0.739 |
-135.27 to 81.88 |
R |
10.2 (± 1.01) |
7.1 (± 1.82) |
0.001 |
1.8 to 3.9 |
K |
5.35 (± 1.08) |
5 (± 1.28) |
0.252 |
-0.6 to 1.7 |
ANGLE |
44.8 (± 4.86) |
49.1 (± 2.08) |
0.085 |
-6.5 to 1.1 |
MA |
53.65 (± 5.80) |
55 (± 5.13) |
0.616 |
-4.9 to 3.1 |
GTT® RESULTS OF NAÏVE WHOLE BLOOD WITH AND WITHOUT ADDED LPS |
||||
Healthy Whole Blood (n = 10) |
Healthy Whole Blood with added LPS (n = 10) |
|||
OT |
335.8 (± 80.96) |
354.35 (± 73.66) |
0.481 |
-101.8 to 49 |
LT |
1576 (± 322.24) |
1534.5 (± 155.19) |
0.315 |
-93 to 369 |
Scanning electron microscopy (SEM) of whole blood and platelet poor plasma (PPP) results
Due to the observations that the viscoelastic properties of clot generation were significantly changed as judged using the TEG®, SEM was performed with both whole blood and PPP. Figure 3 shows SEM micrographs from whole blood and PPP of healthy individuals, while Figures 4 and 5 shows examples from AD individuals. Whole blood from healthy individuals typically shows discoid erythrocytes (RBCs), with platelets that are typically discoid, without pseudopodia and a few that are slightly activated, usually due to contact activation [53, 160, 163-165] (Figure 3A). This slight activation, with resulting pseudopodia formation, is due to contact activation [166]. This ultrastructure is in line with our database of thousands of micrographs from healthy individuals. Although, for the current study we used age- and gender-matched healthy individuals, there are not great variations between RBCs and fibrin networks of young and old individuals when they are healthy. RBCs are typically discoid and fibrin fibres typically are seen as individual strands.
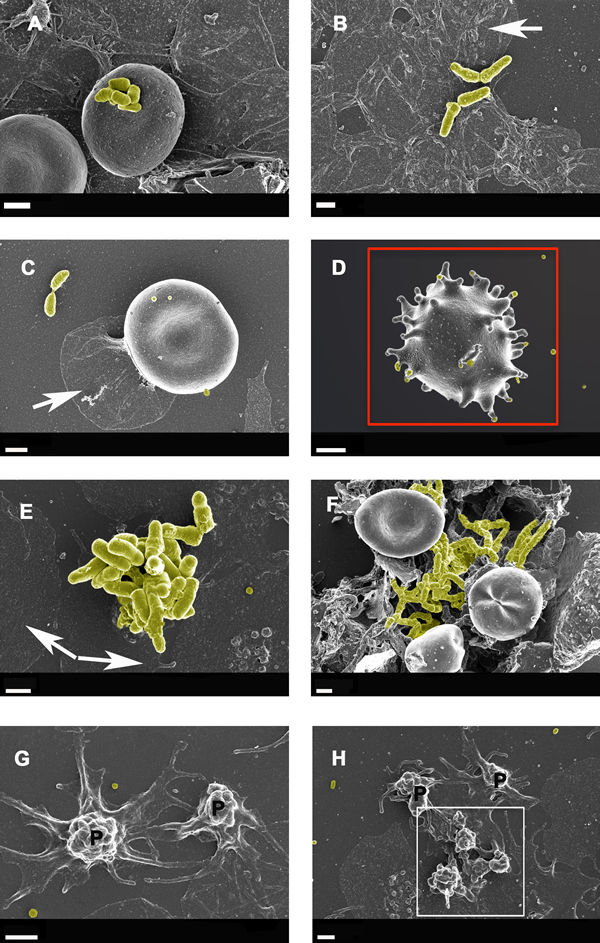
Figure 4: Whole blood smear showing erythrocyte and platelet interactions from Alzheimer-type dementia individuals, with bacterial presence A. to F. Hyperactivated platelets with spreading are shown in G. and H. White arrows show platelet spreading, indicative of inflammation and hyperactivation - this is known to happen in all inflammatory conditions; for a discussion on hyperactivation of platelets see [166]. Blue arrows show matted plasma/fibrin deposits. False yellow colouring was added to emphasize the presence of microbiota. Red block shows eryptotic erythrocyte. P shows partially intact but activated platelets, where spreading is starting happen, and white block surrounds such an activated platelet mass. Scale bars: 1 μm .
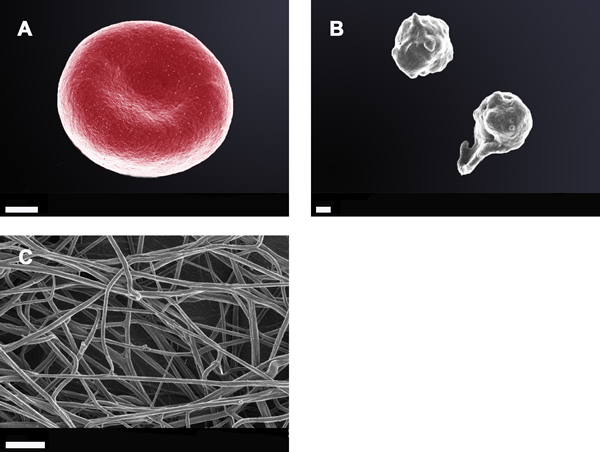
Figure 3: Whole blood smear showing a typical erythrocyte; Scale bar: 1 μm A.; two healthy platelets with slight pseudopodia formation; Scale bar: 300 nm B.; and an extensive fibrin network created by adding thrombin (58 nM thrombin final concentration with plasma) to platelet poor plasma; Scale bar: 1 μm C.
Figures 4 and 5 show extensive fibrin networks from whole blood and PPP for AD individuals. Recently we noted the presence of bacteria inside and around RBCs of AD patients [90]. Figure 4D also shows an example of an eryptotic erythrocyte. The term eryptosis is a type of suicidal death of erythrocytes, that was discovered recently. It is characterized by erythrocyte shrinkage, blebbing, and phospholipid scrambling of the cell membrane. For a detailed discussion on eryptosis see various publications by Lang and Quadri [167] [168] [169, 170]. Previously it was reported in AD, that Amyloid peptides may induce RBC eryptosis.
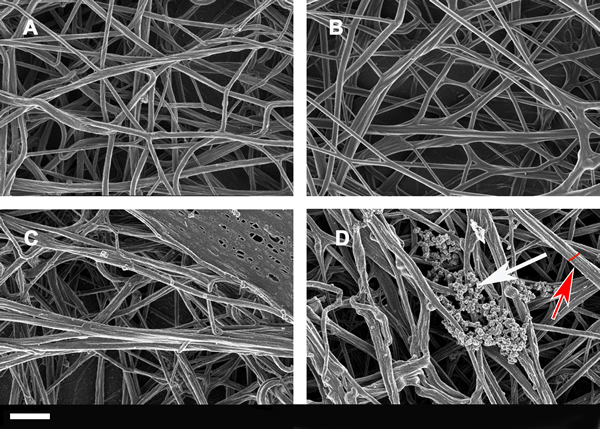
Figure 5: Extensive fibrin networks from two healthy individuals (A and B) and from two Alzheimer-type dementia individuals (C and D) created by adding thrombin to platelet poor plasma. White arrow possibly shows LPS or coagulated plasma proteins, red arrow and red line shows thicker fibrin fiber. Scale bar: 1 μm
In the current, newly collected samples we also found this phenomenon in whole blood of all individuals from our AD sample (Figure 4). Due to the descriptive nature of SEM analysis, any kind of exact estimation of bacterial numbers per volume blood is unfortunately not possible with this method. Platelets were overactivated and showed extreme spreading, as typically seen during systemic inflammation [166, 171, 172].
Due to the presence of (visible) bacteria in whole blood smears, (as seen with electron microscopy) from AD individuals and therefore potentially the presence of cell wall material that they shed, LPS may be one of the culprits, or at least contribute to the hypercoagulability in AD.
Figure 5 shows fibrin fibre networks from two healthy individuals (A and B) and two AD individuals; the networks are created by adding thrombin to plasma. We also performed measurements on the fibrin fibre diameters using ImageJ (ImageJ is a public domain, Java-based image processing program developed at the National Institutes of Health: http://rsbweb.nih.gov/ij/); Table 2 shows the median fibrin fibre diameter and statistical analysis for the healthy and AD individual fibrin fibres (see Figure 6). Previously we noted a significant difference in fibrin fibre thickness in a pilot study where we measured fibrin fibre thickness in platelet rich plasma (PRP) from AD patients with normal and high serum ferritin values [88]. With regard to median fibrin fibre width, the value for the healthy (younger) subjects was 105± 3 nm [58]. These measurements were taken on samples from younger individuals. The high ferritin AD group had a fibre width that was significantly higher than the normal ferritin AD group, with 34% less than the high ferritin group [88]. The current results showed that the median fiber thickness of older healthy individuals was 110 nm (± 34 nm) and the median AD fibre thickness was 115 nm (± 44 nm). There seems to be a linkage between fibre diameter and serum ferritin levels, which were not different in the present samples.
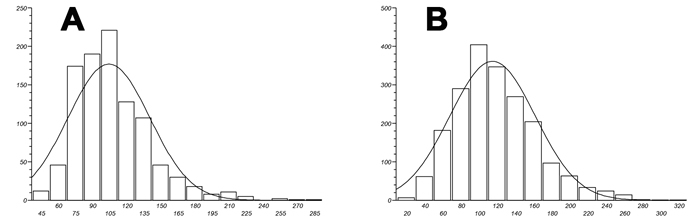
Figure 6: Fibrin fibre thickness (nm) distribution width for both healthy A. and Alzheimer-type dementia individuals B.
GTT® and TEG® analysis with added LPS
Due to the presence of bacteria in the whole blood of AD individuals as seen in the SEM images, we simulated the potential presence of LPS in naïve whole blood from healthy individuals by adding it. A very low final concentration of 0.2 ng.L-1 caused a hypercoagulable state using the TEG® in naïve whole blood when the LPS was added. The TEG® measures the activity of the whole coagulation pathway. The following two parameters were significantly changed to a more hypercoagulable state in when LPS was added to the blood of the healthy individuals:
R value (reaction time in seconds) is shorter with added LPS, showing the time of latency from start of test to initial fibrin formation is decreased.
Time to maximum rate of thrombus generation (TMRTG) is also shorter with added LPS, showing a lowering of the time interval in seconds before maximum velocity of clot growth.
This suggests that added LPS causes quicker and firmer clot generation.
Results from the GTT® showed that added LPS did not have an effect on platelet shear force in the GTT® (seen Table 2). As mentioned previously, this GTT® test measures platelet reactivity (occlusion time, OT), where an OT of less than 300 seconds indicated platelet hyper-reactivity, while one between 300 and 500 indicates normal haemostatic/platelet activity [140]. The median of the OT of the healthy individuals with and without added LPS were in the normal ranges, suggesting that LPS do not affect platelet activity. The GTT also shows the time to lyse (LT), and normal values are less than 2000 seconds. Table 2 shows the median for the healthy individuals are less than 2000 seconds, and that LPS does not cause low thrombotic activity.
One interpretation is that LPS possibly binds (due to its very lipophilic nature) to plasma proteins involved in the coagulation cascade, resulting in the hypercoagulability of naïve whole blood with added LPS. This is supported by the TEG® results. However, measuring OT and LT with the GTT, we see no significant changes between naïve whole blood with and without added LPS (see Table 2). This suggests that LPS does not affect platelet activity.
DISCUSSION
In the current sample we see that the following parameters were significantly different between healthy and Alzheimer-type dementia individuals:
• Iron (free, is less in AD)
• Transferrin (is less in AD)
• Maximum rate of thrombus generation (MRTG),
• Time to maximum rate of thrombus generation (TMRTG) which is the time interval (s) observed before maximum velocity of clot growth,
• Time taken to achieve final clot strength i.e. amplification (K)
• Alpha or Angle representing the speed at which the fibrin build-up and crosslinking of the fibrinogen fibres takes place.
• Fibrin fibre thickness
These results are indicative of increased coagulability in AD, suggesting structural changes in the physical fibrin fibre packaging. The presence of bacteria in whole blood in AD individuals, as seen with SEM as shown in this paper, suggest that LPS, known to be shed from (Gram-negative) bacterial membranes may play a role in the increased coagulability that is seen in AD PPP.
We assessed coagulation of naive blood with and without LPS. TEG® of naïve healthy blood with added LPS showed that it was indeed the case that LPS affects coagulability, as both the
• R value and
• Time to maximum rate of thrombus generation (TMRTG)
showed increased coagulability (due to a shorter time to maximum rate of thrombus generation) and also shorter initial clot formation, where R is also shorter with added LPS. This suggests that added LPS causes quicker and firmer clot generation. This is in line with the hypercoagulability seen in AD individuals. Due to the very variable and often unreliable currently available measurements for LPS in whole blood (for a review see [17], basal LPS levels were not measured in the samples. GTT, which measures only platelet activity, was not affected by the added LPS. These results suggest that LPS does not directly impact platelet function (at least in a controlled experimental environment).
LPS is known to induce inflammation via cytokine activation [173-175], and a characteristic of inflammation is almost always a hypercoagulatory state [58, 176-183]. LPS may also cause hypercoagulation via tissue factor-(TF-) mediated activation of hemostasis in whole blood samples from adults and neonates [184]. TF is also a cytokine. We suggest that there is a third possible route of acute activation by directly binding to plasma proteins involved in the coagulation cascade to cause hypercoagulation. The results presented here support such an acute (fast) reaction.
These results suggest that the clot in AD forms faster, resulting in a firmer clot, reflected in both a decreased time to clot formation and time to maximum firmness of clot. The reason for this changed fibrin structure may be due to a changed fibrinogen packaging during the clot formation, and this changed packaging may be due to the presence of LPS. Future work will seek to establish this directly.
Materials and Methods
Volunteer details and blood collection
Blood samples were obtained from non-smoking Alzheimer-type dementia (AD) patients, identified by a Neurologist and under the care of a medical practitioner. Specifically, care was taken to exclude vascular dementia. We also recruited “healthy” age-matched individuals that did not smoke. It should be noted that the term “healthy” is used in this paper to describe an individual that has does not have dementia. Ethical clearance was obtained from the Health Sciences Ethical committee from the University of Pretoria, and informed consent was obtained from family members who act as carers of the patients. Healthy individuals also filled in consent forms. Blood was collected in two x 4mL citrate tubes, one EDTA tube, and one 4mL clotting tube for iron level determination. This collection and all handling of samples were performed under very strictly aseptic conditions, in order to prevent any microbial contamination of samples.
Statistical analysis
The non-parametric Mann-Whitney U test was adopted to determine P-values using the software StatsDirect (www.statsdirect.com). A p-value of less than 0.05 was considered statistically significant (but cf. e.g. [147, 148]).
Iron tests
Serum ferritin was measured by using the Bio-Rad Laboratories’ QuantImune ferritin IRMA kit that is a single-incubation two-site immunoradiometric assay. In this IRMA, which measures the most basic isoferritin, the highly purified I-labeled antibody to ferritin is the tracer and the ferritin antibodies are immobilized on polyacrylamide beads as the solid phase. Transferrin was measured with the RayBio® Human Transferrin ELISA from RayBiotech. Serum iron was measured with the Iron Assay kit (Colorimetric assay).
Viscoelastic tests using platelet poor plasma (PPP)
Coagulation parameters, using PPP of patients and healthy individuals, were done using thromboelastography® (TEG®). PPP was brought to room temperature and 340 µl was placed in a disposable cup in a computer-controlled TEG® hemostasis system (Model 5000, Hemoscope, Niles, IL), with addition of 20 µl CaCl2 as the last step to initiate clotting. Thrombelastographic data were collected until maximum elastic modulus (MG) is reached or 60 min had elapsed [79, 88, 149-152]. See Table 1 for the parameters that can be obtained when both plasma and whole blood are studied using the TEG®. TEG® is typically used to determine clot formation and clot strength [85].
Scanning electron microscopy (SEM) of whole blood and platelet poor plasma (PPP)
At least 30 minutes after the blood was collected, 10 µl of whole blood were placed directly on a glass cover slip, fixed, dehydrated, dried, mounted and coated with carbon according to previously described methods [155]. Platelet poor plasma (PPP) were obtained and frozen at -80°C. After all samples were collected, PPP were thawed and 10 µl mixed with 5 µl thrombin to create an extensive fibrin network. A Zeiss ULTRA Plus FEG-SEM with InLens capabilities was used to study the surface morphology of erythrocytes, and micrographs were taken at 1kV.
The Global thrombotic test (GTT®) and thromboelastography® (TEG®) on naïve, uncitrated whole blood with and without added LPS (final LPS concentration 0.2 ng.L-1)
As mentioned above, this GTT® test measures platelet reactivity (occlusion time, OT), where an OT of less than 300 seconds indicated platelet hyper-reactivity, while one of between 300 and 500 indicates normal haemostatic/platelet activity [140]. It also shows the time to lyse or lysis time (LT), where an LT of less than 2000 seconds shows a normal spontaneous thrombolytic activity and LT of 2000 to 4000 seconds shows a reduced thrombolytic activity [156]. Due to the physical constraints of this test (naïve, uncitrated blood is drawn and immediately dispensed into the machine, and also mixed with LPS (final concentration: 0.2 ng.L-1 LPS), and incubated for 3 minutes, only the blood of 10 healthy individuals who came into the laboratory for the tests, were used. LPS from Escherichia coli O111:B4 was purchased from Sigma, product number L 2630. Naïve and LPS-treated naïve healthy blood was also tested with the TEG®, without added CaCl2. These tests were done to determine if LPS causes either (1) platelet-induced hypercoagulability or (2) fibrinogen-induced hypercoagulability in healthy blood. This was done to simulate LPS effects, as our hypothesis states that the hypercoagulability seen in AD, together with the presence of increased serum ferritin and low transferrin levels [157], is related to the presence of bacteria in sterile blood, and that these bacteria are visible using SEM.
Acknowledgments
We thank the Biotechnology and Biological Sciences Research Council (grant BB/L025752/1) as well as the National Research Foundation (NRF) of South Africa for supporting this collaboration. This is also a contribution from the Manchester Centre for Synthetic Biology of Fine and Speciality Chemicals (SYNBIOCHEM) (BBSRC grant BB/M017702/1).
Conflicts of interest
The authors have no conflict of interests to declare.
REFERENCES
1. Meraz-Rios MA, Toral-Rios D, Franco-Bocanegra D, Villeda-Hernandez J and Campos-Pena V. Inflammatory process in Alzheimer’s Disease. Frontiers in integrative neuroscience. 2013; 7:59.
2. Zou Z, Liu C, Che C and Huang H. Clinical genetics of Alzheimer’s disease. BioMed research international. 2014; 2014:291862.
3. Kim DH, Yeo SH, Park JM, Choi JY, Lee TH, Park SY, Ock MS, Eo J, Kim HS and Cha HJ. Genetic markers for diagnosis and pathogenesis of Alzheimer’s disease. Gene. 2014; 545(2):185-193.
4. Morris JK, Honea RA, Vidoni ED, Swerdlow RH and Burns JM. Is Alzheimer’s disease a systemic disease? Biochimica et biophysica acta. 2014; 1842(9):1340-1349.
5. Skaper SD. Alzheimer’s disease and amyloid: culprit or coincidence? International review of neurobiology. 2012; 102:277-316.
6. Fargo KN, Aisen P, Albert M, Au R, Corrada MM, DeKosky S, Drachman D, Fillit H, Gitlin L, Haas M, Herrup K, Kawas C, Khachaturian AS, Khachaturian ZS, Klunk W, Knopman D, et al. 2014 Report on the Milestones for the US National Plan to Address Alzheimer’s Disease. Alzheimer’s & dementia : the journal of the Alzheimer’s Association. 2014; 10(5 Suppl):S430-452.
7. Association. As. 2015 Alzheimer’s disease facts and figures. Alzheimer’s & dementia : the journal of the Alzheimer’s Association. 2015; 11(3):332-384.
8. Thériault P, ElAli A and Rivest S. The dynamics of monocytes and microglia in Alzheimer’s disease. Alzheimer’s research & therapy. 2015; 7(1):41.
9. ElAli A and Rivest S. Microglia in Alzheimer’s disease: A multifaceted relationship. Brain, behavior, and immunity. 2015.
10. Steardo L, Jr., Bronzuoli MR, Iacomino A, Esposito G, Steardo L and Scuderi C. Does neuroinflammation turn on the flame in Alzheimer’s disease? Focus on astrocytes. Frontiers in neuroscience. 2015; 9:259.
11. Ben Haim L, Carrillo-de Sauvage MA, Ceyzériat K and Escartin C. Elusive roles for reactive astrocytes in neurodegenerative diseases. Frontiers in cellular neuroscience. 2015; 9:278.
12. von Bernhardi R, Eugenín-von Bernhardi L and Eugenín J. Microglial cell dysregulation in brain aging and neurodegeneration. Frontiers in aging neuroscience. 2015; 7:124.
13. Wang WY, Tan MS, Yu JT and Tan L. Role of pro-inflammatory cytokines released from microglia in Alzheimer’s disease. Annals of translational medicine. 2015; 3(10):136.
14. Denes A, Thornton P, Rothwell NJ and Allan SM. Inflammation and brain injury: acute cerebral ischaemia, peripheral and central inflammation. Brain, behavior, and immunity. 2010; 24(5):708-723.
15. Drake C, Boutin H, Jones MS, Denes A, McColl BW, Selvarajah JR, Hulme S, Georgiou RF, Hinz R, Gerhard A, Vail A, Prenant C, Julyan P, Maroy R, Brown G, Smigova A, et al. Brain inflammation is induced by co-morbidities and risk factors for stroke. Brain, behavior, and immunity. 2011; 25(6):1113-1122.
16. Kell DB, Potgieter M and Pretorius E. Individuality, phenotypic differentiation, dormancy and ‘persistence’ in culturable bacterial systems: commonalities in environmental, laboratory, and clinical microbiology. F1000Review. 2015; In Press.
17. Kell DB and Pretorius E. On the translocation of bacteria and their lipopolysaccharides between blood and peripheral locations in chronic, inflammatory diseases: the central roles of LPS and LPS-induced cell death. Integrative Biology. 2015; online, DOI: 10.1039/c5ib00158g.
18. Kamat PK, Vacek JC, Kalani A and Tyagi N. Homocysteine Induced Cerebrovascular Dysfunction: A Link to Alzheimer’s Disease Etiology. The open neurology journal. 2015; 9:9-14.
19. Jansen WJ, Ossenkoppele R, Knol DL, Tijms BM, Scheltens P, Verhey FR, Visser PJ, Aalten P, Aarsland D, Alcolea D, Alexander M, Almdahl IS, Arnold SE, Baldeiras I, Barthel H, van Berckel BN, et al. Prevalence of cerebral amyloid pathology in persons without dementia: a meta-analysis. JAMA : the journal of the American Medical Association. 2015; 313(19):1924-1938.
20. Reitz C. Alzheimer’s disease and the amyloid cascade hypothesis: a critical review. International journal of Alzheimer’s disease. 2012; 2012:369808.
21. Tang Z, Ioja E, Bereczki E, Hultenby K, Li C, Guan Z, Winblad B and Pei JJ. mTor mediates tau localization and secretion: implication for Alzheimer’s disease. Biochimica et biophysica acta. 2015.
22. Zhu S, Shala A, Bezginov A, Sljoka A, Audette G and Wilson DJ. Hyperphosphorylation of intrinsically disordered tau protein induces an amyloidogenic shift in its conformational ensemble. PLoS One. 2015; 10(3):e0120416.
23. Pimplikar SW. Reassessing the amyloid cascade hypothesis of Alzheimer’s disease. The international journal of biochemistry & cell biology. 2009; 41(6):1261-1268.
24. Herrup K. The case for rejecting the amyloid cascade hypothesis. Nature neuroscience. 2015; 18(6):794-799.
25. Rubio-Perez JM and Morillas-Ruiz JM. A review: inflammatory process in Alzheimer’s disease, role of cytokines. TheScientificWorldJournal. 2012; 2012:756357.
26. Doens D and Fernández PL. Microglia receptors and their implications in the response to amyloid beta for Alzheimer’s disease pathogenesis. Journal of neuroinflammation. 2014; 11:48.
27. McGeer PL and McGeer EG. Innate immunity, local inflammation, and degenerative disease. Science of aging knowledge environment : SAGE KE. 2002; 2002(29):re3.
28. Heneka MT, Carson MJ, Khoury JE, Landreth GE, Brosseron F, Feinstein DL, Jacobs AH, Wyss-Coray T, Vitorica J, Ransohoff RM, Herrup K, Frautschy SA, Finsen B, Brown GC, Verkhratsky A, Yamanaka K, et al. Neuroinflammation in Alzheimer’s disease. Lancet neurology. 2015; 14(4):388-405.
29. Ong WY and Farooqui AA. Iron, neuroinflammation, and Alzheimer’s disease. Journal of Alzheimer’s disease : JAD. 2005; 8(2):183-200; discussion 209-115.
30. Tuppo EE and Arias HR. The role of inflammation in Alzheimer’s disease. The international journal of biochemistry & cell biology. 2005; 37(2):289-305.
31. Tzeng SF, Hsiao HY and Mak OT. Prostaglandins and cyclooxygenases in glial cells during brain inflammation. Current drug targets Inflammation and allergy. 2005; 4(3):335-340.
32. Varley J, Brooks DJ and Edison P. Imaging neuroinflammation in Alzheimer’s and other dementias: Recent advances and future directions. Alzheimer’s & dementia : the journal of the Alzheimer’s Association. 2014.
33. Latta CH, Brothers HM and Wilcock DM. Neuroinflammation in Alzheimer’s disease; A source of heterogeneity and target for personalized therapy. Neuroscience. 2014.
34. Castellani RJ, Moreira PI, Perry G and Zhu X. The role of iron as a mediator of oxidative stress in Alzheimer disease. BioFactors (Oxford, England). 2012; 38(2):133-138.
35. Connor JR, Menzies SL, St Martin SM and Mufson EJ. A histochemical study of iron, transferrin, and ferritin in Alzheimer’s diseased brains. Journal of neuroscience research. 1992; 31(1):75-83.
36. Crichton RR, Dexter DT and Ward RJ. Brain iron metabolism and its perturbation in neurological diseases. Journal of neural transmission (Vienna, Austria : 1996). 2011; 118(3):301-314.
37. Friedman A, Arosio P, Finazzi D, Koziorowski D and Galazka-Friedman J. Ferritin as an important player in neurodegeneration. Parkinsonism & related disorders. 2011; 17(6):423-430.
38. Kell DB. Iron behaving badly: inappropriate iron chelation as a major contributor to the aetiology of vascular and other progressive inflammatory and degenerative diseases. BMC medical genomics. 2009; 2:2.
39. Kell DB. Towards a unifying, systems biology understanding of large-scale cellular death and destruction caused by poorly liganded iron: Parkinson’s, Huntington’s, Alzheimer’s, prions, bactericides, chemical toxicology and others as examples. Archives of toxicology. 2010; 84(11):825-889.
40. Smith MA, Zhu X, Tabaton M, Liu G, McKeel DW, Jr., Cohen ML, Wang X, Siedlak SL, Dwyer BE, Hayashi T, Nakamura M, Nunomura A and Perry G. Increased iron and free radical generation in preclinical Alzheimer disease and mild cognitive impairment. Journal of Alzheimer’s disease : JAD. 2010; 19(1):363-372.
41. Wood H. Alzheimer disease: Iron-the missing link between ApoE and Alzheimer disease? Nature reviews Neurology. 2015; 11(7):369.
42. Ayton S and Faux NG. Ferritin levels in the cerebrospinal fluid predict Alzheimer’s disease outcomes and are regulated by APOE. 2015; 6:6760.
43. Yang H, Guan H, Yang M, Liu Z, Takeuchi S, Yanagisawa D, Vincent SR, Zhao S and Tooyama I. Upregulation of mitochondrial ferritin by proinflammatory cytokines: implications for a role in Alzheimer’s disease. Journal of Alzheimer’s disease : JAD. 2015; 45(3):797-811.
44. Bandyopadhyay S and Rogers JT. Alzheimer’s disease therapeutics targeted to the control of amyloid precursor protein translation: maintenance of brain iron homeostasis. Biochemical pharmacology. 2014; 88(4):486-494.
45. Crespo ÂC, Silva B, Marques L, Marcelino E, Maruta C, Costa S, Timóteo A, Vilares A, Couto FS, Faustino P, Correia AP, Verdelho A, Porto G, Guerreiro M, Herrero A, Costa C, et al. Genetic and biochemical markers in patients with Alzheimer’s disease support a concerted systemic iron homeostasis dysregulation. Neurobiology of aging. 2014; 35(4):777-785.
46. Hadzhieva M, Kirches E and Mawrin C. Review: iron metabolism and the role of iron in neurodegenerative disorders. Neuropathology and applied neurobiology. 2014; 40(3):240-257.
47. Ward RJ, Dexter DT and Crichton RR. Neurodegenerative diseases and therapeutic strategies using iron chelators. Journal of trace elements in medicine and biology : organ of the Society for Minerals and Trace Elements (GMS). 2015; 31:267-273.
48. Collingwood JF and Davidson MR. The role of iron in neurodegenerative disorders: insights and opportunities with synchrotron light. Frontiers in pharmacology. 2014; 5:191.
49. Casadesus G, Smith MA, Zhu X, Aliev G, Cash AD, Honda K, Petersen RB and Perry G. Alzheimer disease: evidence for a central pathogenic role of iron-mediated reactive oxygen species. Journal of Alzheimer’s disease : JAD. 2004; 6(2):165-169.
50. Crapper McLachlan DR, Dalton AJ, Kruck TP, Bell MY, Smith WL, Kalow W and Andrews DF. Intramuscular desferrioxamine in patients with Alzheimer’s disease. Lancet. 1991; 337(8753):1304-1308.
51. Pretorius E, Bester J, Vermeulen N and Lipinski B. Oxidation inhibits iron-induced blood coagulation. Current drug targets. 2013; 14(1):13-19.
52. Pretorius E, Bester J, Vermeulen N, Lipinski B, Gericke GS and Kell DB. Profound morphological changes in the erythrocytes and fibrin networks of patients with hemochromatosis or with hyperferritinemia, and their normalization by iron chelators and other agents. PlosOne. 2014; doi: 10.1371/journal.pone.0085271. eCollection 2014.
53. Pretorius E and Kell DB. Diagnostic morphology: biophysical indicators for iron-driven inflammatory diseases. Integrative Biology. 2014; 6:486-510.
54. Pretorius E and Lipinski B. Differences in Morphology of Fibrin Clots Induced with Thrombin and Ferric Ions and Its Pathophysiological Consequences. Heart, lung & circulation. 2012; 22:447-449.
55. Pretorius E, Vermeulen N, Bester J, Lipinski B and Kell DB. A novel method for assessing the role of iron and its functional chelation in fibrin fibril formation: the use of scanning electron microscopy. Toxicology mechanisms and methods. 2013; 23(5):352-359.
56. Undas A and Ariëns RAS. Fibrin clot structure and function: a role in the pathophysiology of arterial and venous thromboembolic diseases. Arterioscler Thromb Vasc Biol. 2011; 31(12):e88-99.
57. Kell DB and Pretorius E. Serum ferritin is an important inflammatory disease marker, as it is mainly a leakage product from damaged cells. Metallomics. 2014; 4:748-773.
58. Kell DB and Pretorius E. The simultaneous occurrence of both hypercoagulability and hypofibrinolysis in blood and serum during systemic inflammation, and the roles of iron and fibrin(ogen). Integrative Biology. 2015; 7:24-52.
59. Dávalos D and Akassoglou K. Fibrinogen as a key regulator of inflammation in disease. Semin Immunopathol. 2012; 34(1):43-62.
60. Duvoix A, Dickens J, Haq I, Mannino D, Miller B, Tal-Singer R and Lomas DA. Blood fibrinogen as a biomarker of chronic obstructive pulmonary disease. Thorax. 2013; 68(7):670-676.
61. Erikssen G, Liestol K, Bjornholt JV, Stormorken H, Thaulow E and Erikssen J. Erythrocyte sedimentation rate: a possible marker of atherosclerosis and a strong predictor of coronary heart disease mortality. European heart journal. 2000; 21(19):1614-1620.
62. Fries D and Martini WZ. Role of fibrinogen in trauma-induced coagulopathy. British journal of anaesthesia. 2010; 105(2):116-121.
63. Késmárky G, Kenyeres P, Késmárky M and Tóth K. Plasma viscosity: a forgotten variable. Clinical hemorheology and microcirculation. 2008; 39(1-4):243-246.
64. Kolodziejczyk J and Ponczek MB. The role of fibrinogen, fibrin and fibrin(ogen) degradation products (FDPs) in tumor progression. Contemporary oncology (Poznan, Poland). 2013; 17(2):113-119.
65. Pulanic D and Rudan I. The past decade: fibrinogen. Collegium antropologicum. 2005; 29(1):341-349.
66. Cortes-Canteli M, Paul J, Norris EH, Bronstein R, Ahn HJ, Zamolodchikov D, Bhuvanendran S, Fenz KM and Strickland S. Fibrinogen and beta-amyloid association alters thrombosis and fibrinolysis: a possible contributing factor to Alzheimer’s disease. Neuron. 2010; 66(5):695-709.
67. Narayan PJ, Kim SL, Lill C, Feng S, Faull RL, Curtis MA and Dragunow M. Assessing fibrinogen extravasation into Alzheimer’s disease brain using high-content screening of brain tissue microarrays. Journal of neuroscience methods. 2015; 247:41-49.
68. Cortes-Canteli M, Mattei L, Richards AT, Norris EH and Strickland S. Fibrin deposited in the Alzheimer’s disease brain promotes neuronal degeneration. Neurobiology of aging. 2015; 36(2):608-617.
69. Ahn HJ, Glickman JF, Poon KL, Zamolodchikov D, Jno-Charles OC, Norris EH and Strickland S. A novel Abeta-fibrinogen interaction inhibitor rescues altered thrombosis and cognitive decline in Alzheimer’s disease mice. J Exp Med. 2014; 211(6):1049-1062.
70. Walton BL, Byrnes JR and Wolberg AS. Fibrinogen, red blood cells, and factor XIII in venous thrombosis. Journal of thrombosis and haemostasis : JTH. 2015; 13 Suppl 1:S208-215.
71. Ma X, Ji XM, Fu P, Ding YC, Xue Q and Huang Y. Coexistence of High Fibrinogen and Low High-density Lipoprotein Cholesterol Levels Predicts Recurrent Cerebral Venous Thrombosis. Chinese medical journal. 2015; 128(13):1732-1737.
72. Ahmed MS, Jadhav AB, Hassan A and Meng QH. Acute Phase Reactants as Novel Predictors of Cardiovascular Disease. ISRN inflammation. 2012; 2012:953461.
73. Ariëns RAS. Fibrin(ogen) and thrombotic disease. J Thromb Haemost. 2013; 11 Suppl 1:294-305.
74. Barr JD, Chauhan AK, Schaeffer GV, Hansen JK and Motto DG. Red blood cells mediate the onset of thrombosis in the ferric chloride murine model. Blood. 2013; 121(18):3733-3741.
75. Day SM, Duquaine D, Mundada LV, Menon RG, Khan BV, Rajagopalan S and Fay WP. Chronic iron administration increases vascular oxidative stress and accelerates arterial thrombosis. Circulation. 2003; 107(20):2601-2606.
76. Franchini M, Targher G, Montagnana M and Lippi G. Iron and thrombosis. Annals of hematology. 2008; 87(3):167-173.
77. Lipinski B and Pretorius E. Iron-Induced Fibrin in Cardiovascular Disease. Current neurovascular research. 2013.
78. Lipinski B, Pretorius E, Oberholzer HM and van der Spuy WJ. Interaction of fibrin with red blood cells: the role of iron. Ultrastruct Pathol. 2012; 36(2):79-84.
79. Nielsen VG and Pretorius E. Iron-enhanced coagulation is attenuated by chelation A thrombelastographic and ultrastructural analysis. Blood coagulation & fibrinolysis : an international journal in haemostasis and thrombosis. 2014; 25(8):845-850.
80. Singh N, Haldar S, Tripathi AK, McElwee MK, Horback K and Beserra A. Iron in Neurodegenerative Disorders of Protein Misfolding: A Case of Prion Disorders and Parkinson’s Disease. Antioxidants & redox signaling. 2014.
81. Pretorius E, Oberholzer HM, van der Spuy WJ and Meiring JH. Smoking and coagulation: the sticky fibrin phenomenon. Ultrastruct Pathol. 2010; 34(4):236-239.
82. Pretorius E, Oberholzer HM, van der Spuy WJ, Swanepoel AC and Soma P. Scanning electron microscopy of fibrin networks in rheumatoid arthritis: a qualitative analysis. Rheumatology international. 2012; 32(6):1611-1615.
83. Pretorius E, Swanepoel AC, Oberholzer HM, Van Der Spuy WJ, Duim W and Wessels PF. A descriptive investigation of the ultrastructure of fibrin networks in thrombo-embolic ischemic stroke. Journal of thrombosis and thrombolysis. 2011; 31(4):507-513.
84. Pretorius E, Vermeulen N, Bester J and Lipinski B. Novel use of scanning electron microscopy for detection of iron-induced morphological changes in human blood. Microsc Res Tech. 2013; 76(3):268-271.
85. Swanepoel AC, Nielsen VG and Pretorius E. Viscoelasticity and Ultrastructure in Coagulation and Inflammation: Two Diverse Techniques, One Conclusion. Inflammation eprint (ahead of print). 2015.
86. van Rooy M, Duim W, Ehlers R, Buys AV and Pretorius E. Platelet hyperactivity and fibrin clot structure in metabolic syndrome-induced transient ischemic attack: a microscopy and thromboelastography® study. . Cardiovascular diabetology. 2015; Accepted.
87. Nielsen VG and Pretorius E. Iron and carbon monoxide enhance coagulation and attenuate fibrinolysis by different mechanisms. Blood coagulation & fibrinolysis : an international journal in haemostasis and thrombosis. 2014; 25(7):695-702.
88. Nielsen VG, Pretorius E, Bester J, Jacobsen WK, Boyle PK and Reinhard JP. Carbon monoxide and iron modulate plasmatic coagulation in Alzheimer’s disease. Current neurovascular research. 2015; 12(1):31-39.
89. Lipinski B and Pretorius E. Novel pathway of iron-induced blood coagulation: implications for diabetes mellitus and its complications. Polskie Archiwum Medycyny Wewnetrznej. 2012; 122(3):115-122.
90. Potgieter M, Bester J, Kell DB and Pretorius E. The dormant blood microbiome in chronic, inflammatory diseases. FEMS microbiology reviews. 2015:pii: fuv013.
91. Kaprelyants AS, Gottschal JC and Kell DB. Dormancy in non-sporulating bacteria. FEMS microbiology reviews. 1993; 10(3-4):271-285.
92. Kell DB, Kaprelyants AS, Weichart DH, Harwood CR and Barer MR. Viability and activity in readily culturable bacteria: a review and discussion of the practical issues. Antonie van Leeuwenhoek. 1998; 73(2):169-187.
93. Shaik MM, Ahmad S, Gan SH, Abuzenadah AM, Ahmad E, Tabrez S, Ahmed F and Kamal MA. How do periodontal infections affect the onset and progression of Alzheimer’s disease? CNS & neurological disorders drug targets. 2014; 13(3):460-466.
94. Honjo K, van Reekum R and Verhoeff NP. Alzheimer’s disease and infection: do infectious agents contribute to progression of Alzheimer’s disease? Alzheimer’s & dementia : the journal of the Alzheimer’s Association. 2009; 5(4):348-360.
95. de Souza Rolim T, Fabri GM, Nitrini R, Anghinah R, Teixeira MJ, de Siqueira JT, Cestari JA and de Siqueira SR. Oral infections and orofacial pain in Alzheimer’s disease: a case-control study. Journal of Alzheimer’s disease : JAD. 2014; 38(4):823-829.
96. Miklossy J. Alzheimer’s disease - a neurospirochetosis. Analysis of the evidence following Koch’s and Hill’s criteria. Journal of neuroinflammation. 2011; 8:90.
97. Itzhaki RF. Herpes simplex virus type 1 and Alzheimer’s disease: increasing evidence for a major role of the virus. Frontiers in aging neuroscience. 2014; 6:202.
98. Hill JM, Bhattacharjee S, Pogue AI and Lukiw WJ. The gastrointestinal tract microbiome and potential link to Alzheimer’s disease. Frontiers in neurology. 2014; 5:43.
99. Hill JM, Clement C, Pogue AI, Bhattacharjee S, Zhao Y and Lukiw WJ. Pathogenic microbes, the microbiome, and Alzheimer’s disease (AD). Frontiers in aging neuroscience. 2014; 6:127.
100. Hill JM and Lukiw WJ. Microbial-generated amyloids and Alzheimer’s disease (AD). Frontiers in aging neuroscience. 2015; 7:9.
101. Kamer AR, Dasanayake AP, Craig RG, Glodzik-Sobanska L, Bry M and de Leon MJ. Alzheimer’s disease and peripheral infections: the possible contribution from periodontal infections, model and hypothesis. Journal of Alzheimer’s disease : JAD. 2008; 13(4):437-449.
102. Gaur S and Agnihotri R. Alzheimer’s disease and chronic periodontitis: Is there an association? Geriatrics & gerontology international. 2014.
103. Farhad SZ, Amini S, Khalilian A, Barekatain M, Mafi M, Barekatain M and Rafei E. The effect of chronic periodontitis on serum levels of tumor necrosis factor-alpha in Alzheimer disease. Dental research journal. 2014; 11(5):549-552.
104. Sparks Stein P, Steffen MJ, Smith C, Jicha G, Ebersole JL, Abner E and Dawson D, 3rd. Serum antibodies to periodontal pathogens are a risk factor for Alzheimer’s disease. Alzheimer’s & dementia : the journal of the Alzheimer’s Association. 2012; 8(3):196-203.
105. Kamer AR, Craig RG, Dasanayake AP, Brys M, Glodzik-Sobanska L and de Leon MJ. Inflammation and Alzheimer’s disease: possible role of periodontal diseases. Alzheimer’s & dementia : the journal of the Alzheimer’s Association. 2008; 4(4):242-250.
106. Singhrao SK, Harding A, Simmons T, Robinson S, Kesavalu L and Crean S. Oral inflammation, tooth loss, risk factors, and association with progression of Alzheimer’s disease. Journal of Alzheimer’s disease : JAD. 2014; 42(3):723-737.
107. Poole S, Singhrao SK, Kesavalu L, Curtis MA and Crean S. Determining the presence of periodontopathic virulence factors in short-term postmortem Alzheimer’s disease brain tissue. Journal of Alzheimer’s disease : JAD. 2013; 36(4):665-677.
108. Miklossy J. Historic evidence to support a causal relationship between spirochetal infections and Alzheimer’s disease. Frontiers in aging neuroscience. 2015; 7:46.
109. Ransmayr GN, Holliger S, Schletterer K, Heidler H, Deibl M, Poewe W, Madersbacher H and Kiss G. Lower urinary tract symptoms in dementia with Lewy bodies, Parkinson disease, and Alzheimer disease. Neurology. 2008; 70(4):299-303.
110. Eriksson I, Gustafson Y, Fagerstrom L and Olofsson B. Urinary tract infection in very old women is associated with delirium. International psychogeriatrics / IPA. 2011; 23(3):496-502.
111. Ogama N, Yoshida M, Nakai T, Niida S, Toba K and Sakurai T. Frontal white matter hyperintensity predicts lower urinary tract dysfunction in older adults with amnestic mild cognitive impairment and Alzheimer’s disease. Geriatrics & gerontology international. 2015.
112. Asti A and Gioglio L. Can a bacterial endotoxin be a key factor in the kinetics of amyloid fibril formation? Journal of Alzheimer’s disease : JAD. 2014; 39(1):169-179.
113. Kanekiyo T, Xu H and Bu G. ApoE and Abeta in Alzheimer’s disease: accidental encounters or partners? Neuron. 2014; 81(4):740-754.
114. Schmidt V, Carlo AS and Willnow TE. Apolipoprotein E receptor pathways in Alzheimer disease. Wiley interdisciplinary reviews Systems biology and medicine. 2014; 6(3):255-270.
115. Wang C, Yu JT, Wang HF, Jiang T, Tan CC, Meng XF, Soares HD and Tan L. Meta-analysis of peripheral blood apolipoprotein E levels in Alzheimer’s disease. PLoS One. 2014; 9(2):e89041.
116. Šerý O, Hlinecká L, Balcar VJ, Janout V and Povova J. Diabetes, hypertension and stroke - does Alzheimer protect you? Neuro endocrinology letters. 2015; 35(8):691-696.
117. Rodriguez GA, Tai LM, LaDu MJ and Rebeck GW. Human APOE4 increases microglia reactivity at Abeta plaques in a mouse model of Abeta deposition. Journal of neuroinflammation. 2014; 11:111.
118. Saura J, Petegnief V, Wu X, Liang Y and Paul SM. Microglial apolipoprotein E and astroglial apolipoprotein J expression in vitro: opposite effects of lipopolysaccharide. Journal of neurochemistry. 2003; 85(6):1455-1467.
119. Cunningham C, Wilcockson DC, Campion S, Lunnon K and Perry VH. Central and systemic endotoxin challenges exacerbate the local inflammatory response and increase neuronal death during chronic neurodegeneration. The Journal of neuroscience : the official journal of the Society for Neuroscience. 2005; 25(40):9275-9284.
120. Lee JW, Lee YK, Yuk DY, Choi DY, Ban SB, Oh KW and Hong JT. Neuro-inflammation induced by lipopolysaccharide causes cognitive impairment through enhancement of beta-amyloid generation. Journal of neuroinflammation. 2008; 5:37.
121. Herrera AJ, Tomás-Camardiel M, Venero JL, Cano J and Machado A. Inflammatory process as a determinant factor for the degeneration of substantia nigra dopaminergic neurons. Journal of neural transmission (Vienna, Austria : 1996). 2005; 112(1):111-119.
122. De Pablos RM, Herrera AJ, Villaran RF, Cano J and Machado A. Dopamine-dependent neurotoxicity of lipopolysaccharide in substantia nigra. FASEB journal : official publication of the Federation of American Societies for Experimental Biology. 2005; 19(3):407-409.
123. Byler SL, Boehm GW, Karp JD, Kohman RA, Tarr AJ, Schallert T and Barth TM. Systemic lipopolysaccharide plus MPTP as a model of dopamine loss and gait instability in C57Bl/6J mice. Behav Brain Res. 2009; 198(2):434-439.
124. Kelly LP, Carvey PM, Keshavarzian A, Shannon KM, Shaikh M, Bakay RA and Kordower JH. Progression of intestinal permeability changes and alpha-synuclein expression in a mouse model of Parkinson’s disease. Movement disorders : official journal of the Movement Disorder Society. 2014; 29(8):999-1009.
125. Hoban DB, Connaughton E, Connaughton C, Hogan G, Thornton C, Mulcahy P, Moloney TC and Dowd E. Further characterisation of the LPS model of Parkinson’s disease: a comparison of intra-nigral and intra-striatal lipopolysaccharide administration on motor function, microgliosis and nigrostriatal neurodegeneration in the rat. Brain, behavior, and immunity. 2013; 27(1):91-100.
126. Hritcu L and Ciobica A. Intranigral lipopolysaccharide administration induced behavioral deficits and oxidative stress damage in laboratory rats: relevance for Parkinson’s disease. Behav Brain Res. 2013; 253:25-31.
127. Hritcu L, Ciobica A, Stefan M, Mihasan M, Palamiuc L and Nabeshima T. Spatial memory deficits and oxidative stress damage following exposure to lipopolysaccharide in a rodent model of Parkinson’s disease. Neuroscience research. 2011; 71(1):35-43.
128. Tufekci KU, Genc S and Genc K. The endotoxin-induced neuroinflammation model of Parkinson’s disease. Parkinson’s disease. 2011; 2011:487450.
129. Zhan X, Cox C, Ander BP, Liu D, Stamova B, Jin LW, Jickling GC and Sharp FR. Inflammation Combined with Ischemia Produces Myelin Injury and Plaque-Like Aggregates of Myelin, Amyloid-beta and AbetaPP in Adult Rat Brain. Journal of Alzheimer’s disease : JAD. 2015.
130. Deng X, Li M, Ai W, He L, Lu D, Patrylo PR, Cai H, Luo X, Li Z and Yan X. Lipolysaccharide-Induced Neuroinflammation Is Associated with Alzheimer-Like Amyloidogenic Axonal Pathology and Dendritic Degeneration in Rats. Advances in Alzheimer’s disease. 2014; 3(2):78-93.
131. Xu Z, Wu J, Zheng J, Ma H, Zhang H, Zhen X, Zheng LT and Zhang X. Design, synthesis and evaluation of a series of non-steroidal anti-inflammatory drug conjugates as novel neuroinflammatory inhibitors. International immunopharmacology. 2015; 25(2):528-537.
132. de Punder K and Pruimboom L. Stress induces endotoxemia and low-grade inflammation by increasing barrier permeability. Frontiers in immunology. 2015; 6:223.
133. Zhang XY, Cao JB, Zhang LM, Li YF and Mi WD. Deferoxamine attenuates lipopolysaccharide-induced neuroinflammation and memory impairment in mice. Journal of neuroinflammation. 2015; 12(1):20.
134. Daulatzai MA. Role of stress, depression, and aging in cognitive decline and Alzheimer’s disease. Current topics in behavioral neurosciences. 2014; 18:265-296.
135. Jain NK, Patil CS, Kulkarni SK and Singh A. Modulatory role of cyclooxygenase inhibitors in aging- and scopolamine or lipopolysaccharide-induced cognitive dysfunction in mice. Behav Brain Res. 2002; 133(2):369-376.
136. Davis DH, Skelly DT, Murray C, Hennessy E, Bowen J, Norton S, Brayne C, Rahkonen T, Sulkava R, Sanderson DJ, Rawlins JN, Bannerman DM, MacLullich AM and Cunningham C. Worsening cognitive impairment and neurodegenerative pathology progressively increase risk for delirium. The American journal of geriatric psychiatry : official journal of the American Association for Geriatric Psychiatry. 2015; 23(4):403-415.
137. Chu AJ, Rauci M, Nwobi OI, Mathews ST and Beydoun S. Novel anticoagulant activity of polyamino acid offsets bacterial endotoxin-induced extrinsic hypercoagulation: downregulation of monocytic tissue factor-dependent FVII activation. Journal of cardiovascular pharmacology. 2003; 42(4):477-483.
138. Chu AJ, Wang ZG, Raicu M, Beydoun S and Ramos N. Protamine inhibits tissue factor-initiated extrinsic coagulation. British journal of haematology. 2001; 115(2):392-399.
139. Slotta JE, Braun OO, Menger MD and Thorlacius H. Central role of rho kinase in lipopolysaccharide-induced platelet capture on venous endothelium. Journal of investigative medicine : the official publication of the American Federation for Clinical Research. 2008; 56(4):720-725.
140. Gorog DA and Jeong YH. Platelet function tests: why they fail to guide personalized antithrombotic medication. Journal of the American Heart Association. 2015; 4(5).
141. Yamamoto J, Inoue N, Otsui K, Ishii H and Gorog DA. Global Thrombosis Test (GTT) can detect major determinants of haemostasis including platelet reactivity, endogenous fibrinolytic and thrombin generating potential. Thrombosis research. 2014; 133(5):919-926.
142. Ghanim H, Abuaysheh S, Sia CL, Korzeniewski K, Chaudhuri A, Fernandez-Real JM and Dandona P. Increase in plasma endotoxin concentrations and the expression of Toll-like receptors and suppressor of cytokine signaling-3 in mononuclear cells after a high-fat, high-carbohydrate meal: implications for insulin resistance. Diabetes care. 2009; 32(12):2281-2287.
143. Opal SM, Scannon PJ, Vincent JL, White M, Carroll SF, Palardy JE, Parejo NA, Pribble JP and Lemke JH. Relationship between plasma levels of lipopolysaccharide (LPS) and LPS-binding protein in patients with severe sepsis and septic shock. The Journal of infectious diseases. 1999; 180(5):1584-1589.
144. Zweigner J, Gramm HJ, Singer OC, Wegscheider K and Schumann RR. High concentrations of lipopolysaccharide-binding protein in serum of patients with severe sepsis or septic shock inhibit the lipopolysaccharide response in human monocytes. Blood. 2001; 98(13):3800-3808.
145. Leante-Castellanos JL, de Guadiana-Romualdo LG, Fuentes-Gutierrez C, Hernando-Holgado A, Garcia-Gonzalez A and Jimenez-Santos E. The value of lipopolysaccharide binding protein for diagnosis of late-onset neonatal sepsis in very low birth weight infants. Journal of perinatal medicine. 2015; 43(2):253-257.
146. Funderburg NT, Stubblefield Park SR, Sung HC, Hardy G, Clagett B, Ignatz-Hoover J, Harding CV, Fu P, Katz JA, Lederman MM and Levine AD. Circulating CD4(+) and CD8(+) T cells are activated in inflammatory bowel disease and are associated with plasma markers of inflammation. Immunology. 2013; 140(1):87-97.
147. Broadhurst D and Kell DB. Statistical strategies for avoiding false discoveries in metabolomics and related experiments. Metabolomics. 2006; 2:171-196.
148. Leek JT and Peng RD. Statistics: P values are just the tip of the iceberg. Nature. 2015; 520(7549):612.
149. Nielsen VG, Kirklin H.K., Hoogendoorn H, Ellis T.C., Holman W.L. Thromboelastographic method to quantify the contribution of factor XIII to coagulation kinetics. Blood coagulation & Fibrinolysis: an international journal in haemostasis and thrombosis. 2007; 18(2):145-150.
150. Nielsen VG. Beyond cell based models of coagulation: analyses of coagulation with clot “lifespan” resistance-time relationships. Thrombosis research. 2008; 122(2):145-152.
151. Nielsen VG, Gurley WQ and Burch TM. The Impact of Factor XIII on Coagulation Kinetics and Clot Strength Determined by Thrombelastography. Anesthesia & Analgesia. 2004; 99(1):120-123.
152. Nielsen VG, Lyerly RT and Gurley WQ. The effect of dilution on plasma coagulation kinetics determined by thrombelastography is dependent on antithrombin activity and mode of activation. Anesthesia and analgesia. 2004; 99(6):1587-1592.
153. Haemonetics. (2011). TEG 5000 Hemostasis analyzer system. (Massachusetts: Haemonetics Corporation).
154. Nielsen VG, Audu P, Cankovic L, Lyerly RT, 3rd, Steenwyk BL, Armstead V and Powell G. Qualitative thrombelastographic detection of tissue factor in human plasma. Anesthesia and analgesia. 2007; 104(1):59-64.
155. Buys AV, Van Rooy MJ, Soma P, Van Papendorp D, Lipinski B and Pretorius E. Changes in red blood cell membrane structure in type 2 diabetes: a scanning electron and atomic force microscopy study. Cardiovascular diabetology. 2013; 12(1):25.
156. Saraf S, Christopoulos C, Salha IB, Stott DJ and Gorog DA. Impaired endogenous thrombolysis in acute coronary syndrome patients predicts cardiovascular death and nonfatal myocardial infarction. Journal of the American College of Cardiology. 2010; 55(19):2107-2115.
157. Hare DJ, Doecke JD, Faux NG, Rembach A, Volitakis I, Fowler CJ, Grimm R, Doble PA, Cherny RA, Masters CL, Bush AI and Roberts BR. Decreased plasma iron in Alzheimer’s disease is due to transferrin desaturation. ACS chemical neuroscience. 2015; 6(3):398-402.
158. Brandhagen DJ, Fairbanks VF and Baldus W. Recognition and management of hereditary hemochromatosis. American family physician. 2002; 65(5):853-860.
159. Barton JC, McDonnell SM, Adams PC, Brissot P, Powell LW, Edwards CQ, Cook JD and Kowdley KV. Management of hemochromatosis. Hemochromatosis Management Working Group. Annals of internal medicine. 1998; 129(11):932-939.
160. Bester J, Buys AV, Lipinski B, Kell DB and Pretorius E. High ferritin levels have major effects on the morphology of erythrocytes in Alzheimer’s disease. Frontiers in aging neuroscience. 2013; doi: 10.3389/fnagi.2013.00088. eCollection 2013.
161. Ritchie RF, Palomaki GE, Neveux LM, Navolotskaia O, Ledue TB and Craig WY. Reference distributions for the negative acute-phase serum proteins, albumin, transferrin and transthyretin: a practical, simple and clinically relevant approach in a large cohort. Journal of clinical laboratory analysis. 1999; 13(6):273-279.
162. Giometto B, Argentiero V, Sanson F, Ongaro G and Tavolato B. Acute-phase proteins in Alzheimer’s disease. European neurology. 1988; 28(1):30-33.
163. Pretorius E, Swanepoel AC, Buys AV, Vermeulen N, Duim W and Kell DB. Eryptosis as a marker of Parkinson’s disease. Aging-US. 2014; 6:788-818.
164. Pretorius E, Vermeulen N, Bester J, du Plooy JL and Gericke GS. The effect of iron overload on red blood cell morphology. The Lancet. 2014; 383:722.
165. Pretorius E. The adaptability of red blood cells. Cardiovascular diabetology. 2013; 12:63.
166. van Rooy M and Pretorius E. Metabolic syndrome, platelet activation and the development of transient ischemic attack or thromboembolic stroke. Thrombosis research. 2015; 135(3):434-442.
167. Lang F and Qadri SM. Mechanisms and significance of eryptosis, the suicidal death of erythrocytes. Blood purification. 2012; 33(1-3):125-130.
168. Lang E, Qadri SM and Lang F. Killing me softly - suicidal erythrocyte death. The international journal of biochemistry & cell biology. 2012; 44(8):1236-1243.
169. Qadri SM, Kucherenko Y, Zelenak C, Jilani K, Lang E and Lang F. Dicoumarol activates Ca2+-permeable cation channels triggering erythrocyte cell membrane scrambling. Cellular physiology and biochemistry : international journal of experimental cellular physiology, biochemistry, and pharmacology. 2011; 28(5):857-864.
170. Qadri SM, Bauer J, Zelenak C, Mahmud H, Kucherenko Y, Lee SH, Ferlinz K and Lang F. Sphingosine but not sphingosine-1-phosphate stimulates suicidal erythrocyte death. Cellular physiology and biochemistry : international journal of experimental cellular physiology, biochemistry, and pharmacology. 2011; 28(2):339-346.
171. Pretorius E, Oberholzer HM, van der Spuy WJ, Swanepoel AC and Soma P. Qualitative scanning electron microscopy analysis of fibrin networks and platelet abnormalities in diabetes. Blood coagulation & fibrinolysis : an international journal in haemostasis and thrombosis. 2011; 22(6):463-467.
172. Van Der Spuy WJ and Pretorius E. A place for ultrastructural analysis of platelets in cerebral ischemic research. Microsc Res Tech. 2013; 76(8):795-802.
173. Ai Q, Jing Y, Jiang R, Lin L, Dai J, Che Q, Zhou D, Jia M, Wan J and Zhang L. Rotenone, a mitochondrial respiratory complex I inhibitor, ameliorates lipopolysaccharide/D-galactosamine-induced fulminant hepatitis in mice. International immunopharmacology. 2014; 21(1):200-207.
174. Alpsoy S, Akyuz A, Erfan G, Akkoyun DC, Topcu B, Guzel S, Kaya S and Kulac M. Atherosclerosis, some serum inflammatory markers in psoriasis. Giornale italiano di dermatologia e venereologia : organo ufficiale, Societa italiana di dermatologia e sifilografia. 2014; 149(2):167-175.
175. Amar J, Lange C, Payros G, Garret C, Chabo C, Lantieri O, Courtney M, Marre M, Charles MA, Balkau B, Burcelin R and Group DESIRS. Blood microbiota dysbiosis is associated with the onset of cardiovascular events in a large general population: the D.E.S.I.R. study. PLoS One. 2013; 8(1):e54461.
176. Aksu G, Ozturk C, Kavakli K, Genel F and Kutukculer N. Hypercoagulability: interaction between inflammation and coagulation in familial Mediterranean fever. Clinical rheumatology. 2007; 26(3):366-370.
177. Anžej S, Božič M, Antovič A, Peternel P, Gašperšič N, Rot U, Tratar G and Stegnar M. Evidence of hypercoagulability and inflammation in young patients long after acute cerebral ischaemia. Thrombosis research. 2007; 120(1):39-46.
178. Arshad F, Lisman T and Porte RJ. Hypercoagulability as a contributor to thrombotic complications in the liver transplant recipient. Liver international : official journal of the International Association for the Study of the Liver. 2013; 33(6):820-827.
179. Choi G, Schultz MJ, Levi M and van der Poll T. The relationship between inflammation and the coagulation system. Swiss Med Wkly. 2006; 136(9-10):139-144.
180. Cicala C and Cirino G. Linkage between inflammation and coagulation: an update on the molecular basis of the crosstalk. Life sciences. 1998; 62(20):1817-1824.
181. Conway EM. Thrombomodulin and its role in inflammation. Semin Immunopathol. 2012; 34(1):107-125.
182. Emsley HC and Tyrrell PJ. Inflammation and infection in clinical stroke. Journal of cerebral blood flow and metabolism : official journal of the International Society of Cerebral Blood Flow and Metabolism. 2002; 22(12):1399-1419.
183. Esmon CT. The interactions between inflammation and coagulation. British journal of haematology. 2005; 131(4):417-430.
184. Koch L, Hofer S, Weigand MA, Frommhold D and Poeschl J. Lipopolysaccharide-induced activation of coagulation in neonatal cord and adult blood monitored by thrombelastography. Thrombosis research. 2009; 124(4):463-467.