
INTRODUCTION
The MYC families of proteins are transcription factors with essential roles in cell growth and proliferation through their ability to regulate gene expression [1, 2]. Activation or amplification of the MYC oncogene family is one of the most frequent events associated with cancer [2]. c-MYC is frequently activated in acute myeloid leukemia (AML), and plays an important role in the induction of leukemogenesis [3, 4]. High c-MYC expression, a result of activating mutations in the Flt3 receptor tyrosine kinase, correlates with poor prognosis in AML [5, 6]. c-MYC is also frequently reported to be upregulated in acute lymphoblastic leukemia (ALL), however, the correlation of c-MYC expression with clinical features of ALL has not been fully described. The cause of c-MYC overexpression in adult ALL is also unknown.
MYCBP2 is likely an E3 ubiquitin ligase that binds specifically to MYC [7]. The region in MYC, which is responsible for MYCBP2 interaction, is frequently mutated in Burkitt’s and AIDS-associated lymphomas, indicating MYCBP2 suppress MYC activity [7]. Moreover, recently it is found that MiR-1247-5p overexpression resulted in a decreased expression of MYCBP2 in prostate cancer [8]. Additionally, it is reported that MYCBP2 is a candidate for the transformation-associated gene that maps to the 13q22.3 locus in Angioimmunoblastic T-cell lymphoma (AITL) [9]. However both the expression of MYCBP2 and its correlation with clinical features are unknown in ALL.
IKZF1 (Ikaros) encodes a kruppel-like zinc finger protein that is essential for normal hematopoiesis and acts as a tumor suppressor in ALL. The impairment of Ikaros function, as a result of deletion and/or inactivating mutation of a single IKZF1 allele, is linked to the development of ALL that is characterized by a high rate of relapse and poor outcome. Therefore, Ikaros inactivation results in high-risk leukemia that is resistant to treatment. Ikaros exerts its anti-tumor effect by regulation of its target genes. Ikaros activates or represses expression of target genes by directly recruiting the NuRD/Mi2 or SWI/SNF chromatin remodeling complexes [10]. CK2 directly phosphorylate Ikaros, which results in suppression of its activity [11–14]. Recently we found that CK2 inhibition restores Ikaros function in ALL cells (15, 16). CK2 inhibitors can be used as Ikaros activator (15, 16). We also identified Ikaros binding profiling in ALL cells (15), and found that Ikaros exert its antitumor effect by regulating the expression of its gene targets (15); and CK2 inhibitors restore Ikaros function by increasing Ikaros binding to the gene targets and regulation of their expression in ALL cells [15, 16].
Here, we observed the expression of c-MYC and MYCBP2 and their correlation with clinical features in adult ALL. We found c-MYC expression is negatively correlated with MYCBP2 expression in ALL; and high c-MYC expression and/or low MYCBP2 expression is associated with high-risk leukemia. We also observed the obvious Ikaros binding peaks in promoter region of c-MYC and MYCBP2 in ALL cells by ChIP-seq, and found that Ikaros directly suppresses c-MYC and activates MYCBP2 expression. Our results suggest that Ikaros dysfunction is partially responsible for the changes of c-MYC and MYCBP2 in adult ALL.
RESULTS
Association of c-MYC expression with characteristics of adult ALL
We assessed c-MYC mRNA expression in 104 newly diagnosed adult B-ALL and 47 T-ALL patients. We found that c-MYC expression is significantly higher in both B-ALL and T-ALL patients compared to normal control (Fig. 1A). Patients were divided into high (n = 66) and low (n = 85) c-MYC expression groups. Patients with high c-MYC expression showed higher median white blood cell counts (WBC) (64.9 × 10⁹/L vs 30.9 × 10⁹/L, P = 0.009), a higher percentage of CD33(+) cells (58.7% vs 35.4%, P = 0.006), and a lower complete remission (CR) rate (82.3% vs 95.8%, P = 0.010) than those with low c-MYC expression (Supplemental Table 1, Fig. 1C). The percentage of patients exhibiting splenomegaly, liver infiltration, and increased lactate dehydrogenase (LDH) was significantly higher in the high c-MYC expression group than in the low expression group (53.0% vs 36.1%, P = 0.039; 34.8% vs 15.5%, P = 0.006; 49.2% vs 31.2%, P = 0.033) (Supplemental Table 1, Fig. 1D). The high c-MYC expression group had a significantly lower median PLT and high median BM blast than the low c-MYC expression group (38.0 vs 46.0, P = 0.035; 90.4% vs 84.4%, P = 0.006) (supplemental Table 1, Fig. 1D and 1E). No significant differences in c-MYC expression were observed with age, sex, or peripheral blood blasts. These data indicate that high c-MYC expression is associated with high-risk ALL.
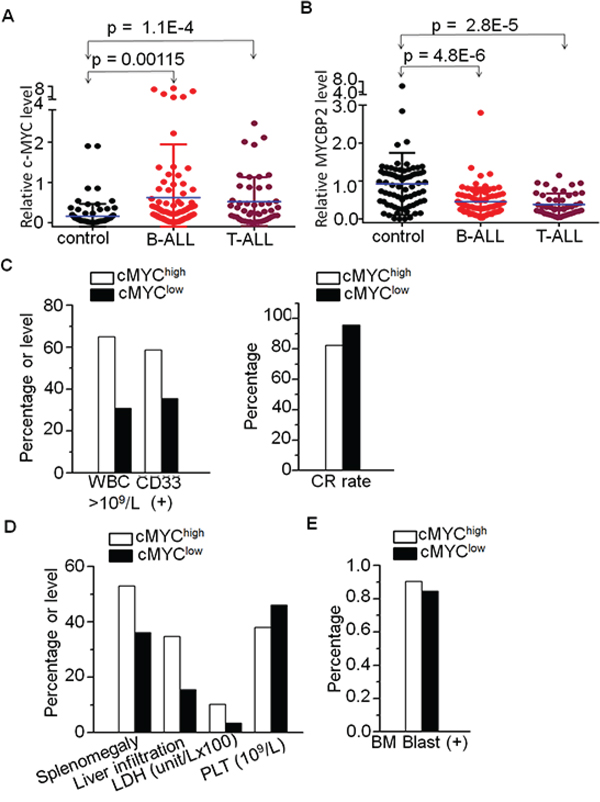
Figure 1: High c-MYC and low MYCBP2 expression and correlation with clinical features in ALL patients. A. Comparison of c-MYC expression in B-ALL and T-ALL with normal BM control; B. Comparison of MYCBP2 expression in B-ALL and T-ALL with normal BM control; C. Correlation of high c-MYC expression with high risk factors (high WBC, CD13+ cells, and low CR rate); D–E. Correlation of high c-MYC expression with proliferation indicators.
Association of MYCBP2 expression with characteristics of adult ALL
We also assessed MYCBP2 mRNA expression in 85 and 46 newly diagnosed adult B-ALL and T-ALL patients, respectively. We found that MYCBP2 expression is significantly lower in both B-ALL and T-ALL patients when compared to normal control (Fig. 1B). Patients were divided into high (n = 65) and low (n = 66) MYCBP2 expression groups. The high expression group showed lower median WBC counts (30.2 × 10⁹/L vs 46.5 × 10⁹/L, P = 0.025), a lower median percentage of CD33(+) cells (32.3% vs 57.1%, P = 0.004) and bone marrow blasts (87.2% vs 88.8%, P = 0.042) than the low expression group (Supplemental Table 2). The percentage of patients exhibiting splenomegaly and liver infiltration was significantly higher in the low MYCBP2 expression group than in the high expression group (54.3% vs 35.9%, P = 0.033; 35.7% vs 15.4%, P = 0.007) (Supplemental Table 2). No significant differences in MYCBP2 expression were observed with age, sex, or CR rate. These data indicated that low MYCBP2 expression is to some extent associated with high-risk ALL.
Association of c-MYChighMYCBP2low expression with characteristics of adult ALL
We also observed that c-MYC mRNA expression is negatively correlated with MYCBP2 expression in the ALL patients (Supplemental Fig. 1A). We analyzed the correlation of c-MYC with MYCBP2 in other reported cohorts [16, 17] and found that c-MYC expression is negatively correlated with MYCBP2 expression (Supplemental Fig. 1B). We also observed the c-MYC is interacts with MYCBP2 in ALL cells (Supplemental Fig. 2). We further compared the clinical features of patients with both high c-MYC expression and low MYCBP2 expression (c-MYChighMYCBP2low) with that of patients with both low c-MYC expression and high MYCBP2 expression (c-MYClowMYCBP2high). Our data showed that c-MYChighMYCBP2low patients showed higher median WBC counts (101.5 × 10⁹/L vs 29.4 × 10⁹/L, P = 0.007), a higher percentage of CD34(+) and CD33(+) cells (90.0% vs 61.3%, P = 0.025; 80.0% vs 25.8%, P = 0.000), and a lower CR rate (60.0% vs 92.0%, P = 0.027) than c-MYClowMYCBP2high patients (supplemental Table 3, Fig. 2A and 2B). The percentage of patients exhibiting splenomegaly, liver infiltration, increased LDH (>1000 u/L) and BM blasts was significantly higher in the c-MYChighMYCBP2low group than in the c-MYClowMYCBP2high group (75.0% vs 33.3%, P = 0.004; 75.0% vs 19.4%, P = 0.000; 70.0% vs 29.0%, P = 0.004, 93.6% vs 80.2%, P = 0.001) (supplemental Table 3, Fig. 2C and 2D). The c-MYChighMYCBP2low group had a significantly lower median PLT than the c-MYClowMYCBP2high group (16.5% vs 39.0%, P = 0.013) (Supplemental Table 3, Fig. 2C). No significant differences between the two groups were observed with age, sex, or peripheral blood blasts. These data indicate that c-MYC high expression with MYCBP2 low expression is correlated with high-risk ALL.
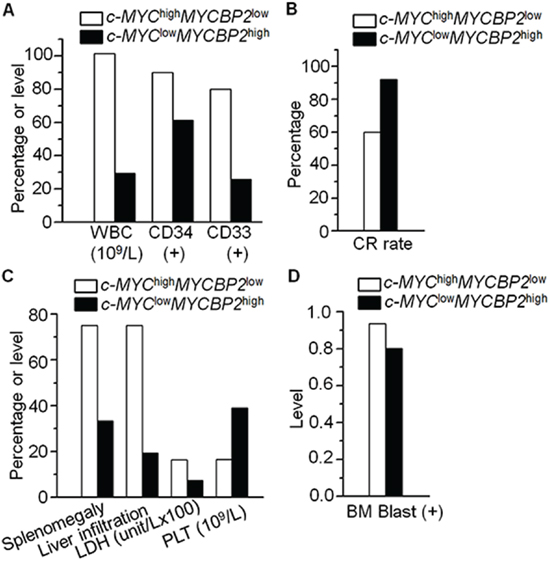
Figure 2: Correlation of c-MYChigh MYCBP2low expression with clinical features in ALL. A–B. Comparison of high risk factors (high WBC, CD34+, CD33+) (A) and low CR rate (B) in patients with c-MYChigh MYCBP2low expression with those in patients with c-MYClow MYCBP2high expression; C–D. Comparison of percentage or level of splenomegaly, liver infiltration, LDH and PLT (C) and BM blast (D) in these two patients’ groups.
Ikaros binds to the promoter of c-MYC and MYCBP2 and regulate their expression
In order to understand how c-MYC and MYCBNP2 expression are regulated in ALL, we analyzed the transcription factor motifs in the promoter region of c-MYC and MYCBP2. We identified strong Ikaros binding motifs in the promoter region of each gene. c-MYC is reported to be a direct target of Ikaros. Our Ikaros ChIP-seq data also showed strong Ikaros binding peaks in the promoter region of both c-MYC and MYCBP2 (Fig. 3A and 3B). We explored the binding of Ikaros on the promoter regions of c-MYC and MYCBP2 by qChIP and found that Ikaros significantly binds to their promoter regions in Nalm6 B-ALL and Molt4 T-ALL cells (Fig. 3C and 3D), and CEM T-ALL cells (data not show). We further observed that Ikaros suppresses the promoter activity of c-MYC and activates that of MYCBP2 by luciferase reporter assay (Fig. 4A); and Ikaros knockdown block Ikaros-induced effect on the promoter activity of c-MYC and MYCBP2 (Supplemental Fig. 3). These data indicated that direct effect of Ikaros on transcription of c-MYC and MYCBP2. Moreover, expression of Ikaros suppressed c-MYC mRNA level and increased MYCBP2 mRNA level in both Nalm6 and CEM cells (Fig. 4B and 4C), and this effect was observed in protein level (Supplemental Fig. 4A). Conversely, Ikaros knockdown induced an increase in c-MYC expression and a decrease in MYCBP2 expression in Nalm6 (Fig. 5A) and CEM cells (Fig. 5B). The efficient knockdown for Ikaros was evidenced in mRNA level (Right panel for Fig. 5A and 5B) and protein level (Supplemental Fig. 4B). Treatment of Nalm6 and CEM cells with Ikaros activator, TBB (CK2 inhibitor) could suppress c-MYC expression and increase MYCBP2 expression in a dose-dependent manner (Fig. 5C and 5D). Ikaros knockdown with shRNA could block the TBB-induced decrease in c-MYC expression and increase in MYCBP2 expression (Fig. 5E and 5F). These data indicate that both c-MYC and MYCBP2 are direct Ikaros targets in ALL and Ikaros regulates their expression.
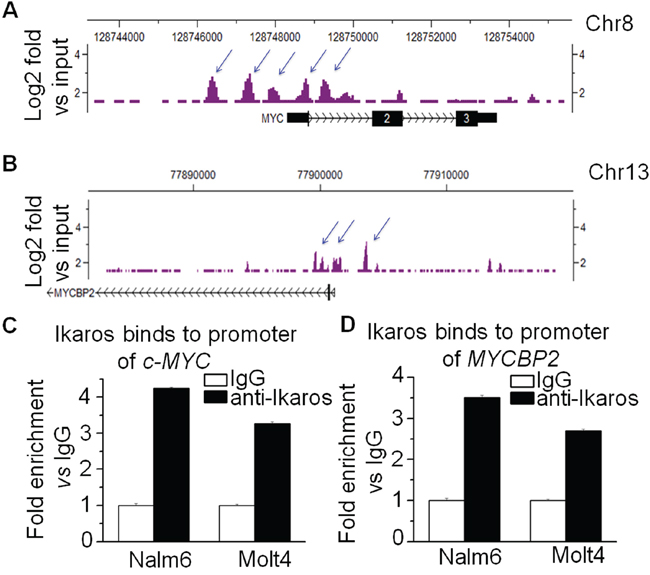
Figure 3: Ikaros binds the promoters of c-MYC and MYCBP2. A–B. Ikaros binding peaks on the promoter of c-MYC (A) and of MYCBP2 (B) C–D. Ikaros binds to the promoter of c-MYC (C) and MYCBP2 (D) in Nalm6 B-ALL and Molt4 T-ALL cells by qChIP assay.
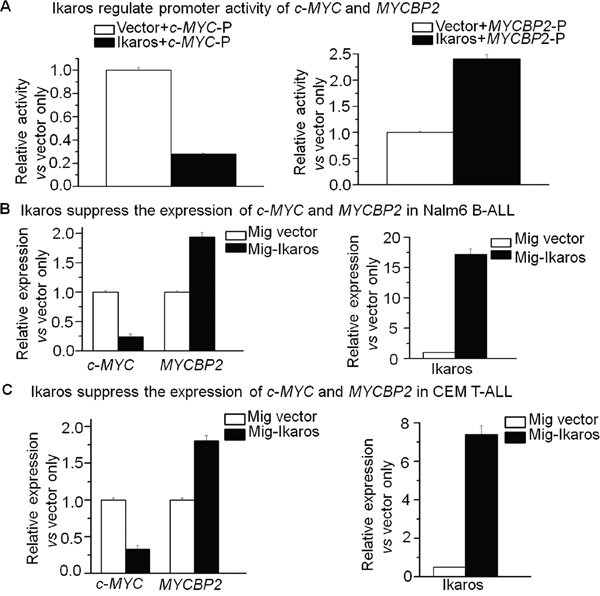
Figure 4: Ikaros suppresses the transcription of c-MYC and MYCBP2. A. The promoter activity of c-MYC and MYCBP2 promoters by luciferase reporter assay following transfection with Ikaros or control vector in HEK293 cells; C-MYC-p: c-MYC promoter; MYCBP2-p: MYCBP2 promoter; B–C. Expression of Ikaros target genes (c-MYC and MYCBP2) in Nalm6 cells (B) and CEM T-ALL cells (C) transduced with vector containing Ikaros as compared to control vector.
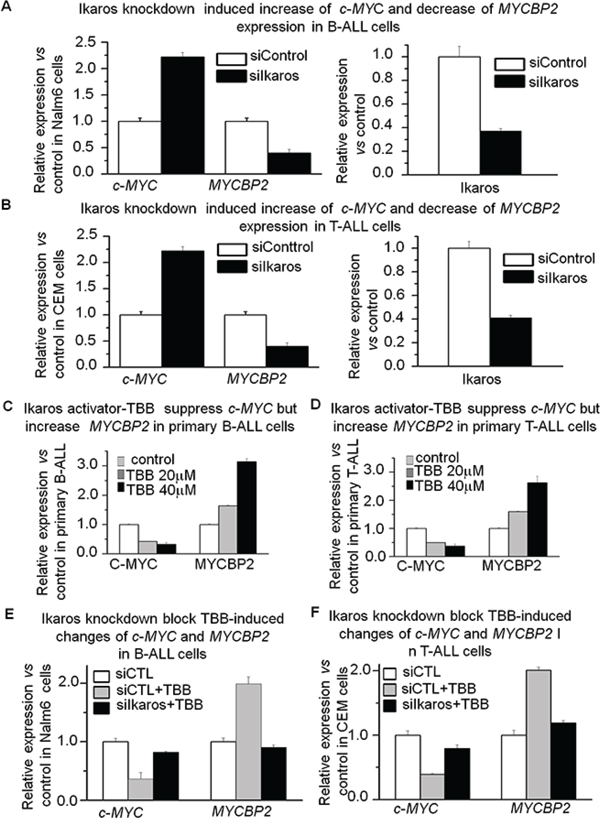
Figure 5: Ikaros knockdown induces upregulation of c-MYC and downregulation of MYCBP2. A–B. qRT-PCR of c-MYC, MYCBP2, and Ikaros expression in Nalm6 cells (A) and CEM cells (B) following Ikaros shRNA treatment as compared to scramble shRNA cells. Gene expression is determined by RT-qPCR using total RNA isolated from the cells transfected with scramble shRNA (siControl) or Ikaros shRNA (siIkaros) for 2 days; C. Effect of Ikaros activator (CK2 inhibitor, TBB) on expression of c-MYC and MYCBP2 in primary B-ALL (C) and primary T-ALL D. cells with TBB treatment for 2 days; E–F. Ikaros knockdown rescues the TBB-induced change of c-MYC and MYCBP2 in Nalm6 (E) and CEM (F) cells.
c-MYC and MYCBP2 expression in patients with an Ikaros deletion
We explored Ikaros mRNA level by qPCR in our cohort study, and analyzed the correlation of Ikaros expression with clinical feature in the patients (Supplemental Table 4). We found that patients with low Ikaros expression showed higher median WBC counts (64.9 × 10⁹/L vs 29.5 × 10⁹/L, P = 0.016), higher percentage of CD13(+) cells (57.1% vs 33.3%, P = 0.009) and CD33 (+) cells (60.0% vs 40.5%, P = 0.033), higher percentage of liver infiltration and splenomegaly (41.5% vs 11.4%, P = 0.000; 56.6% vs 34.6%, P = 0.013) and lower CR rate (79.2% vs 94.3%, P = 0.013) than those with high Ikaros expression. These data indicated that low Ikaros expression, as that of high c-MYC and low MYCBP2 is correlated with high-risk ALL.
In order to further explore the relationship of Ikaros with c-MYC and MYCBP2 expression, we observed Ikaros binding to their promoters in primary B-ALL and T-ALL cells (Fig. 6A and 6B). We analyzed the correlation of Ikaros expression with that of c-MYC or MYCBP2 in the reported cohort of B-ALL or T-ALL patients [17–19], and found that Ikaros expression is negatively correlated with high c-MYC expression and low MYCBP2 expression in both B-ALL (Supplemental Fig. 5A and 5B) and T-ALL (Supplemental Fig. 6A and 6B). We also analyzed the correlation of Ikaros mRNA level with that of c-MYC and MYCBP2 in our cohort study, and found that Ikaros is negatively correlated with c-MYC expression and positively correlated with MYCBP2 expression (Supplemental Fig. 7A and 7B). Importantly, c-MYC expression was significantly increased and MYCBP2 expression significantly decreased in patients with Ikaros deletion compared to that of Ikaros wild type (Fig. 6C and 6D). These data further demonstrated a regulatory effect of Ikaros on both c-MYC and MYCBP2 in ALL patients and suggested that Ikaros deletion is one of the reasons for high c-MYC and low MYCBP2 expression in the patients. Additionally, TBB can suppress c-MYC expression and increase MYCBP2 expression in primary B-ALL (Fig. 6E) and T-ALL (Fig. 6F). This data not only indicated the effect of Ikaros activator on their expression, but also suggested that Ikaros-induced changes of c-MYC/MYCBP2 expression is at least partially responsible for the success of CK2 inhibitors in ALL therapy.
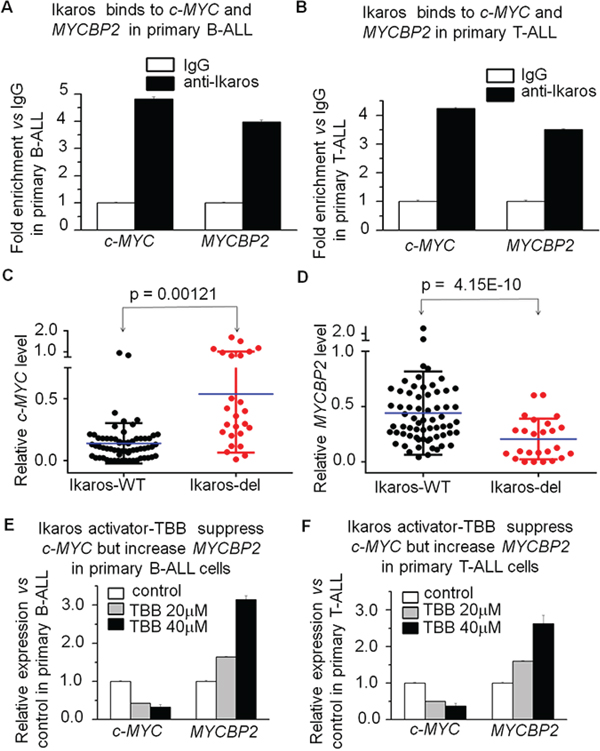
Figure 6: Ikaros binds to the c-MYC and MYCBP2 promoters and Ikaros deletion results in changes of their expression in primary ALL cells. A–B. Ikaros binding to the promoters of c-MYC and MYCBP2 in primary B-ALL (A) and T-ALL (B) cells; C–D. comparison of c-MYC (C) and MYCBP2 (D) in patients with or without Ikaros deletion; E–F. Effect of Ikaros activator (CK2 inhibitor, TBB) on expression of c-MYC and MYCBP2 in primary B-ALL(E) and T-ALL (F) cells with TBB treatment for 2 days.
DISCUSSION
Our findings indicate the significance of high c-MYC, low MYCBP2 and low Ikaros expression in ALL patients, also demonstrate c-MYC and MYCBP2 is the direct target of Ikaros and reveal a model for the oncogenic effect of an Ikaros/MYCBP2/c-MYC axis in adult ALL. Ikaros dysfunction results in the upregulation of c-MYC and downregulation of MYCBP2. This is the first report shows that Ikaros dysfunction results in the increase of c-MYC and decrease of MYCBP2, as well as a negative correlation between c-MYC and MYCBP2 in ALL patients.
MYC, as one of the key transcription factors in hematopoiesis, is frequently overexpressed in human acute lymphoblastic and myeloid leukemia [20–27]. We observed a significant increase in c-MYC mRNA in adult B-ALL and T-ALL compared to that in normal bone marrow. We also observed that high c-MYC expression is correlated with proliferation markers such as splenomegaly, liver infiltration, high LDH and BM blasts, and high-risk ALL factors: high WBC, CD33+ cells, and low CR rates. These findings indicate the oncogenic effect of high c-MYC expression.
The expression of MYCBP2 in ALL is not well determined. Here, we observed a significant decreased MYCBP2 expression in B-ALL and T-ALL patients. Low MYCBP2 expression is correlated with both proliferation markers and high-risk factors for ALL. We also observed a negative correlation between c-MYC and MYCBP2 expression. More importantly, c-MYChighMYCBP2low patients showed higher median WBC counts, higher percentage of CD34(+) and CD33(+) cells, higher rate of splenomegaly, liver infiltration, increased LDH, and lower CR rate compared with that of c-MYClowMYCBP2high patients. These data indicate that high c-MYC and low MYCBP2 expression have a synergistic oncogenic effect in ALL patients.
In human ALL, upregulation of c-MYC has been reported through chromosome translocations [28], aberrant c-MYC stability [29], and genetic gene fusion [6, 30]. We also reported that high LEF1 expression increases c-MYC expression in ALL [31]. Ikaros is reported to inhibit pre-B cell proliferation by suppression of c-MYC expression [32]. Here, we found c-MYC expression is significantly increased in patients with an Ikaros deletion; and c-MYC expression is negatively correlated with Ikaros expression in ALL patients in the cohort studies. These data indicated that Ikaros plays an important role in the suppression of c-MYC expression in ALL, and that Ikaros deletion is one of the major reasons for high c-MYC expression in ALL patients. Moreover, Ikaros also induces MYCBP2 expression. Ikaros expression is positively correlated with MYCBP2 expression in ours and the other reported cohort studies. We also observed that MYCBP2 expression is significantly increased in patients with an Ikaros deletion. These data indicated that Ikaros dysfunction is an important mechanism underlying low MYCBP2 expression in the patients.
Our results also showed that Ikaros binds to c-MYC and MYCBP2 promoter, directly suppresses or increase their promoter activity, and further results in the changes of their expression in ALL cells. As a transcription factor, Ikaros regulates gene expression by recruiting the NuRD/Mi-2 or SWI/SNF chromatin remodeling complexes [10, 15, 37]. Whether Ikaros regulating c-MYC and MYCBP2 expression through chromatin remodeling needs to be further clarified.
CK2 inhibitor, TBB as an indirect Ikaros activator, inhibits c-MYC expression and promotes MYCBP2 expression in an Ikaros-dependent manner. CK2 inhibitors are reported to be potential therapies for leukemia [15, 13, 33]. Therefore, our data suggests that CK2 inhibitors exert their anti-leukemia effect through Ikaros-mediated suppression of c-MYC expression and activation of MYCBP2 expression.
Interestingly, we observed a negative correlation between c-MYC and MYCBP2 expression. We also found that c-MYC expression is negatively correlated with MYCBP2 expression in microarray data of ALL patients from other cohort studies. MYCBP2 is a large protein that binds specifically to MYC [7]. The mechanism underlying the negative correlation needs to be clarified further. However, MYCBP2 as an ubiquitin ligase may directly downregulate c-MYC protein. We did observe c-MYC is associated with MYCBP2 in ALL cells. Ikaros-induced low MYCBP2 expression might further increase the c-MYC protein level in the patients.
In conclusion, we observed that c-MYC expression is significantly increased and MYCBP2 expression significantly decreased in adult ALL patients. High c-MYC and/or low MYCBP2 or low Ikaros expression is correlated with high-risk leukemia. Ikaros dysfunction is one of the underlying reasons for high c-MYC and low MYCBP2 expression in ALL patients. Our data reveals the oncogenic effect of an Ikaros/MYCBP2/c-MYC axis in adult ALL, and suggests a mechanism by which CK2 inhibitors exert their anti-leukemia effect.
MATERIALS AND METHODS
Patients and samples
BM samples [90 male, 61 female; median age 32 (14–77) years old] with ALL (104 B-ALL, 47 T-ALL) were collected from 151 patients between June 2008 and June 2014 at the First Affiliated Hospital of Nanjing Medical University. The ALL diagnosis was made according to the cytogenetic, morphologic, immunophenotypic, and molecular criteria of WHO Diagnosis and Classification of ALL (2008). Written informed consent was provided before enrollment in the study by all patients in accordance with the Declaration of Helsinki. The cohort study was also approved by the Institutional Review Board of the Nanjing Medical University.
Cytogenetic and molecular analyses
Conventional cytogenetic analysis was performed at the time of diagnosis by using unstimulated short-term cultures according to the recommendations of the International System for Human Cytogenetic Nomenclature (ISCN). At least 20 bone marrow metaphase cells were analyzed for each sample.
Flow cytometry was performed on fresh pretreatment BM samples for immunophenotypic analyses. A cell-surface antigen was defined as positive when fluorescence intensity of at least 20% of cells exceeded fluorescence of negative control as previously described [31].
Cell culture reagents, plasmid construction, and retroviral gene transfer
Nalm6 and MOLT4 cells were obtained from the American Type Culture Collection (ATCC, Manassas, VA) and cultured in RPMI 1640 medium (Cellgro) supplemented with 10% fetal bovine serum (Hyclone). HEK 293T cells were cultured in DMEM (Cellgro) supplemented with 10% fetal calf serum and 1% L-glutamine (Cellgro). Cells were incubated at 37°C in a humidified atmosphere of 5% CO2. Primary human B-ALL and T-ALL cells were cultured in RPMI 1640 medium (Cellgro) supplemented with 10% fetal bovine serum (Hyclone). Cells were cultured with or without TBB and collected for total RNA isolation. Human HA-tagged Ikaros (IKZF1) retroviral construct and retroviral production was described previously [11, 12, 34].
Luciferase assay
The pGL3 luciferase reporter construct for the c-MYC promoter was previously reported [31] and the pGL3-MYCBP2 promoter construct was purchased from Addgene. Transient luciferase assays were performed in HEK293T cells using Promega luciferase assay reagents and measured with a luminometer following the manufacturer’s instructions. Luciferase activity was calculated as fold change relative to values obtained from pGL vector only control cells and expressed as a percentage of pcDNA 3.1-Ikaros transfection-induced luciferase activity versus that of pcDNA3.1 vector alone. All transfection and reporter assays were performed independently, in triplicate, at least three times.
For Ikaros knockdown, the same amount of Ikaros shRNA were transfected with the Ikaros and promoter constructs, and the resulting promoter activity was compared to that with scramble shRNA control.
Real time-PCR
Total RNA was isolated using the RNeasy Mini Kit (QIAGEN). A 1 μg aliquot of RNA was reverse transcribed using the SuperScript™ First-Strand Synthesis System for RT-PCR Kit (Invitrogen). qRT-PCR was performed with qSTAR SYBR Master Mix (OriGene) using a StepOne Plus real-time PCR system (Applied Biosystems). Each experiment was performed in triplicate.
c-MYC and MYCBP2 expression in patient samples was quantitated similarly by the formula achieved with serial dilutions of their plasmids as template standards as previously reported [31]. Gene expression values of c-MYC or MYCBP2 were achieved in each patient by a formula obtained with a scatter graph of the Ct values from the serial dilutions of template plasmid as previously reported [31, 35]. The expression level of c-MYC or MYCBP2 was subsequently normalized to 18s RNA and expressed as gene expression value of c-MYC or MYCBP2/18s RNA.
All the patients were divided into high and low c-MYC/MYCBP2 expression groups (Q3-4 vs Q1-2, respectively), which was determined by SPSS 17.0.
The qPCR for c-MYC and MYCBP2 expression was performed in Nalm6 and Molt4 cells transfected with Ikaros. The results were normalized to those obtained with 18sRNA and presented as fold induction over vector controls. Primers: 18s RNA, Sense: 5′-GTAACCCGTTGAACCCCATT-3′, Antisense: 5′-CCATCCAATCGGTAGTAGCG-3′; c-MYC Sense: 5′-AATGAAAAGGCCCCCAAGGTAGTTATCC-3′, Anti-sense: 5′-GTCGTTTCCGCAACAAGTCCTCTTC-3′; MYCBP2 Sense: 5′-TCACAGTGCAAG AAGGATACCAAA-3′, Anti-sense: 5′-TGAAAGC CAGCATCGTTCTTAGTC-3′.
Quantitative chromatin immunoprecipitation (qChIP)
qChIP assays were performed by incubation of the chromatin with antibodies against Ikaros and normal rabbit IgG (Abcam) as control [16]. Enrichment of the ChIP sample over input was evaluated by qPCR with three or more replicates, using specific primers in the promoter region of c-MYC (forward: 5′-AGGGGA AGGGAGGGGAAGGGAAAG-3′, reverse: 5′-CCCTTTCCTCCCCTCCCCTCCT-3′) and MYCBP2 (forward: 5′-GGTTTTCTCTGCCTTAAACTCTGAA-3′, reverse: 5′-GCTGCCAACAGGAAGATTTACTG-3′). The relative concentration of the qPCR product was presented as the fold change of the level of DNA in Ikaros samples in comparison to controls.
Ikaros shRNA knockdown
Nalm6 cells were transiently transfected with human Ikaros shRNA constructs in the GFP vector (pGFP-v-RS) (Origene) using the Neon Transfection System (Invitrogen). The 29-mer scrambled shRNA cassette in the pGFP-VRS vector was also used as a control. After transfection for 1 day, Nalm6 and CEM cells with transfection efficiency around 80% (green cells) and greater than 95% cell viability were further treated with 20 μM TBB or vehicle control (0.01% DMSO) for 2 days and harvested for total RNA isolation. Knockdown of Ikaros was confirmed by measurement of Ikaros mRNA level using qPCR. Primers: IKZF1-F:5′-ggcgcggtgctcctcct-3′, IKZF1-R: 5′-tccgacacgccctacgaca-3′
Co-immunoprecipitation and western blot
Nuclear extracts from Nalm6 and CEM cells were prepared as previous reported [36]. Nuclear extracts were precleared with protein A-Sepharose beads. The precleared extracts were incubated with 5 μg of antibody to c-Myc or MYCBP2 or normal rabbit IgG control for 2 hours, and then added the pre-washed protein A-Sepharose beads at 4°C overnight. Immunoprecipitated complexes were extensively washed with lysis buffer and then boiled in SDS sample buffer for 10 minutes. The immunoprecipitation products were run on SDS-PAGE and transferred to the membrane.
For western blot, membranes were blocked with 5% nonfat dry milk at room temperature for 1 hour and then incubated overnight at 4°C with primary antibody (anti-c-MYC, 1:500, Sigma; anti-MYCBP2; 1:1000, Abcam). After being washed, the membrane was incubated with goat anti-rabbit IgG conjugated to horseradish peroxidase (1:3000) at room temperature for 2 hours. The blots were developed by the enhanced chemiluminescence technique (ECL Plus, Amersham, Arlington Heights, IL) according to the manufacturer’s instructions.
Statistical analysis
Patients were divided into high and low c-MYC or MYCBP2 expression groups (Q3-4 vs Q1-2, respectively). For quantitative parameters, overall differences between the cohorts were evaluated using a Mann – Whitney U-test. For qualitative parameters, overall group differences were analyzed using a χ2 test. All statistical analyses were performed using the SPSS 17.0 and P < 0.05 was considered statistically significant.
The experimental data are shown as the mean value with bars representing the standard error of the mean (S.E.M.). Determinations of statistical significance were performed using a Student t-test for comparisons of two groups or using analysis of variance (ANOVA) for comparing multiple groups. The P < 0.05 was considered statistically significant.
CONFLICTS OF INTEREST
All the authors have no conflicts of interest to declare.
GRANT SUPPORT
This work is supported by The National Natural Science Foundation of China (81270613,30973376); Jiangsu Province Key Medical Talents (RC2011077); The Scientific Research Foundation for the Returned Overseas Chinese Scholars, State Education Ministry (39th); China Postdoctoral Science Foundation (20090461134); Special grade of the financial support from China Postdoctoral Science Foundation (201003598); The Six Great Talent Peak Plan of Jiangsu (2010-WS-024); The Scientific Research Foundation for the Returned Overseas Chinese Scholars, Nanjing Municipal Bureau of Personnel (2009) (to Z.G.); also supported partially by Four diamond foundation of Pennsylvania State University, USA (to S.D. and C.S.).
REFERENCES
1. Adhikary S, Eilers M. Transcriptional regulation and transformation by Myc proteins. Nature reviews Molecular cell biology. 2005; 6:635–45.
2. Muller J, Eilers M. Ubiquitination of Myc: proteasomal degradation and beyond. Ernst Schering Foundation symposium proceedings. 2008; 99–113.
3. Hoffman B, Amanullah A, Shafarenko M, Liebermann DA. The proto-oncogene c-myc in hematopoietic development and leukemogenesis. Oncogene. 2002; 21:3414–21.
4. Renneville A, Roumier C, Biggio V, Nibourel O, Boissel N, Fenaux P, et al. Cooperating gene mutations in acute myeloid leukemia: a review of the literature. Leukemia. 2008; 22:915–31.
5. Gilliland DG, Griffin JD. The roles of FLT3 in hematopoiesis and leukemia. Blood. 2002; 100:1532–42.
6. Muller-Tidow C, Steffen B, Cauvet T, Tickenbrock L, Ji P, Diederichs S, et al. Translocation products in acute myeloid leukemia activate the Wnt signaling pathway in hematopoietic cells. Molecular and cellular biology. 2004; 24:2890–904.
7. Guo Q, Xie J, Dang CV, Liu ET, Bishop JM. Identification of a large Myc-binding protein that contains RCC1-like repeats. Proceedings of the National Academy of Sciences of the United States of America. 1998; 95:9172–7.
8. Scaravilli M, Porkka KP, Brofeldt A, Annala M, Tammela T, Jenster GW, et al. MiR-1247-5p is overexpressed in castration resistant prostate cancer and targets MYCBP2. The Prostate. 2015; 75:798–805.
9. Fujiwara SI, Yamashita Y, Nakamura N, Choi YL, Ueno T, Watanabe H, et al. High-resolution analysis of chromosome copy number alterations in angioimmunoblastic T-cell lymphoma and peripheral T-cell lymphoma, unspecified, with single nucleotide polymorphism-typing microarrays. Leukemia. 2008; 22:1891–8.
10. Brown KE, Guest SS, Smale ST, Hahm K, Merkenschlager M, Fisher AG. Association of transcriptionally silent genes with Ikaros complexes at centromeric heterochromatin. Cell. 1997; 91:845–54.
11. Gurel Z, Ronni T, Ho S, Kuchar J, Payne KJ, Turk CW, et al. Recruitment of ikaros to pericentromeric heterochromatin is regulated by phosphorylation. J Biol Chem. 2008; 283:8291–300.
12. Popescu M, Gurel Z, Ronni T, Song C, Hung KY, Payne KJ, et al. Ikaros stability and pericentromeric localization are regulated by protein phosphatase 1. J Biol Chem. 2009; 284:13869–80.
13. Song C, Li Z, Erbe AK, Savic A, Dovat S. Regulation of Ikaros function by casein kinase and protein phosphatase 1. World J Biol Chem. 2011; 26:126–31.
14. 1Gómez-del Arco P1, Maki K, Georgopoulos K. Phosphorylation controls Ikaros’s ability to negatively regulate the G[1]-S transition. Mol Cell Biol. 2004; 24:2797–807.
15. Song C, Gowda C, Pan X, Ding Y, Tong Y, Tan BH, et al. Targeting casein kinase II restores Ikaros tumor suppressor activity and demonstrates therapeutic efficacy in high-risk leukemia. Blood. 2015; 126:1813–22.
16. Wang H, Ouyang H, Lai L, Petrovic-Dovat L, Stankov K, Bogdanovic G, et al. Pathogenesis and regulation of cellular proliferation in acute lymphoblastic leukemia - the role of Ikaros. J BUON. 2014; 19:22–8.
17. Kang H, Chen IM, Wilson CS, Bedrick EJ, Harvey RC, Atlas SR, et al. Gene expression classifiers for relapse-free survival and minimal residual disease improve risk classification and outcome prediction in pediatric B-precursor acute lymphoblastic leukemia. Blood. 2010; 115:1394–405.
18. Harvey RC, Mullighan CG, Wang X, Dobbin KK, Davidson GS, Bedrick EJ, et al. Identification of novel cluster groups in pediatric high-risk B-precursor acute lymphoblastic leukemia with gene expression profiling: correlation with genome-wide DNA copy number alterations, clinical characteristics, and outcome. Blood. 2010; 116:4874–84.
19. Homminga I, Vuerhard MJ, Langerak AW, Buijs-Gladdines J, Pieters R, Meijerink JP. Characterization of a pediatric T-cell acute lymphoblastic leukemia patient with simultaneous LYL1 and LMO2 rearrangements. Haematologica. 2012; 97:258–61.
20. Cardone M, Kandilci A, Carella C, Nilsson JA, Brennan JA, Sirma S, et al. The novel ETS factor TEL2 cooperates with Myc in B lymphomagenesis. Molecular and cellular biology. 2005; 25:2395–405.
21. Grabher C, von Boehmer H, Look AT. Notch 1 activation in the molecular pathogenesis of T-cell acute lymphoblastic leukaemia. Nature reviews Cancer. 2006; 6:347–59.
22. Weng AP, Millholland JM, Yashiro-Ohtani Y, Arcangeli ML, Lau A, Wai C, et al. c-Myc is an important direct target of Notch1 in T-cell acute lymphoblastic leukemia/lymphoma. Genes & development. 2006; 20:2096–109.
23. Palomero T, Lim WK, Odom DT, Sulis ML, Real PJ, Margolin A, et al. NOTCH1 directly regulates c-MYC and activates a feed-forward-loop transcriptional network promoting leukemic cell growth. Proceedings of the National Academy of Sciences of the United States of America. 2006; 103:18261–6.
24. Gutierrez A, Sanda T, Ma W, Zhang J, Grebliunaite R, Dahlberg S, et al. Inactivation of LEF1 in T-cell acute lymphoblastic leukemia. Blood. 2010; 115:2845–51.
25. Ferrari S, Narni F, Mars W, Kaczmarek L, Venturelli D, Anderson B, et al. Expression of growth-regulated genes in human acute leukemias. Cancer research. 1986; 46:5162–6.
26. Calabretta B, Venturelli D, Kaczmarek L, Narni F, Talpaz M, Anderson B, et al. Altered expression of G1-specific genes in human malignant myeloid cells. Proceedings of the National Academy of Sciences of the United States of America. 1986; 83:1495–8.
27. Kawagoe H, Kandilci A, Kranenburg TA, Grosveld GC. Overexpression of N-Myc rapidly causes acute myeloid leukemia in mice. Cancer research. 2007; 67:10677–85.
28. Faderl S, O’Brien S, Pui CH, Stock W, Wetzler M, Hoelzer D, et al. Adult acute lymphoblastic leukemia: concepts and strategies. Cancer. 2010; 116:1165–76.
29. Malempati S, Tibbitts D, Cunningham M, Akkari Y, Olson S, Fan G, et al. Aberrant stabilization of c-Myc protein in some lymphoblastic leukemias. Leukemia. 2006; 20:1572–81.
30. Rice KL, Hormaeche I, Doulatov S, Flatow JM, Grimwade D, Mills KI, et al. Comprehensive genomic screens identify a role for PLZF-RARalpha as a positive regulator of cell proliferation via direct regulation of c-MYC. Blood. 2009; 114:5499–511.
31. Guo X, Zhang R, Liu J, Li M, Song C, Dovat S, et al. Characterization of LEF1 High Expression and Novel Mutations in Adult Acute Lymphoblastic Leukemia. PloS one. 2015; 10:e0125429.
32. Ma S, Pathak S, Mandal M, Trinh L, Clark MR, Lu R. Ikaros and Aiolos inhibit pre-B-cell proliferation by directly suppressing c-Myc expression. Molecular and cellular biology. 2010; 30:4149–58.
33. Prins RC, Burke RT, Tyner JW, Druker BJ, Loriaux MM, Spurgeon SE. CX-4945, a selective inhibitor of casein kinase-2 [CK2], exhibits anti-tumor activity in hematologic malignancies including enhanced activity in chronic lymphocytic leukemia when combined with fludarabine and inhibitors of the B-cell receptor pathway. Leukemia. 2013; 27:2094–6.
34. Li Z, Song C, Ouyang H, Lai L, Payne KJ, Dovat S. Cell cycle-specific function of Ikaros in human leukemia. Pediatr Blood Cancer. 2012; 59:69–76.
35. Pereira-Fernandes A, Dirinck E, Dirtu AC, Malarvannan G, Covaci A, Van Gaal L, et al. Expression of obesity markers and Persistent Organic Pollutants levels in adipose tissue of obese patients: reinforcing the obesogen hypothesis? PloS one. 2014; 9:e84816.
36. Popescu M, Gurel Z, Ronni T, Song C, Hung KY, Payne KJ, et al. Ikaros stability and pericentromeric localization are regulated by protein phosphatase 1. J Biol Chem. 2009; 284:13869–80.
37. Brown KE, Guest SS, Smale ST, Hahm K, Merkenschlager M, Fisher AG. Association of transcriptionally silent genes with Ikaros complexes at centromeric heterochromatin. Cell. 1997; 91:845–854.