
INTRODUCTION
Hepatocellular carcinoma (HCC) represents the fifth most common cancer, and is the third leading cause of cancer death worldwide [1]. Although progress has been made in the clinical treatment of HCC, patients still suffer poor prognosis because of intrahepatic metastases or postsurgical recurrence [2]. Many factors are attributed to the increase the risk of HCC preneoplastic liver lesions, including hepatitis virus (HBV or HCV) infection, alcohol abuse and aflatoxin exposure [3]. To date, the molecular mechanisms of HCC development and progression remain obscure. It is very helpful to identify risk factors and biomarkers for early diagnosis and prognostic prediction in patients with HCC.
Leucine-rich-2-glycoprotein (LRG) was first identified as a trace protein in human serum [4]. Leucine-rich-alpha-2-glycoprotein1 (LRG1), a membrane-associated LRR family member, has been predicted as a regulator of glucan synthesis [5], cell adhesion [6], and cell migration [7]. LRG1 has also been proposed to play a role in cell survival and apoptosis [8, 9]. Wang et al. showed that LRG1 was capable of accelerate angiogenesis by directly binding to the TGF-β accessory receptor endoglin to activate Smad1/5/8 signaling pathway [10]. The role of LRG1 in malignant carcinomas has not been well studied. Increased LRG1 expression has been demonstrated in ovarian cancer [11], non-small cell lung cancer [12], gastric cancer [13], pancreatic cancer [14] and leukemia [15]. These data suggest a potential role of LRG1 in cancer progression.
LRG1 has been implicated in serum and/or plasma biomarker for diagnosis [16, 17]. Its expression level and prognostic value have been revealed in endometrial carcinoma [18]. In this study, we detected the expression of LRG1 at both mRNA and protein levels in HCC cell lines and tissues. The relationship between LRG1 and clinicopathological features of HCC patients was determined. The prognostic value of LRG1 was accessed in 777 archived paraffin-embedded HCC clinical samples.
RESULTS
Expression of LRG1 in HCC samples by qRT-PCR and western blot
The expression of LRG1 was determined in HCC cells lines by qRT-PCR and western blot. Results showed that LRG1 mRNA levels in most HCC cell lines was up-regulated, compared to adjacent nontumorous tissues and the immortalized hepatic cell (L-02) (Figure 1A). Consistently, the protein LRG1 protein levels were noticeably increased, compared to L-02 cell (Figure 1B). In 27 HCC fresh samples, LRG1 mRNA was significantly up-regulated in HCC tissues (Figure 1C), compared to the corresponding nontumorous tissues. The increase of LRG1 protein in 32 pairs of fresh HCC tissues was also observed (Figure 1D).
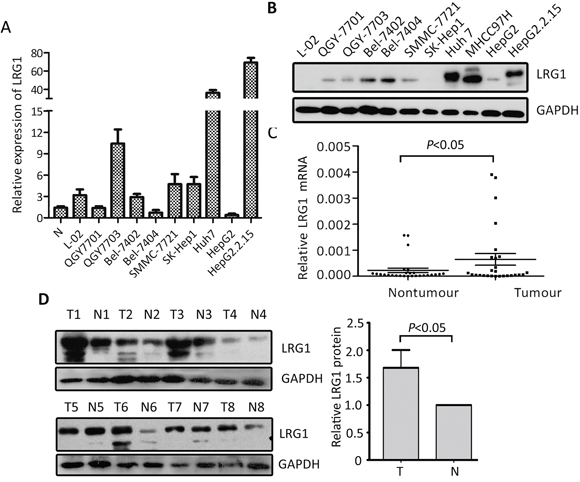
Figure 1: LRG1 expression is determined in HCC by qRT-PCR and western blot. A, B. The expression of LRG1 at mRNA (A) and protein (B) levels in HCC cell lines was examined. C. The mRNA levels of LRG1 in HCC (T) and corresponding adjacent liver tissue (N) were determined in 27 patients. D. Expression of LRG1 protein in 32 paired HCC (T) and adjacent liver tissues (N) were examined by western blot. Representative images were shown.
Expression of LRG1 in HCC samples by immunohistochemistry
To further examine the expression of LRG1 in HCC tissues, 777 paraffin-embedded HCC samples were collected to construct TMA. As shown by the result of TMA-based IHC, immunoreactivities of LRG1 were mainly present in the cytoplasm in most of the cancer cells (Figure 2A & 2B). Positive expression of LRG1 was depicted in a few of HCC cases in nontumorous tissue (Figure 2C & 2D), but in 85.8% (667/777) of HCC tissues. Furthermore, in 67.7% (526/777) of the samples, LRG1 expression in HCC was found higher than that in nontumorous tissue.
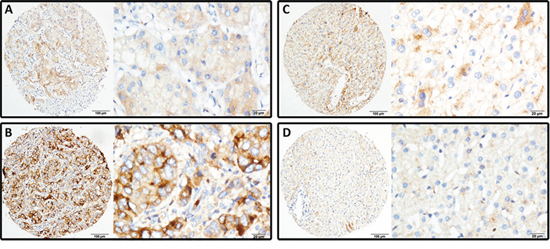
Figure 2: LRG1 expression is determined in HCC by immunohistochemistry. LRG1 was presented predominantly in cytoplasm within tumor and normal liver cells. The micrographs showed weak A. and strong B. staining in HCC, along with positive C. and negative D. staining in nontumorous liver tissues (Left panel: magnification ×100; right panel: magnification ×400).
Association of LRG1 expression and clinical features in HCC
To determine the clinical significance of LRG1 in HCC, the relationship between expression of LRG1 and clinicopathological parameters was analyzed. Patients were randomly separated into training (n = 474) or validation (n = 303) cohort. According to the median of IHC score (4.63), high LRG1 expression was identified in 51.4% (399 777) of cases. In the training cohort, high LRG1 expression was more likely to present advanced clinical characters, including higher advanced clinical stage (P = 0.008), tumor size (P = 0.037) and worse tumor differentiation (P = 0.030). In the validation cohort, high LRG1 expression was frequently associated with higher advanced clinical stage (P = 0.012), worse tumor differentiation (P = 0.035) and vascular invasion (P = 0.006) (Supplementary Table S1). In the overall cohort, patients with high LRG1 expression was accompanied with higher advanced clinical stage (P = 0.010), larger tumor size (P = 0.004), more vascular invasion (P = 0.019) and worse tumor differentiation (P < 0.001) (Table 1).
Table 1: Correlation of clinicopathological parameters and LRG1 expression in overall cohort (n = 777)
Variable |
Overall cohort |
|||
|---|---|---|---|---|
All cases |
Low expression |
High expression |
P valuea |
|
Age (years)b |
0.475 |
|||
<49 |
368 |
184 (50.0%) |
184 (50.0%) |
|
≥49 |
409 |
194 (47.4%) |
215 (52.6%) |
|
Gender |
0.092 |
|||
Male |
699 |
333 (47.6%) |
366 (52.4%) |
|
Female |
78 |
45 (57.7%) |
33 (42.3%) |
|
HBsAg |
0.913 |
|||
Positive |
663 |
322 (48.6%) |
341 (51.4%) |
|
Negative |
114 |
56 (49.1%) |
58 (50.9%) |
|
AFP (ng/ml) |
0.131 |
|||
<20 |
229 |
121 (52.8%) |
108 (47.2%) |
|
≥20 |
548 |
257 (46.9%) |
291 (53.1%) |
|
Cirrhosis |
0.386 |
|||
Yes |
619 |
306 (49.4%) |
313 (50.6%) |
|
No |
158 |
72 (45.6%) |
86 (54.4%) |
|
Tumor size (cm) |
0.004 |
|||
<5 |
235 |
133 (56.6%) |
102 (43.4%) |
|
≥5 |
542 |
245 (45.2%) |
297 (54.8%) |
|
Tumor multiplicity |
0.052 |
|||
Single |
464 |
239 (51.5%) |
225 (48.5%) |
|
Multiple |
313 |
139 (44.4%) |
174 (55.6%) |
|
Differentiation |
0.010 |
|||
Well-Moderate |
533 |
276 (51.8%) |
257 (48.2%) |
|
Poor-undifferentiated |
244 |
102 (41.8%) |
142 (58.2%) |
|
TNM |
0.000 |
|||
I–II |
392 |
216 (55.1%) |
176 (44.9%) |
|
III–IV |
385 |
162 (42.1%) |
223 (57.9%) |
|
Vascular invasion |
0.019 |
|||
Yes |
187 |
77 (41.2%) |
110 (58.8%) |
|
No |
590 |
301 (51.0%) |
289 (49.0%) |
|
Involucrum |
0.146 |
|||
Complete |
268 |
140 (52.2%) |
128 (47.8%) |
|
Incomplete |
509 |
238 (46.8%) |
271 (53.2%) |
|
aChi-square test;
bMedian age; AFP, alpha-fetoprotein; HBsAg, hepatitis B surface antigen.
Association of LRG1 expression and clinical outcomes in HCC
To determine the prognostic impact of LRG1 on HCC patients, Kaplan–Meier survival analysis was conducted. Results revealed HCC cases with high LRG1 expression were often accompanied with significantly worse prognosis, in terms of overall survival (P < 0.001), disease-free survival (P = 0.022) and recurrence probability (P = 0.020) in the training cohort (log-rank test; Figure 3A–3C). This was validated in validation cohort by showing that increase of LRG1 was associated with inferior overall survival (P < 0.001), disease-free survival (P = 0.038) and higher tendency of recurrence (P = 0.019) (log-rank test; Figure 3D–3F).
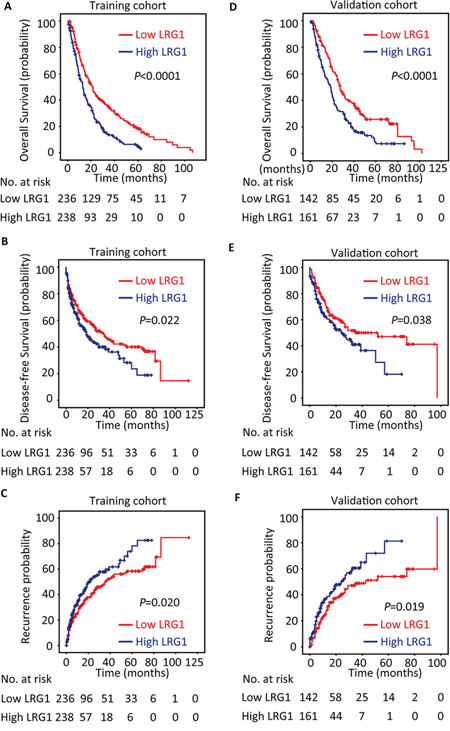
Figure 3: LRG1 expression is correlated with poor outcome in training and validation cohorts. The patients with HCC in the training (n = 474) and validation (n = 303) cohorts were divided into high and low LRG1 expression groups according to median of IHC score. Kaplan-Meier analysis was conducted to disclose the relationship of LRG1 expression and the overall survival A, B. disease-free survival C, D. and recurrence probability E, F. (log-rank test).
In line with the results of the individual cohort, patients with high LRG1 expression were likely to have shorter overall survival (P < 0.001), disease-free survival (P = 0.002) and higher recurrence probability (P = 0.001) in the overall cohort (log-rank test; Figure 4). Stratified survival analyses further confirmed the prognostic significance of LRG1. Data showed that LRG1 expression was connected with overall survival in small and large HCC (Figure 5A), in single and multiple HCC (Figure 5B), in HCC with low and high level of serum AFP (Figure 5C), in HCC with negative and positive HBV infection (Supplementary Figure S1A), in HCC at I-II and III-IV TNM stage (Supplementary Figure S1B), and in HCC with well-moderate and poor-undifferentiated differentiation (Supplementary Figure S1C).
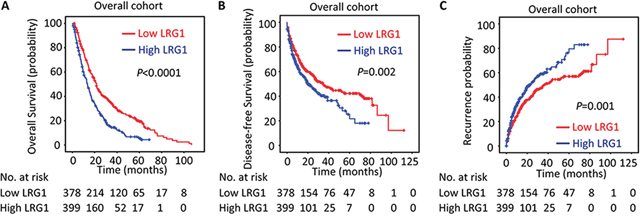
Figure 4: LRG1 expression is correlated with poor outcome in overall cohort. The association of LRG1 expression and the overall survival A. disease-free survival B. and recurrence probability C. in the overall cohort (n = 777) was determined by Kaplan-Meier analysis (log-rank test).
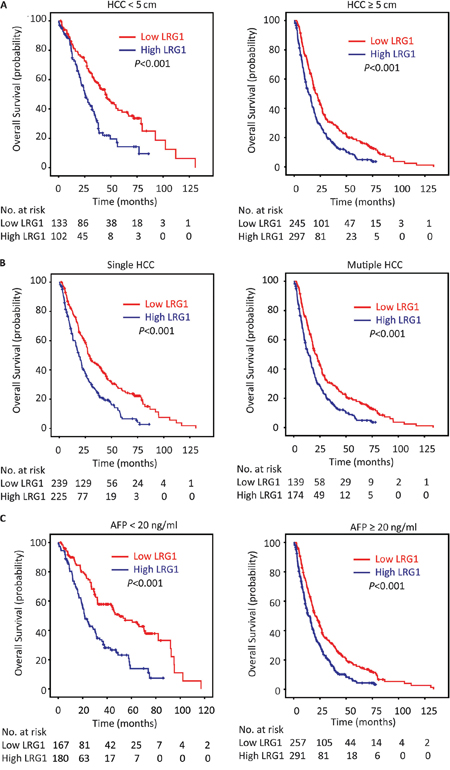
Figure 5: LRG1 expression is associated with overall survival in subgroups of HCC patients. Stratified survival analyses showed that LRG1 expression was connected with overall survival in small and large HCC A. in unique and multinodular HCC B. and in HCC with low and high level of serum AFP C. (log-rank test).
Univariate and multivariate analyses of prognostic variables in HCC
To evaluate the representativeness of our samples, univariate analyses were performed. LRG1, as well as tumor size, serum AFP level, tumor multiplicity, clinical stage, vascular invasion, and tumor differentiation were shown to be responsible for the outcome of overall survival in both training cohort and validation cohort (Supplementary Table S2). Multivariate analyses were conducted to determine the independent prognostic value of LRG1. After adjusting for the prognostic factors established in the univariate analysis, data indicated that LRG1 expression was an independent prognostic factor for overall survival in both training cohort (hazard ratio (HR) = 1.699, 95% confident interval (CI): 1.383–2.087, P < 0.001) and validation cohort (HR = 1.421, 95% CI: 1.080–1.867, P = 0.011). The independence of LRG1 in predicting disease-free survival for patients in both cohorts was also investigated (Supplementary Table S3).
In the overall cohort of 777 patients with HCC, LRG1, along with tumor size, tumor multiplicity, serum level of AFP, tumor differentiation, vascular invasion and TNM, were identified as independent prognostic factors (Table 2). Multivariate analysis indicated LRG1 as an independent factor for overall survival (HR = 1.582, 95% CI: 1.345–1.862, P < 0.001) and disease-free survival (HR = 1.280, 95% CI: 1.037–1.581, P = 0.022) (Table 2).
Table 2: Univariate and multivariate analyses of clinicopathological and LRG1 expression for overall and disease-free survival in overall cohort (n = 777)
Variables |
Univariate analysis |
Multivariate analysis |
||
|---|---|---|---|---|
HR (95% CI) |
P value |
HR (95% CI) |
P value |
|
Overall survival |
||||
Age (<49 vs. ≥49 years) |
1.034 (0.884–1.209) |
0.679 |
||
Gender (female vs. male) |
0.928 (0.713–1.209) |
0.581 |
||
HBV (positive vs. negative) |
0.991 (0.795–1.234) |
0.935 |
||
Tumor size (<5 vs. ≥5 cm) |
1.934 (1.616–2.335) |
0.000 |
1.620 (1.329–1.974) |
0.000 |
Tumor multiplicity (single vs. multiple) |
1.309 (1.118–1.533) |
0.001 |
1.021 (0.838–1.245) |
0.835 |
Invonucrum (absent vs. present) |
1.123 (0.956–1.319) |
0.159 |
||
Liver cirrhosis (yes vs. no) |
1.072 (0.876–1.312) |
0.497 |
||
AFP (<20 vs. ≥20 ng/mL) |
1.932 (1.608–2.321) |
0.000 |
1.722 (1.430–2.075) |
0.000 |
Vascular invasion (yes vs. no) |
1.901 (1.586–2.278) |
0.000 |
1.454 (1.187–1.782) |
0.000 |
Tumor differentiation |
1.356 (1.147–1.603) |
0.000 |
1.117 (0.941–1.327) |
0.206 |
TNM (I–II vs. III–IV) |
1.704 (1.455–1.995) |
0.000 |
1.151 (0.919–1.440) |
0.220 |
LRG1 expression (low vs. high) |
1.756 (1.496–2.063) |
0.000 |
1.582 (1.345–1.862) |
0.000 |
Disease-free survival |
||||
Age (<49 vs. ≥49 years) |
1.046 (0.851–1.286) |
0.669 |
||
Gender (female vs. male) |
1.123 (0.806–1.567) |
0.493 |
||
HBV (positive vs. negative) |
1.098 (0.812–1.484) |
0.544 |
||
Tumor size (<5 vs. ≥5 cm) |
1.570 (1.195–1.901) |
0.001 |
1.356 (1.078–1.727) |
0.010 |
Tumor multiplicity (single vs. multiple) |
1.093 (0.886–1.349) |
0.404 |
||
Invonucrum (absent vs. present) |
1.187 (0.960–1.468) |
0.112 |
||
Liver cirrhosis (yes vs. no) |
1.076 (0.830–1.395) |
0.581 |
||
AFP (<20 vs. ≥20 ng/mL) |
1.601 (1.267–2.024) |
0.000 |
1.488 (1.175–1.885) |
0.001 |
Vascular invasion (yes vs. no) |
1.543 (1.222-1.949) |
0.000 |
1.374 (1.084–1.742) |
0.009 |
Tumor differentiation |
1.158 (0.926-1.450) |
0.199 |
||
TNM (I–II vs. III–IV) |
1.163 (0.945-1.430) |
0.154 |
||
LRG1 expression (low vs. high) |
1.386 (1.124-1.708) |
0.002 |
1.280 (1.037–1.581) |
0.022 |
AFP, a-fetoprotein; HBsAg, hepatitis B surface antigen; HR, hazard ratio; CI, confidence interval.
Effect of LRG1 on cell proliferation and migration
The effect of LRG1 on cell mobility ability was examined by transwell migration assay. The results revealed that exogenous overexpression of LRG1 significantly promoted the migratory potential in both Bel-7402 and QGY-7703 cells (Figure 6A and Supplementary Figure S2A), whereas knockdown of LRG1 dramatically reduce the migrated cells in MHCC97H and Huh7 cells (Figure 6B and Supplementary Figure S2B). MTT and colony formation assays were conducted to determine the effect of LRG1 on cell proliferation. Data showed no significant change of cell growth between cell with or with LRG1 overexpression and knockdown (Supplementary Figure S3).
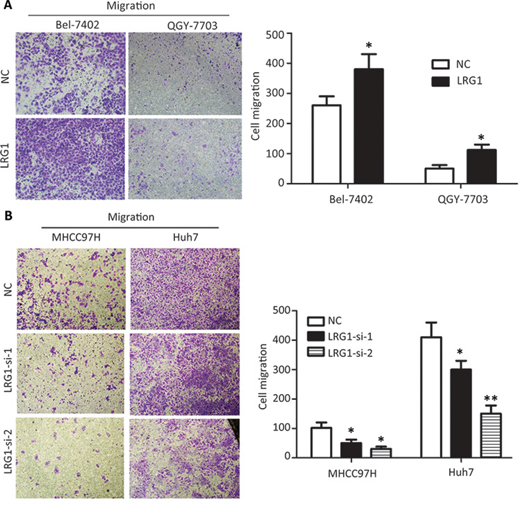
Figure 6: LRG1 promotes HCC cell migration. Transwell assays demonstrated that LRG1 was capable of increasing cell migration abilities in HCC cells. A. Cells with or without LRG1 overexpression were seeded into transwells and cultured with medium without FBS for 48 h. Migrated cells were stained with 0.05% crystal violet and counted under microscope. B. Migration assays were repeated using cells with or without LRG1 knockdown. Data were representative of three independent experiments. Values were expressed as mean ± SEM (*P < 0.05, **P < 0.01).
DISCUSSION
LRG1 is one member of leucine-rich family and is involved in protein-protein interactions, signal transduction, and cell adhesion [19]. Current literatures show that LRG1 is closely associated with cancer metastasis and poor prognosis, largely due to its effects on promoting cell invasion, angiogenesis, and migration. Zhong et al. reported that LRG1 knockdown by RNA interference inhibited cell growth and promoted apoptosis in glioblastoma in vitro and in vivo [20]. Lynch et al. demonstrated that LRG1, regulated by a potent suppressor miR-335, was involved in cell migration, invasion and metastasis [21]. In our study, LRG1 expression was frequently higher in HCC patients with larger size tumor and advanced stage, which indicate that LRG1 might be capable of interfering with the development of HCC.
Deregulation of LRG1 protein was found in human cancers. Liu et al. reported that LRG1 was overexpressed in both blood and tumor sections in non-small cell lung cancer (NSCLC) [12]. Li and colleagues provided evidence that LRG1 was increased in urinary exosome of NSCLC patients [22]. Sandanayake et al. found that serum LRG1 was increased in patients with biliary tract cancer, compared with benign disease and healthy controls [23]. In HCC, increased expression of LRG1 in the serum of patients with AFP-negative HBV-related HCC was noted [24]. Zhang et al. showed that LRG1 was decreased in HCC and suppressed cell migration [25]. However, according to our data, LRG1 expression at both mRNA and protein levels were up-regulated in HCC cell lines and tissues. Elevated expression of LRG1 was frequently accompanied with worse malignant phenomenon, such as larger tumor size, more advanced tumor stage, poorer tumor differentiation and more vascular invasion in a large cohort of 777 HCC cases (In Zhang's study, only 51 HCC samples were collected). Furthermore, our in vitro data demonstrated that overexpression of LRG1 in HCC cells resulted in enhanced ability of cell migration, which was supported by that HCC cells with high migration capability (Huh7 and MHCC97H) expressed higher level of LRG1 in both two studies. Our data was in line with the other studies indicating that increased LRG1 expression was presented in ovarian cancer [11], non-small cell lung cancer [12], gastric cancer [13], pancreatic cancer [14] and leukemia [15]. Collectively, we consider our data are more representative to show the expression of LRG1 in HCC.
The prognostic implication of LRG1 was rarely studied. Wen et al. reported that high LRG1 expression was connected with favorable prognosis in endometrial carcinoma [18]. Wu et al. showed that serum LRG1 was increased in late-staged patients with epithelial ovarian cancer [26]. In this study, LRG1 was identified as an independent factor for overall and disease-free survival in a large cohort of 777 patients with HCC. Patients with high LRG1 expression usually lived a shorter life. These data suggest that LRG1 is of clinical implication in predicting outcomes of cancer patients.
Several studies showed that LRG1 achieved its part biological function by regulating TGF-β signaling pathway [10, 27, 28], which plays an important role in the development of tumor [29]. Vogt et al. demonstrated that LRG1 was involved in the regulation of polar tip growth by affecting PKC/MAK1 pathway activities [30]. Cummings et al. reported that LRG1 was able to bind to and inhibit cytochrome c which is an essential activator of cell apoptosis [31]. These data suggest that LRG1 might exert functions towards tumor growth. In our study, LRG1 overexpression resulted in the enhancement of HCC cell mobility ability.
In summary, our data reveal that LRG1 was frequently up-regulated in HCC and promoted HCC cells mobility ability. Increase of LRG1 expression was significantly correlated with tumor size, tumor differentiation, TNM stage and vascular invasion, suggesting that LRG1 might play a role in HCC progression. High LRG1 expression unfavorably impacted the survival of HCC patients and served as an independent factor for worse outcomes. Collectively, our data suggest LRG1 is a promising biomarker for prognosis of patients with HCC.
MATERIALS AND METHODS
Patients, tissue specimens and follow-up
A total of 777 paraffin-embedded HCC specimens between January 2000 and December 2010 were obtained from the archives of the Department of Pathology of the Sun Yat-sen University Cancer Center. None of the patients received any chemotherapy or radiotherapy prior to the surgery. We randomly divided these cases into a training cohort (n = 474, 61.0%) and an independent validation cohort (n = 303, 39.0%). The follow-up period was defined as the interval from the date of surgery to the date of death or the last follow-up. This study has been approved by the Institute Research Medical Ethics Committee of SYSUCC.
Tissue microarray (TMA) construction and Immunohistochemistry
The TMA slides included 777 HCC and adjacent nontumorous liver tissues. Using a tissue array instrument (Minicore excilone, Minicore, British), each tissue core with a diameter of 0.6 mm was punched from the marked areas and re-embedded. All specimens were fixed at 4% paraformaldehyde in 0.1 M phosphate buffer for 24 h and embedded in paraffin wax. Then the paraffin-embedded HCC sections were sliced into 4 μm and mounted onto glass slides. After dewaxed, the slides were treated by 3% hydrogen peroxide in methanol and blocked by a biotin-blocking kit (DAKO, Germany). After blocking, the slides were incubated with LRG1 antibody (1:1000, Sigma, Cambridge, England) overnight in a moist chamber at 4°C. After washed in PBS for three times, the slides were incubated with biotinylated goat anti-rabbit antibodies for 1 h. Then the slides were stained with the DAKO Liquid 3,′3-diaminobenzidine tetrahydrochloride (DAB). Finally, the slides were counter stained with Mayer's hematoxylin and observed under microscope.
The protein level was determined by Semi-quantitative immunohistochemistry (IHC) detection. The positively-stained was scored as follow: “0” (less than 5% positively-stained cells), “1” (6–24% of positively-stained cells), “2” (25–49% of positively-stained cells), “3” (50–74% of positively-stained cells) and “4” (75%–100% of positively-stained cells). Intensity was scored was according to the standard: “0” (negative staining); “1” (weak staining); “2” (moderate staining) and “3” (strong staining). The final score was served by multiplying the percentage score by the staining intensity score. The scores were independently decided by two pathologists (Dr. Jing-Ping Yun and Dr. Min Li). The median IHC score was chosen as the cut-off value for defining high and low expression.
Western blot
Total proteins were extracted and separated by 10% SEMS-PAGE and then transferred onto PVDF membrane (Millipore, Bedford, MA). Equal amounts of protein (30 μg) were resolved by SDS-PAGE and then electrophoretically transferred onto PVDF membranes. After blocked in 5% non-fat milk 1 h at room temperature, the membranes were incubated with appropriately diluted primary antibodies overnight at 4°C. After washed thrice with TBST, The blotted membranes were incubated with anti-LRG1 (1:1000, Sigma, Cambridge, England). The membranes were incubated with HRP-conjugated secondary antibody at 1:20000 dilutions for 1 h at room temperature. The membranes were visualized by the enhanced Phototope TM-HRP Detection Kit and exposed to Kodak medical X-ray processor (Carestream Health, USA). Anti-GAPDH (1:1000, Santa Cruz, CA, USA) was used as a loading control.
Quantitative real-time RT-PCR (qRT-PCR)
Total RNA was extracted from clinical samples and cultured cells using Trizol reagent (BIOO Scientific Co., USA) following manufacture instruction. The reverse transcription with random primers was done by M-MLV Reverse Transcriptase (Promega Inc., USA) according to the manufacturer's instructions. SYBR green-based real-time PCR as carried out to measure levels of the corresponding LRG1 and 18S by the Strata gene Mx3000P Real-time PCR system. Primers were designed as follows: LRG1, forward: 5′-CCATCTCCTGTCAACCACCT-3′ and reverse: 5′-GTTTCGGGTTAGATCCAGCA-3′; 18S, forward: 5′-TGAGAAACGGCTACCACATCC-3′ and reverse: 5′-ACCAGACTTGCCCTCCAATG-3′. The qRT-PCR reactions were done 95°C for 10 min for initial denaturation, and then 95°C for 30 seconds, 60°C for 30 seconds, 72°C for 30 seconds and a final extension of 10 min for 40 cycles. SDS 2.3 software (Applied Biosystems) was used to quantify and analyze the relative mRNA levels. Relative quantification of LRG1 mRNA was performed using the 2−ΔCt method. The experiments were done at least thrice independently and all samples were in triplicate.
Migration assay
For the migration assay, 2–4 × 10⁴ cells in serum-free medium were plated in the upper compartment of a transwell chamber (8-μm pore size, Millepore, USA). After incubation for 24–48 hours, the migrated cells on the lower membrane were counted after staining with 0.1% crystal violet and 20% methanol. The experiment was performed in triplicate and repeated three times.
MTT and colony formation assays
After transfection, cells were seeded in 96-well plates (3 × 10⁴ cells/ml) with 100 ul medium in each well and cultured for 5 days. MTT assay was performed by adding 20 ul of MTT (5 mg/ml, AMRESCO, Solon, OH, USA) for 4 h at 37°C. Then, the formazan crystals were dissolved in DMSO (150 μl/well). The absorbance at 490 nm of each sample was measured using a multilabel plate reader (PerkinElmer). For the colony formation assay, 500 cells were seeded into 6-well plates and incubated at 37°C in a humidified atmosphere containing 5% CO2 in air for 10–14 days. Colonies were fixed with methanol, stained with 0.1% crystal violet and counted.
Plasmid construction and transfection
The recombinant plasmids pcDNA 3.1/hygro(+) vector and pcDNA 3.1/hygro(+)-LRG1 were confirmed by sequencing. We constructed the plasmids into QGY-7703 and Bel-7402 cells by Lipofectamine™ 2000 (Invitrogen; Carlsbad, CA, USA) transduction. After an antibiotic selection with 800 μg/ml G418 (Clontech, CA), the G418- resistant clone was isolated and expanded into cell lines and tested the expression of LRG1 by western blot.
RNA interference
siRNA duplexes targeted LRG1 (siRNA#1: forward 5′-CAUGCUGGACCUCUCCAAUTT-3′, reverse 5′-AUU GGAGAGGUCCAGCAUGTT-3′; siRNA#2: forward: 5′-CCUGAGCGACCUCUAUCGUTT-3′, reverse: 5′-AC GAUAGAGGUCGCUCAGGTT-3′;) and negative control (NC) siRNA duplex (forward: 5′-UUCUCCGAA CGUGUCACGUTT-3′; reverse: 5′-ACGUGACACGUUC GGAGAATT-3′) were chemically synthesized by Shanghai GenePharma Co. Ltd (Shanghai, China). Transfection was performed using the Lipofectamine™ RNAiMAX (Invitrogen; Carlsbad, CA, USA) according to the manufacturer's instructions.
Statistical analysis
Statistical analysis was performed using the SPSS (version 16.0, Chicago, IL). The data for LRG1 expression was analyzed by using the Student's t-test. Pearson's χ2 test or Fisher's exact test was chosen for examining the correlations between LRG1 expression level and the clinical and pathological variables. Survival curves were carried out by the Kaplan-Meier method (log-rank test). Multivariate Cox proportional hazards regression model was conducted to evaluate the independence of LRG1 in prognosis. Differences were considered significant for P value less than 0.05.
ACKNOWLEDGMENTS AND FUNDING
This work was supported by grants from the National Natural Science Foundation of China (No. 81201717, 81372572).
CONFLICTS OF INTEREST
The authors have no conflict of interest to declare.
REFERENCES
1. Torre LA, Bray F, Siegel RL, Ferlay J, Lortet-Tieulent J, Jemal A. Global cancer statistics, 2012. CA Cancer J Clin. 2015; 65:87–108.
2. Sunkara V, Hebert JR. The colorectal cancer mortality-to-incidence ratio as an indicator of global cancer screening and care. Cancer. 2015; 121:1563–9.
3. Mazzanti R, Gramantieri L, Bolondi L. Hepatocellular carcinoma: epidemiology and clinical aspects. Mol Aspects Med. 2008; 29:130–143.
4. Haupt H, Baudner S. [Isolation and characterization of an unknown, leucine-rich 3.1-S-alpha2-glycoprotein from human serum (author’s transl)]. Hoppe Seylers Z Physiol Chem. 1977; 358:639–646.
5. O’Donnell LC, Druhan LJ, Avalos BR. Molecular characterization and expression analysis of leucine-rich alpha2-glycoprotein, a novel marker of granulocytic differentiation. Journal of leukocyte biology. 2002; 72:478–485.
6. Kobe B, Kajava AV. The leucine-rich repeat as a protein recognition motif. Curr Opin Struct Biol. 2001; 11:725–732.
7. Saito K, Tanaka T, Kanda H, Ebisuno Y, Izawa D, Kawamoto S, Okubo K, Miyasaka M. Gene expression profiling of mucosal addressin cell adhesion molecule-1+ high endothelial venule cells (HEV) and identification of a leucine-rich HEV glycoprotein as a HEV marker. J Immunol. 2002; 168:1050–1059.
8. Weivoda S, Andersen JD, Skogen A, Schlievert PM, Fontana D, Schacker T, Tuite P, Dubinsky JM, Jemmerson R. ELISA for human serum leucine-rich alpha-2-glycoprotein-1 employing cytochrome c as the capturing ligand. J Immunol Methods. 2008; 336:22–29.
9. Thompson FC. The Vietnam War added a motive to go on studying. Nature. 2007; 449:139.
10. Wang X, Abraham S, McKenzie JA, Jeffs N, Swire M, Tripathi VB, Luhmann UF, Lange CA, Zhai Z, Arthur HM, Bainbridge JW, Moss SE, Greenwood J. LRG1 promotes angiogenesis by modulating endothelial TGF-beta signalling. Nature. 2013; 499:306–311.
11. Andersen JD, Boylan KL, Jemmerson R, Geller MA, Misemer B, Harrington KM, Weivoda S, Witthuhn BA, Argenta P, Vogel RI, Skubitz AP. Leucine-rich alpha-2-glycoprotein-1 is upregulated in sera and tumors of ovarian cancer patients. J Ovarian Res. 2010; 3:21.
12. Liu Y, Luo X, Hu H, Wang R, Sun Y, Zeng R, Chen H. Integrative proteomics and tissue microarray profiling indicate the association between overexpressed serum proteins and non-small cell lung cancer. PLoS One. 2012; 7:e51748.
13. Uen YH, Lin KY, Sun DP, Liao CC, Hsieh MS, Huang YK, Chen YW, Huang PH, Chen WJ, Tai CC, Lee KW, Chen YC, Lin CY. Comparative proteomics, network analysis and post-translational modification identification reveal differential profiles of plasma Con A-bound glycoprotein biomarkers in gastric cancer. J Proteomics. 2013; 83:197–213.
14. Kakisaka T, Kondo T, Okano T, Fujii K, Honda K, Endo M, Tsuchida A, Aoki T, Itoi T, Moriyasu F, Yamada T, Kato H, Nishimura T, Todo S, Hirohashi S. Plasma proteomics of pancreatic cancer patients by multi-dimensional liquid chromatography and two-dimensional difference gel electrophoresis (2D-DIGE): up-regulation of leucine-rich alpha-2-glycoprotein in pancreatic cancer. J Chromatogr B Analyt Technol Biomed Life Sci. 2007; 852:257–267.
15. Wu RS, Yu CS, Liu KC, Huang HY, Ip SW, Lin JP, Chueh FS, Yang JS, Chung JG. Citosol (thiamylal sodium) triggers apoptosis and affects gene expressions of murine leukemia RAW 264.7 cells. Hum Exp Toxicol. 2012; 31:771–779.
16. Ivancic MM, Irving AA, Jonakin KG, Dove WF, Sussman MR. The concentrations of EGFR, LRG1, ITIH4, and F5 in serum correlate with the number of colonic adenomas in ApcPirc/+ rats. Cancer Prev Res (Phila). 2014; 7:1160–1169.
17. He X, Wang Y, Zhang W, Li H, Luo R, Zhou Y, Liao CL, Huang H, Lv X, Xie Z, He M. Screening differential expression of serum proteins in AFP-negative HBV-related hepatocellular carcinoma using iTRAQ -MALDI-MS/MS. Neoplasma. 2014; 61:17–26.
18. Wen SY, Zhang LN, Yang XM, Zhang YL, Ma L, Ge QL, Jiang SH, Zhu XL, Xu W, Ding WJ, Yang BQ, Zhang ZG, Teng YC. LRG1 is an independent prognostic factor for endometrial carcinoma. Tumour Biol. 2014; 35:7125–7133.
19. Buchanan SG, Gay NJ. Structural and functional diversity in the leucine-rich repeat family of proteins. Prog Biophys Mol Biol. 1996; 65:1–44.
20. Zhong D, Zhao S, He G, Li J, Lang Y, Ye W, Li Y, Jiang C, Li X. Stable knockdown of LRG1 by RNA interference inhibits growth and promotes apoptosis of glioblastoma cells in vitro and in vivo. Tumour Biol. 2015; 36:4271–8.
21. Lynch J, Meehan MH, Crean J, Copeland J, Stallings RL, Bray IM. Metastasis suppressor microRNA-335 targets the formin family of actin nucleators. PloS one. 2013; 8:e78428.
22. Li Y, Zhang Y, Qiu F, Qiu Z. Proteomic identification of exosomal LRG1: a potential urinary biomarker for detecting NSCLC. Electrophoresis. 2011; 32:1976–1983.
23. Sandanayake NS, Sinclair J, Andreola F, Chapman MH, Xue A, Webster GJ, Clarkson A, Gill A, Norton ID, Smith RC, Timms JF, Pereira SP. A combination of serum leucine-rich alpha-2-glycoprotein 1, CA19–9 and interleukin-6 differentiate biliary tract cancer from benign biliary strictures. Br J Cancer. 2011; 105:1370–1378.
24. He X, Wang Y, Zhang W, Li H, Luo R, Zhou Y, Li C, Liao M, Huang H, Lv X, Xie Z, He M. Screening differential expression of serum proteins in AFP-negative HBV-related hepatocellular carcinoma using iTRAQ -MALDI-MS/MS. Neoplasma. 2013 Sep 20. doi: 10.4149/neo_2014_001. [Epub ahead of print].
25. Zhang Y, Luo Q, Wang N, Hu F, Jin H, Ge T, Wang C, Qin W. LRG1 suppresses the migration and invasion of hepatocellular carcinoma cells. Medical oncology. 2015; 32:146.
26. Wu J, Yin H, Zhu J, Buckanovich RJ, Thorpe JD, Dai J, Urban N, Lubman DM. Validation of LRG1 as a Potential Biomarker for Detection of Epithelial Ovarian Cancer by a Blinded Study. PLoS One. 2015; 10:e0121112.
27. Song W, Wang X. The role of TGFbeta1 and LRG1 in cardiac remodelling and heart failure. Biophys Rev. 2015; 7:91–104.
28. Lynch J, Fay J, Meehan M, Bryan K, Watters KM, Murphy DM, Stallings RL. MiRNA-335 suppresses neuroblastoma cell invasiveness by direct targeting of multiple genes from the non-canonical TGF-beta signalling pathway. Carcinogenesis. 2012; 33:976–985.
29. Zerbini G, Lorenzi M, Palini A. Tumor angiogenesis. N Engl J Med. 2008; 359:763. author reply 764.
30. Vogt N, Seiler S. The RHO1-specific GTPase-activating protein LRG1 regulates polar tip growth in parallel to Ndr kinase signaling in Neurospora. Mol Biol Cell. 2008; 19:4554–4569.
31. Cummings C, Walder J, Treeful A, Jemmerson R. Serum leucine-rich alpha-2-glycoprotein-1 binds cytochrome c and inhibits antibody detection of this apoptotic marker in enzyme-linked immunosorbent assay. Apoptosis. 2006; 11:1121–1129.