
INTRODUCTION
Multiple myeloma (MM) is an incurable plasma cell neoplasm that affects over 20,000 people per year in the US alone. A series of novel therapeutic agents, coupled with improved care for patients undergoing autologous stem cell transplantation has led to dramatic improvements in the progression free survival for individuals with MM [1, 2]. While impressive, these treatments are often accompanied by substantial toxicities, necessitating the search for targeted therapies in the hope of continuing advances while reducing adverse effects. The proteasome has proven a highly efficacious target in MM over the last decade since approval of the first in class inhibitor bortezomib [3–5]. This led to the realization that the ubiquitin-proteasome system plays an important role in this and other cancers. The proteasome selectively degrades protein targets that have been marked for destruction by ubiquitin (Ub) [6]. The net ubiquitination status of any protein is regulated both through the processes of attachment and detachment with alterations of either event leading to changes in the half-life or biochemical function of targeted proteins [7, 8]. In addition to its role as a proteasomal targeting mark, ubiquitination also affects many non-degradative functions including altering protein localization, enzymatic activity, and protein-protein interactions [9]. Our recent work, and that of others, have highlighted the capacity of de-ubiquitinating enzymes to act as oncogenes and tumor suppressors [8, 10–12], and increasingly these enzymes are considered targets for potential pharmacologic intervention in many cancers, including myeloma [13–15]. It is likely that there are specific alterations within the components of the UPS that are disrupted in myeloma pathogenesis – the targeting of which may allow more specific and less toxic therapeutic options in this disease.
Using an unbiased approach to identify de-ubiquitinating enzymes deregulated in cancer, we previously found UCH-L1, a deubiquitinating enzyme largely restricted to neuro-endocrine tissues in mice and humans, to be frequently over-expressed in mature B-cell malignancies, including MM [12, 16–18]. Demonstrating the oncogenic activity of this enzyme, we showed that the expression of UCH-L1 in a broad tissue distribution led to spontaneous cancers with surprising specificity to the B-cell compartment in transgenic mice, with tumors exhibiting DLBCL and plasmacytoma histology [12], suggesting an important role in the biology of B-cell malignancy. Others have also found UCH-L1 to be associated with tumorigenesis [19, 20]. Through a newly identified role in regulating mTOR complex stability, we have shown UCH-L1 to promote AKT phosphorylation and to be required for MM cell survival in vitro [21]. UCH-L1 has also been implicated to regulate cyclin dependent kinases [22], β-catenin [23], HIF-1α [20], NOXA [24], and tubulin polymerization [25], all of which may have important impacts in tumorigenesis. Whether UCH-L1 is involved in the in vivo development and/or progression of MM is unknown. Here we show that UCH-L1 is required for the in vivo dissemination and progression of MM and is an important determinant for prognosis in patients with the disease.
RESULTS
UCH-L1 is a biomarker of poor outcome in multiple myeloma
To better understand the impact of UCH-L1 expression in human myeloma, we analyzed RNA expression profiling data in a large cohort (n = 351) of newly diagnosed patients who were treated on the Total Therapy 2 (TT2) protocol that added thalidomide onto a background of tandem autologous stem cell transplants [26]. We found a significant decrease in overall survival in patients with high levels of UCHL1 (UCHL1HI = 75–100%) disease compared with UCHL1LO (0–74%) (Figure 1A). The magnitude and significance of the impact on survival was even greater at higher expression levels, consistent with a dose effect. However, to enable further analysis on a larger group of cases, we define UCHL1HI cases as the top 25% expression unless otherwise noted. The effect of UCH-L1 on survival was lost in patients treated on Total Therapy 3 (TT3; n = 208), a regimen that incorporated bortezomib onto this backbone (Figure 1B). To further analyze the impact of UCH-L1 on the response to bortezomib, we examined the responses in relapsed patients participating in the Assessment of Proteasome Inhibition for EXtending Remissions (APEX) trial that compared outcomes in relapsed patients treated with either high-dose dexamethasone or bortezomib [27]. In the cohort of patients treated with high-dose dexamethasone, those with UCHL1HI disease had a significantly worse outcome compared with those with UCHL1LO with a median time to progression of only 83 days compared with 147 days respectively (Figure 1C). In contrast, bortezomib was equally effective in cases with any level of UCHL1 (Figure 1D). Consistent with this, bortezomib dramatically improved the outcome for patients with UCHL1HI disease compared with dexamethasone (Figure 1E). whereas those patients with UCHL1LO disease responded equally well to both agents. (Figure 1F). We conclude from these two independent studies that UCH-L1 may be an important biomarker for aggressive MM both at diagnosis and at relapse, with high levels predicting resistance to therapies that do not include bortezomib.
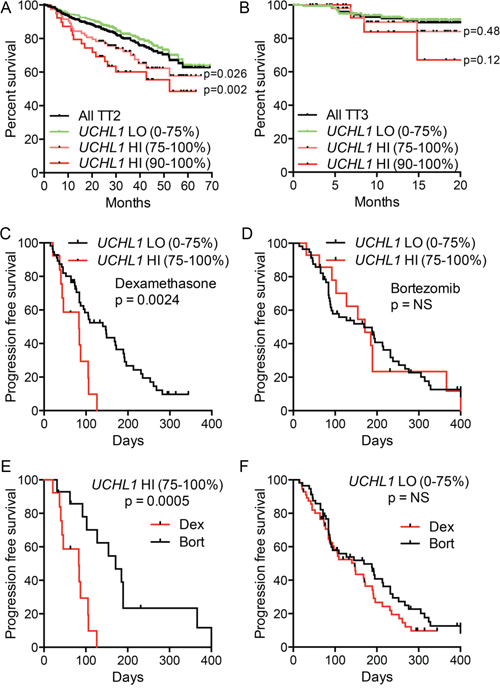
Figure 1: UCH-L1 is a biomarker of poor outcome in multiple myeloma. A, B. Data from GSE2658 (n = 542) were divided based on therapeutic trial (TT2 v. TT3) and were placed into cohorts of UCHL1LO (0–74th percentile) and UCHL1HI (75–100th percentile). The overall disease-related survival was estimated using the Kaplan-Meyer method. C, D. Progression free survival was estimated for patients with myeloma expressing low UCHL1LO (0–74th percentile) and UCHL1HI (75–100th percentile), treated with dexamethasone (C) or bortezomib (D) on the APEX trial (GSE9782; only those patients on APEX). E, F. Data as from C, E analyzed according to treatment in UCHL1LO (E) of UCHL1HI cases. In all panels, p values were calculated with the Mantel-Cox log rank test.
To better understand the impact of UCH-L1 on the response to bortezomib and dexamethasone, we made use of doxycycline-inducible shRNAs. In two prior reports we characterized a series of UCHL1 targeting shRNAs and found them to similarly induce cell death in three different UCH-L1 expressing myeloma cell lines, but not in a UCH-L1 negative line [12, 21]. To assess the impact of UCH-L1 depletion on drug response, we incubated three UCH-L1 expressing myeloma cell lines with a series of concentrations of either bortezomib or dexamethasone, and monitored cell viability. As we reported previously, UCH-L1 depletion led to a progressive loss of cell viability in all three cell lines (Figure 2A, 2B). The inclusion of either dexamethasone, or bortezomib, led to further loss of cell viability. To better understand the combined impact of UCH-L1 depletion and drug exposure, we next analyzed the activation of caspase 3/7 in KMS-11 cells. Normalizing the caspase activity in cells in the absence of drugs, we found cells depleted of UCH-L1 had a significant increase in caspase activity 48-hours after incubation with either dexamethasone of bortezomib (Figure 2C, 2D). We conclude that high levels of UCH-L1 promote the survival of myeloma cells in the presence of both of these agents, and suggest that additional factors may influence the differential response seen in vivo.
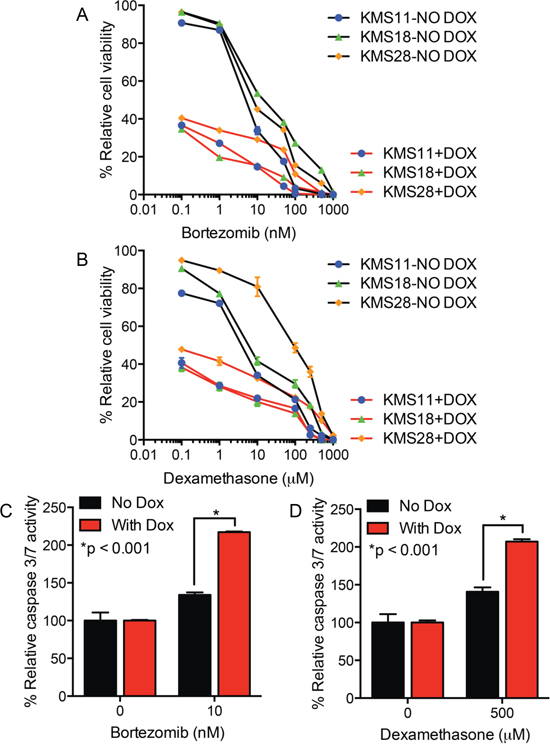
Figure 2: UCH-L1 depletion enhances myeloma cell apoptosis in response to bortezomib or dexamethasone. A, B. The indicated cell lines, all transduced with UCHL1 targeting doxycycline-inducible shRNAs, were incubated with or without doxycycline (DOX) and the indicated concentrations of either bortezomib (A) or dexamethasone (B) Cell viability was monitored, in triplicate, using the MTS assay. The graph represents the data from three independent experiments normalized to the viability of the cells without DOX or drug. C, D. Cells as in (A) were treated with the drugs as indicated, and the activity of caspase 3/7 was measured. The graph represents the mean +/− SEM from triplicate wells, and is representative of two independent experiments. P-values were calculated with an unpaired, two-tailed students t-test.
UCHL1 over-expression partially overlaps with known myeloma genetic prognostic groups
Prior work led to the generation of eight TC (translocation, cyclin D) groups that reflect the presence of numerical or structural chromosome aberrations, and deregulated expression of D-type cyclins [27, 28]. To evaluate the nature of UCHL1HI myeloma cases, we plotted UCHL1 levels across 596 myeloma primary specimens and 50 human myeloma cell lines according to TC grouping. There was a striking association between cases of the 4p16 translocation subtype and increased UCHL1 levels (Figure 3A). This is in line with our prior finding that three cell lines carrying the t(4;14) (KMS-11, KMS-18, KMS-28) have high levels of UCH-L1 whereas KMS-12 cells that lack this translocation have very low levels [12]. There was also an enrichment of UCHL1HI cases in the cyclin D group of D1+D2. We next sought to determine if UCHL1 levels influenced survival within the TC groups. To best accomplish this, we examined the cohort of patients treated on the TT2 study. Dividing up the 351 patients into eight groups resulted in some groups being very small, with only the D1, D2, and 4p16 groups having more than four patients in the UCHL1HI group. While there was no apparent impact of UCHL1 level on survival within the D1 or D2 groups, there was a trend (p = 0.07) in the 4p16 group suggesting a worse outcome for those with high levels of UCHL1 (Supplementary Figure 2SA–2SC).
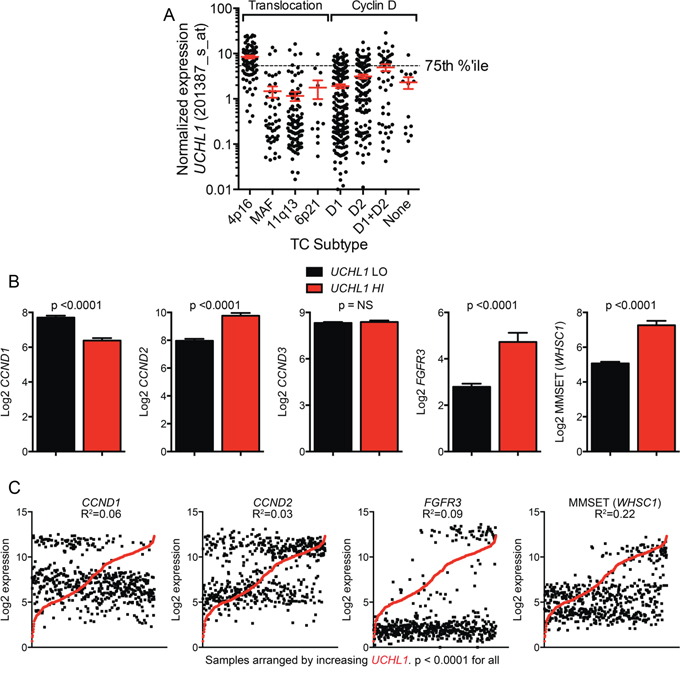
Figure 3: High UCHL1 levels correlate with the t(4;14) gene expression profile. A. UCHL1 levels are plotted for primary samples and human myeloma cell lines (n = 646) divided into Translocation Cyclin D (TC) categories by gene expression profiling. The dashed line indicates the 75th percentile. B. The expression of the indicated genes was compared between UCHL1LO (0–74th percentile) and UCHL1HI (75–100th percentile) from GSE2658. The graphs represent the mean +/− SEM for each gene. P values calculated with the 2-tailed unpaired t-test. C. Expression values for UCHL1 and each indicated gene were plotted for individual samples in GSE2658. The graphs represent the expression values for each gene with cases arranged by increasing UCHL1 expression. The R2 and p values were calculated using the Pearson's r test.
We next compared the expression of the key classifying genes between cases with either low or high levels of UCHL1. Those patients with UCHL1HI disease exhibited significantly increased levels of cyclin D2, FGFR3, and MMSET (WHSC1), and significant reductions in cyclin D1 compared with UCHL1LO cases (Figure 3B). Further analysis in individual cases revealed a highly significant correlation between UCHL1 level and the level of these four genes, with the highest correlation with MMSET (Figure 3C). The t(4;14)(p16;q32) involves the FGFR3/WHSC1 locus and places it under the control of IgH regulatory elements that are highly active in plasma cells [29]. As MMSET is a histone methyltransferase that regulates dimethylation of histone H3K36, we reasoned that its expression might directly affect the expression of UCHL1 through chromatin modifications. To examine the potential effect of MMSET expression on UCHL1, we examined H3K36me2 ChIP-SEQ genome browser track data for parental KMS-11 or KMS-11 translocation knock-out (TKO) cells lacking MMSET [30]. Surprisingly, there was no substantial change observed in H3K36me2 occupancy in the region near the transcription start site of the UCHL1 gene between KMS-11 parent and TKO cells (Supplementary Figure 2SA). Consistent with this, there was no change in the expression level of UCHL1 in parallel replicate gene expression profiling experiments (Supplementary Figure 2SB) while the expected altered expression of BACE2 and IRF4 were readily observed. Using a distinct dataset [31], we next examined the impact of shRNA depletion of MMSET in KMS-11 cells, KMS-11 TKO cells, and TKO cells reconstituted with either wild-type or mutant inactive MMSET on the level of UCHL1. As expected, there was no significant impact of MMSET expression on the level of UCHL1 (Supplementary Figure 2SC, 2SD). Furthermore, there is no correlation between UCHL1 and MMSET in other B-cell cancers including diffuse large B-cell lymphoma and chronic lymphocytic leukemia, diseases where the WHSC1 locus is not rearranged (data not shown). We therefore conclude that high UCHL1 levels correlate with the gene signature seen in patients with chromosome 4p16 rearrangements, but that increased UCHL1 is not directly related to the over-activity of MMSET.
We next examined the relationship between UCHL1 expression and amplification of chromosome 1q [32]. The incidence of 1q21 amplification, as detected by FISH and reported as metadata along with the gene expression data, was significantly increased in the UCHL1HI cohort (Figure 4A). Consistent with this, the mean level of UCHL1 was significantly increased in samples with at least 3 copies of 1q21 compared with those disomic at this region (Figure 4B). We correlated UCHL1 levels with those included in a recently developed 17-gene signature of poor survival that is heavily influenced by loci on chromosome 1 [32]. While there were a number of probesets within the 17-gene signature that significantly correlate with the level of UCHL1, genes on 1q were not enriched in the group of correlated genes (Figure 4C). To examine their relative contribution to survival, we plotted survival as a function of UCHL1 and 1q21 status. The most favorable outcomes were seen in patients lacking both high levels of UCHL1 and 1q21 amplification, whereas the worse outcomes were seen in those having both negative features (Figure 4D). To further test the relationship between these markers, we compared survival of all patients with 1q21 amplification stratified by UCHL1 using a cutoff of 90% to define elevated levels. There was a significant additional negative impact of having increased UCHL1 beyond that seen for 1q21 amplification alone (Figure 4E). To assess the individual contributions of 1q21 amplification, t(4;14), and UCHL1 over-expression we performed a univariate and multivariate analysis. Because FISH data is not available for all patients in this database, we limited the analysis to the 248 patients with data on all three markers, leaving only 59 events that contribute to this data. In the univariate analysis, all three factors had a highly significant impact on survival (Table 1). In the multivariate analysis, 1q21 amplification was the only factor that retained significance, though both t(4;14) (as indicated by high levels of MMSET) and UCHL1 over-expression showed trends towards showing an independent contribution (Table 2). Taken together, these data indicate that high levels of UCHL1 partially overlap with the presence of established poor prognostic factors such as 4p16 rearrangement and 1q21 amplification, but it is likely not simply a marker for these features.
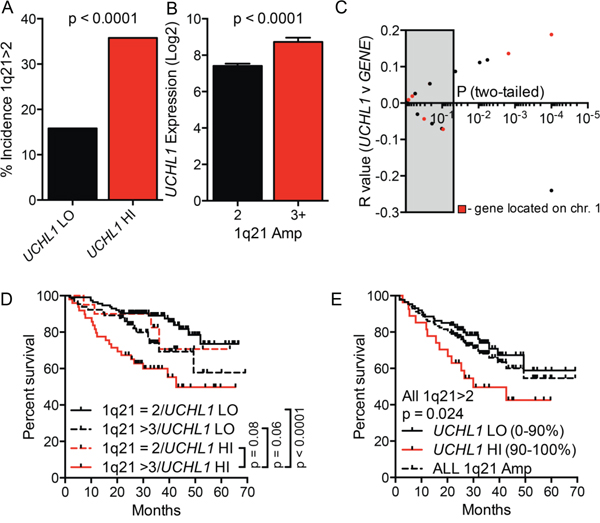
Figure 4: High UCHL1 levels correlate with amplification of chromosome 1q21. A. The incidence of 1q21 amplification (>2 signals by FISH) in cases from GSE2658 according to the level of UCHL1. B. The level of UCHL1 in samples according to the number of signals for 1q21 as in (A) C. The degree of correlation (R value and p values) for the comparison between UCHL1 and each of the 17-genes included in the molecular definition of high-risk myeloma. The grey box indicates p values that are >0.05. The red dots represent genes localized to chromosome 1q. D, E. The overall disease-related survival was estimated using the Kaplan-Meyer method for cases classified based upon the number of 1q21 FISH signals and by UCHL1 level. P values were calculated using the Mantel-Cox log rank test.
Table 1: Univariate analysis of prognostic factors
Factor |
RR |
95% CI |
p value |
|---|---|---|---|
1q21 > 2 |
2.5 |
1.49–4.33 |
<0.001 |
MMSET HI |
2.37 |
1.38–3.96 |
0.002 |
UCHL1 > 75% |
2.2 |
1.30–3.69 |
0.003 |
UCHL1 > 90% |
2.82 |
1.54–4.9 |
0.001 |
N = 248, analysis limited to those that had data on all factors. MMSET HI defined as WHSC1 signal > 3x median, UCHL1 HI defined as shown.
Table 2: Multivariate proportional hazard analysis of prognostic factors
Factor |
RR |
95% CI |
p value |
|---|---|---|---|
1q21 > 2 |
1.9 |
1.09–3.42 |
0.024 |
MMSET HI |
1.74 |
0.99–2.93 |
0.055 |
UCHL1 > 75% |
1.51 |
0.86–2.65 |
0.15 |
UCHL1 > 90% |
1.82 |
0.95–3.35 |
0.071 |
N = 248, analysis limited to those that had data on all factors. MMSET HI defined as WHSC1 signal > 3x median, UCHL1 HI defined as shown.
UCH-L1 is required for the establishment and progression of myeloma in an orthotopic mouse model
Our prior work revealed that UCH-L1 depletion led to cell death in three independent myeloma cell lines (KMS-11, KMS-18, KMS-28) expressing high levels of UCH-L1, whereas there was no impact on the growth of KMS-12 cells that express low levels [12]. To better understand the role of UCH-L1 in the in vivo behavior of MM, we selected one of these lines, KMS-11, to determine the in vivo impact of UCH-L1 depletion in an orthotopic model of disseminated myeloma. We modified these cells to stably encode the firefly luciferase cDNA (KMS-11LUC) to allow non-invasive bioluminescent imaging (BLI). The cells were further stably transduced to encode an UCHL1 targeting shRNA or a control non-silencing shRNA under the control of a constitutive promoter. In animals injected with cells encoding non-silencing shRNA, there was a brisk increase in BLI signal with mice going on to develop hind-limb paralysis (Figure 5A, 5B). Cellular infiltrates were observed in the marrow space of animals at sacrifice, with these cells expressing UCH-L1 and CD138 (Figure 5C, and data not shown). Mice carrying the UCHL1 targeting shRNA had a significant and substantial reduction in BLI intensity compared with the control mice leading to a delay in the development of disseminated disease. We conclude that the modified KMS-11 cells efficiently model disseminated myeloma and that constitutive depletion of UCH-L1 interfered with the generation of disseminated disease in this model.
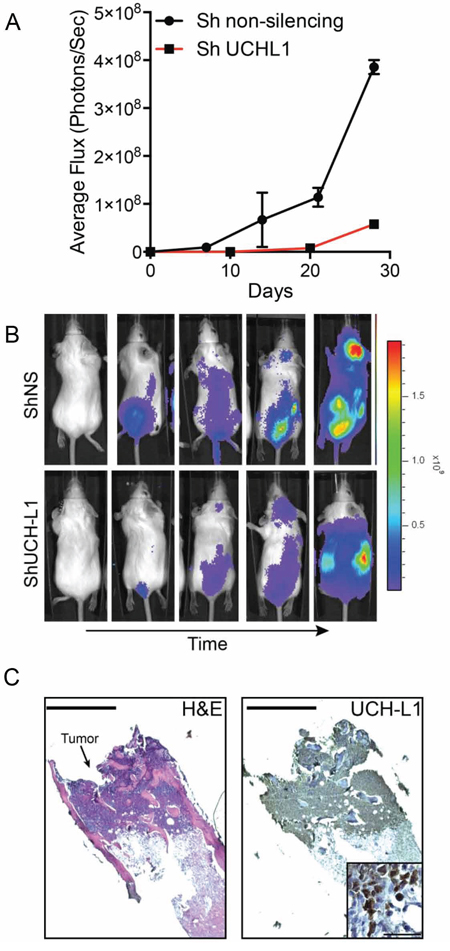
Figure 5: UCH-L1 depletion impairs the dissemination of myeloma in an orthotopic model. A. Bioluminescence imaging (BLI) of SCID-Beige mice (n = 3 each condition) following i.v. injection of KMS-11LUC cells transduced with CMV driven shRNAs as indicated. The graph represents the mean +/− SEM at each time point. B. Representative images of mice from (A) C. Histologic appearance of a myeloma lesion in the femur of an affected mouse. Paraffin embedded sections were stained with hematoxylin and eosin (H&E) or a UCH-L1 specific antibody followed by development with horseradish peroxidase (HRP). Bar = 400 μm. The inset is a high-power view of the same sample, bar = 50 μm.
Having established the orthotopic mouse model of disseminated disease, we sought to simulate treating a patient with active disease. To do this, we injected mice with KMS-11LUC cells stably transduced with shRNA (UCH-L1 targeting or non-silencing) under the control of a doxycycline-inducible promoter. Mice injected with these cells were monitored by BLI and doxycycline was added to the drinking water once disseminated myeloma was established (Figure 6A). While the signal continued to rise in mice carrying KMS-11LUC cells with non-silencing shRNA, the intensity dropped sharply in those with UCH-L1 targeting shRNA (Figure 6B, 6F). Three weeks after the addition of doxycycline, there was an average reduction in BLI of 99.88% compared with control (p < 0.0001). Moreover, this impact on disease translated into a significant extension in endpoint free survival (Figure 6C). Following this nadir, the BLI intensity increased in those mice harboring cells depleted of UCH-L1, suggesting disease relapse. To exclude any effect related to differences between these independently transduced cell lines, we repeated the experiment using only the KMS-11LUC cells transduced with UCHL1 shRNA – adding dox only to half of the mice once disseminated disease was established. The impact of UCH-L1 depletion was similar, with a 99.86% reduction in BLI intensity, and a 3.4-week extension in endpoint free survival (Figure 6D, 6E). Again we observed that after the initial nadir, the BLI intensity increased – eventually reaching levels similar to that seen in control animals. This observation prompted us to question the mechanism underlying this apparent disease “relapse”. We cultured KMS-11 cells transduced with UCHL1 targeting or non-silencing shRNA constructs and monitored viability and UCH-L1 levels over the course of 2 weeks. We found an initial decline in cell viability, followed by re-growth as was observed in mice (Figure 7A). Immunoblotting through this period demonstrates re-expression of UCH-L1 to baseline levels, making UCH-L1 independence an unlikely explanation for disease relapse (Figure 7D). To further investigate whether the resistant cells were still dependent on UCH-L1 activity, we made use of the semi-selective de-ubiquitinase inhibitor WP1130 that inhibits UCH-L1 [33]. We cultured shRNA naïve or shUCHL1 resistant (previously grown for 20 days in doxycycline) KMS-11 cells in the presence or absence of WP1130 and determined cell viability after 48 hours. As was seen in the shRNA naïve cells, shUCHL1 resistant KMS-11 cells were profoundly sensitive to WP1130 with approximately 80% cell death at 48 hours (Figure 7B). Because WP1130 inhibits other DUBs in addition to UCH-L1, these data are consistent with, but not demonstrative of, continued UCH-L1 dependence. Continued transcription of the shRNA was confirmed by blotting for the embedded RFP reporter (Figure 7C, 7D). The re-expression of UCH-L1 protein was accompanied by a recovery of UCHL1 mRNA – but not beyond the level seen at baseline (Figure 7E). Lastly, we examined the integrity of the shRNA binding site in cells at recovery and found no evidence of mutation through Sanger sequencing (Figure 7F). Based on these data, we conclude that the relapse of myeloma following shRNA depletion of UCH-L1 results from a loss of efficacy of the UCHL1 targeting shRNA, and not due to loss of dependence on UCH-L1.
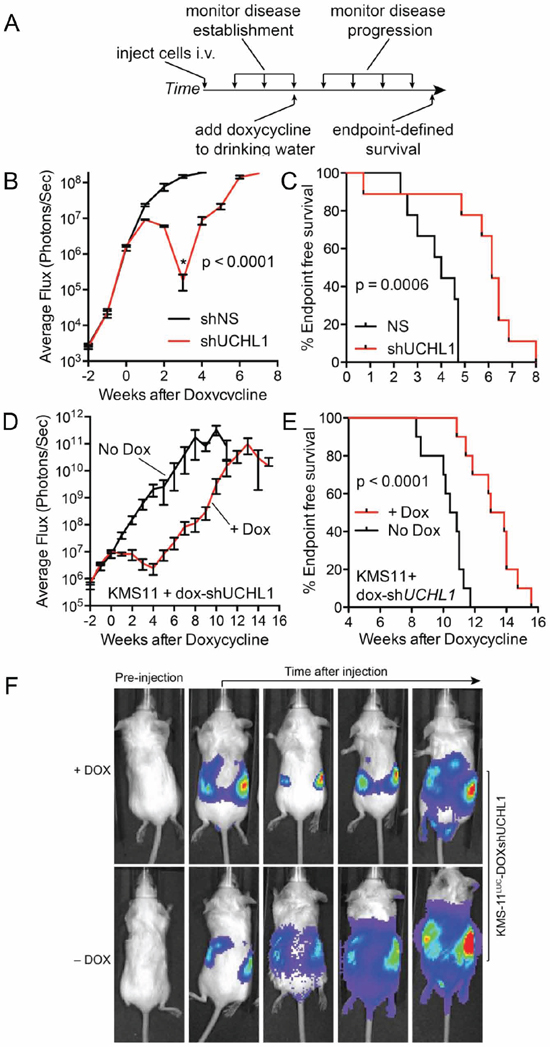
Figure 6: UCH-L1 depletion leads to the regression of disseminated myeloma in mice. A. Schematic overview of the experimental design used in (B–F) B. SCID-Beige mice were injected i.v. with KMS-11LUC cells transduced with either control (non-silencing; shNS) or UCHL1 targeting (shUCHL1) shRNAs under the control of a doxycycline-inducible promoter. Once disseminated myeloma was established as evidenced by BLI intensity, doxycycline was added to the drinking water of both cohorts. Mean (+/− SEM) BLI intensity was plotted for each time point. Statistics performed using the 2-tailed unpaired t-test. C. End-point free survival (Kaplan-Meyer) for mice in (B) Statistics performed with the Mantel-Cox log rank test. D. SCID-Beige mice were injected with KMS-11LUC cells transduced with UCH-L1 targeting (shUCHL1) shRNA under the control of a doxycycline-inducible promoter. Mice were divided into 2 cohorts (n = 10 each) that were either fed standard drinking water, or water containing doxycycline. BLI intensity mean (+/− SEM) was plotted for each cohort. Statistics performed using the 2-tailed unpaired t-test. E. End-point free survival (Kaplan-Meyer) for mice in (D) Statistics performed with the Mantel-Cox log rank test. F. Representative BLI images from mice in (D).
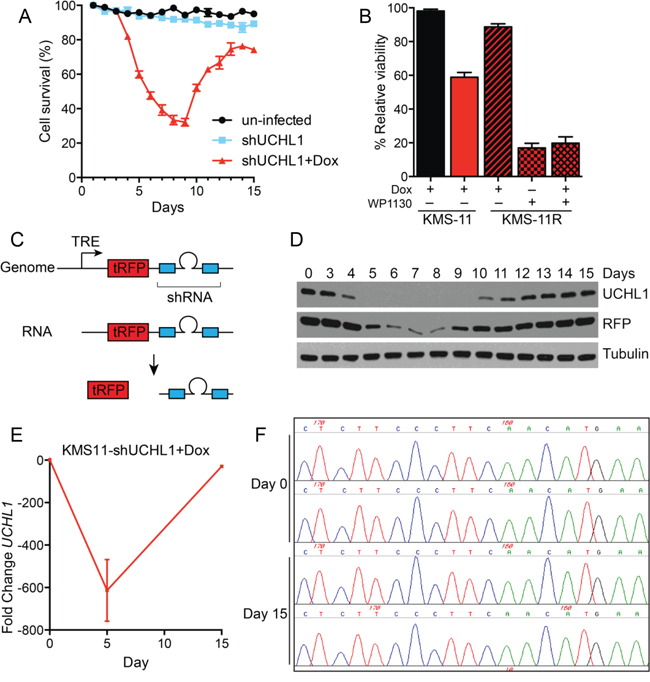
Figure 7: Myeloma recovery following UCH-L1 depletion is accompanied by the re-expression of UCH-L1. A. KMS-11 cells transduced or not with dox-inducible UCHL1 targeting shRNA were cultured with doxycycline and cell viability was determined daily using the MTS assay. The graph represents the mean +/− SEM of triplicate cultures. Similar results were obtained in more than three independent experiments. B. The DUB inhibitor WP1130 induces cell death in shRNA-resistant KMS-11 cells. KMS-11 cells transduced with shRNA as in (A) were cultured for 15 days, and shRNA resistant cells were subsequently cultured with WP1130 (5 μM) where indicated. Cell viability was monitored after 48 hours as in (A) C. Schematic of the structure of the lentiviral shRNA construct. TRE = tetracycline responsive element, tRFP = turbo Red Fluorescent Protein. D. Samples from cells grown in (A) were collected on the indicated days and immunoblotted for the indicated proteins. E. Quantitative real-time PCR (qRT-PCR) was conducted on cells from (A) on the indicated days. The relative fold-change UCHL1 levels were determined using the delta-delta Ct method. F. Genomic DNA was isolated from cells in (A) on the indicated days. Following PCR amplification of a 3′-region of the UCHL1 gene, Sanger sequencing was performed on the region bound by the shRNA (chr4: 41270121-41) as indicated. The image represents chromatograms of two samples each for day 0 (pre-doxycycline) and on day 15 when cells had recovered.
DISCUSSION
The unexpected success of the proteasome inhibitor bortezomib in the treatment of multiple myeloma focused attention on the role of the ubiquitin-proteasome system in the pathogenesis of this disease and other cancers. Using gene expression profiling and mouse models, here we show that UCHL1 is a biomarker of aggressive treatment refractory disease in humans, and is required for the in vivo progression of MM in mice. These results, together with the recent identification of the ubiquitin E3 ligase cereblon as the target for immunomodulatory drugs such as thalidomide that also are highly active against MM [34, 35], demonstrate that the ubiquitination status of target proteins also has an important role in the pathogenesis of myeloma. The importance of deubiquitinating enzymes in myeloma pathogenenesis, and their potential as drug targets, was recently demonstrated using an inhibitor targeting USP7 [15], and another targeting UCH-L5 and USP14, two proteasome-associated DUBs [14]. Our results here add to this data and demonstrate an additional role for UCH-L1 in myeloma biology, and further suggest that small molecule inhibitors may be effective in the disease.
UCH-L1 as a biomarker of aggressive multiple myeloma
We find that UCH-L1 is a marker of MM patients with inferior prognosis at initial diagnosis, and at relapse. While the data need to be verified with primary samples in a prospective manner, these results are significant in that they may allow for more individualized therapy, with more aggressive treatment reserved for those at higher risk of early relapse. As these analyses utilize gene expression profiling cut-off values for defining high UCHL1 levels, more work will be required to define a level of UCHL1 expression defined by immunohistochemistry that may be useful in prospectively identifying patients at higher risk for early progression. Our findings related to therapeutic response are also intriguing as they suggest that bortezomib is required for optimal outcomes in patients with UCHL1HI disease, with inferior outcomes seen in those treated with the complex multi-agent TT2 regimen, but not in TT3 that further incorporated bortezomib. The analysis of the TT3 data are limited, however, in that the available follow up is relatively short (median = 23 months) and there are relatively few events (15 events in 208 patients = 7%). To further examine the impact of UCHL1 on drug response, however, results were reinforced in the head-to-head comparison between bortezomib and dexamethasone. In fact, if one looks only at UCHL1LO cases on the APEX trial, there is no advantage to bortezomib over dexamethasone, suggesting that UCHL1 is an important biomarker for patients who will most benefit from this treatment.
Our data do not, however, suggest that cases with high levels of UCH-L1 are more sensitive to bortezomib compared with those having low levels. Rather, the data suggest that the UCHL1HI cases are relatively resistant to the other therapies included in TT2 and APEX studies. This is an important distinction as previous cell biology work in fact predicted that high levels of UCH-L1 might facilitate proteasome inhibitor resistance [36], though this prior work was primarily performed in Burkitt lymphoma cells with high levels of MYC. In the myeloma datasets included here, there was no relationship between UCHL1 and MYC levels (data not shown). Several signaling networks have been implicated in drug resistance in myeloma [37]. While our previously published biochemical data [21] strongly implicate the role of UCH-L1 in regulating mTOR-AKT signaling likely contributes to this phenomenon, further work is needed to fully characterize the resistance networks deranged by UCH-L1.
Our previous work revealed that transgenic mice over-expressing UCH-L1 developed B-cell lymphomas and plasmacytomas, demonstrating that UCH-L1 is not simply another gene that associates with prognosis – but rather is a mechanistic biomarker involved in disease pathogenesis. In addition to the impact of UCH-L1 in mTOR-Akt signaling, the association between high levels of UCHL1 and the expression signature of t(4;14) and del1q21 may contribute to the poor prognosis in these patients, as these structural defects is known to afford a high-risk of early recurrence [1, 2]. The genetic and/or biochemical relationship between t(4;14) and UCHL1 levels is unknown. While UCHL1 lies on chromosome 4, it is separated from the FGFR3/WHSC1 locus by nearly 40 megabases, making a direct effect of the translocation on UCHL1 transcription unlikely. The t(4;14) deregulates the expression of two genes with relevance to cancer FGFR3 and the histone methyltransferase MMSET [29]. While it seems plausible that overexpression of either gene may stimulate its expression in MM, no changes in UCHL1 expression were observed upon inhibition or depletion of either gene [31, 38]. Using CD27 levels as a surrogate, we found no association between UCH-L1 and the recently described del12p (data not shown) [39].
UCH-L1 is required for myeloma cell survival
There have been many conflicting reports regarding the impact of UCH-L1 expression in human malignancy, with some citing oncogenic effects while others demonstrating a tumor suppressive effect. A potential explanation behind the varied impact of UCH-L1 on tumor cell survival may be its ability to inhibit the activity of mTOR complex 1 (mTORC1) and stimulate mTORC2. We previously reported an extensive biochemical analysis of the impact of UCH-L1 on the mTOR-Akt signaling pathway and found its expression to promote mTORC2 phosphorylation of Akt in three independent myeloma cell lines, in primary B-cells from mice, in HeLa and 293T cells, and in the brain – a mammalian tissue with high levels of endogenous UCH-L1 [21]. Given the role of UCH-L1 in modulating mTOR-Akt signaling, and the strong impact this has on myeloma cell survival, these data strongly implicate the Akt survival pathway as being essential in MM cells expressing UCH-L1. This notion is further supported by our previous data in which the survival of UCH-L1 depleted myeloma cell lines was rescued by a constitutively active Akt construct (myrAkt) [12]. Several recent reports detail the increased activity of the PI3K-Akt signaling pathways in MM [40–42], with small molecule inhibitors having activity in vitro and in vivo [43–45]. Bortezomib has been shown to activate Akt signaling [44]. It is possible that this contributes to our observation that UCH-L1 depletion (resulting in reduced Akt phosphorylation) enhanced caspase activation in response to bortezomib. Our work with the available inhibitor LDN-57444 [46] suggests that it has non-specific toxicity on MM cells such that it kills both UCH-L1 expressing and non-expressing cells (data not shown). The availability of specific cell permeable inhibitors targeting UCH-L1 would greatly facilitate these types of experiments with the orthotopic mouse model of UCH-L1 depletion a good model in which to test such inhibitors.
MATERIALS AND METHODS
Mice
SCID-Beige mice (8–10 weeks) were purchased from Charles Rivers Laboratories, Inc. (Wilmington, MA). All mice were housed in a pathogen-free barrier facility. All protocols involving mice were reviewed and approved by the Mayo Clinic Institutional Animal Care and Use Committee.
Cell culture
KMS-11, KMS-18, and KMS-28 cells were cultured and transduced with shRNAs and characterized as previously described [12, 21]. KMS-11LUC luciferase-expressing cells were generated by lentiviral transduction of PHR-SiN-Luciferase prepared as described [47]. In vitro expression of shRNA was induced by the addition of 1 mg/ml doxycycline (dox) to complete medium. Where indicated, bortezomib or dexamethasone (Selleckchem, Houston, TX) was included at the indicated concentrations. Where indicated, WP1130 (Selleckchem) was added to a final concentration of 5 μM. Cell viability was monitored using the CellTiter AQueous One Solution Cell Proliferation Assay (Promega, Madison, WI). Caspase activity was determined with the Caspase-glo (3/7) Assay System (Promega). In vivo shRNA expression was induced with 2 mg/ml−1 dox in drinking water supplemented with 5% sucrose.
Orthotopic model of MM
Orthotopic mouse model of MM was established as described [48]. Briefly, 24 hours prior to tail van injection, female SCID-Beige mice were irradiated at 3 Gy. KMS-11LUC cells (1 × 10⁷) were suspended in 200 μl PBS and injected via tail vein. The development and progression of disease was monitored at regular intervals using the IVIS 200 imaging system (Xenogen corporation, CA) through the Mayo Clinic Animal Imaging Shared Resource. Prior to imaging each mouse received 150 mg/kg XenoLight D-Luciferin potassium salt (PerkinElmer, #122796) via intra peritoneal injection. Histological analysis was performed on decalcified and formalin-fixed mouse femur sections. The antibodies used include goat anti-rabbit UCH-L1 (Cell Signaling Technologies, #13179, 1:50), and mouse anti-human CD138 (Dako, #M7228, 1:150). Biotin-conjugated secondary antibodies were purchased from Vector Labs.
Analysis of gene expression data and statistical analyses
Data were extracted from GSE2658, GSE9782, GSE24746 and GSE29148 from Gene Expression Omnibus (GEO; http://www.ncbi.nlm.nih.gov/gds) or the R2: microarray analysis and visualization platform (http://r2.amc.nl). In GSE9782, only those patients identified as “study code 39” were analyzed (APEX trial). The designation between UCHL1 LO/HI was set at the 75% percentile unless otherwise noted. T+C classifications were made according to published criteria [28]. Histone H3K36me2 ChIP-seq data were analyzed using the available genome browser tracks (http://dldcc-web.brc.bcm.edu/lilab/NSD2/). Graphs were generated using GraphPad Prism software. All statistical calculations were performed using GraphPad Prism software with the exception of the Cox proportional hazards analysis, which was performed using the JMP software package. Survival data were analyzed with the Log-rank (Mantel-Cox) test as indicated. Histograms were analyzed as indicated using the 2-tailed unpaired t test. Correlation was assessed using the Pearson's r test. Statistical analysis was performed with the assistance of the Mayo Clinic Center for Clinical and Translational Science.
ACKNOWLEDGMENTS AND FUNDING
We would like to thank Drs. Stephen Ansell, and Richard Bram for critical reading of the manuscript, and the members of the Galardy and van Deursen laboratories for scientific discussions.
CONFLICTS OF INTEREST
P.J.G receives research funding from Mission Therapeutics (Cambridge, U.K.) to conduct experiments that are not included in this manuscript. P.L.B. is a consultant for Janssen Pharmaceuticals, Onyx (B), Sanofi, Bristol Myers Squibb, MundiPharma, and Novartis, and receives research funding from Constellation Pharmaceuticals and Novartis The other authors have no relevant conflicts to declare.
GRANT SUPPORT
P.J.G is a former Harriet H. Samuelsson Foundation Pediatric Cancer Research Scientist, is a former Basic Science Scholar of the American Society of Hematology, and is supported by grants from the NIH (CA151351-01), Howard Hughes Medical Institute Physician Scientist Early Career Award, Gabrielle's Angels Cancer Research Foundation, the Multiple Myeloma Research Foundation, and the Mayo Foundation.
REFERENCES
1. Kumar SK, Rajkumar SV, Dispenzieri A, Lacy MQ, Hayman SR, Buadi FK, Zeldenrust SR, Dingli D, Russell SJ, Lust JA, Greipp PR, Kyle RA, Gertz MA. Improved survival in multiple myeloma and the impact of novel therapies. Blood. 2008; 111:2516–2520.
2. Palumbo A, Anderson K. Multiple myeloma. N Engl J Med. 2011; 364:1046–1060.
3. Shah JJ, Orlowski RZ. Proteasome inhibitors in the treatment of multiple myeloma. Leukemia. 2009; 23:1964–1979.
4. Chauhan D, Bianchi G, Anderson KC. Targeting the UPS as therapy in multiple myeloma. BMC Biochem. 2008; 9:S1.
5. Chauhan D, Hideshima T, Anderson KC. Targeting proteasomes as therapy in multiple myeloma. Adv Exp Med Biol. 2008; 615:251–260.
6. Tomko RJ Jr, Hochstrasser M. Molecular architecture and assembly of the eukaryotic proteasome. Annu Rev Biochem. 2013; 82:415–445.
7. Varshavsky A. The ubiquitin system, an immense realm. Annu Rev Biochem. 2012; 81:167–176.
8. Hussain S, Zhang Y, Galardy PJ. DUBs and cancer: The role of deubiquitinating enzymes as oncogenes, non-oncogenes and tumor suppressors. Cell Cycle. 2009; 8.
9. Komander D, Rape M. The ubiquitin code. Annu Rev Biochem. 2012; 81:203–229.
10. Zhang Y, Foreman O, Wigle DA, Kosari F, Vasmatzis G, Salisbury JL, van Deursen J, Galardy PJ. USP44 regulates centrosome positioning to prevent aneuploidy and suppress tumorigenesis. J Clin Invest. 2012; 122:4362–4374.
11. Zhang Y, van Deursen J, Galardy PJ. Overexpression of ubiquitin specific protease 44 (USP44) induces chromosomal instability and is frequently observed in human T-cell leukemia. PLoS ONE. 2011; 6:e23389.
12. Hussain S, Foreman O, Perkins SL, Witzig TE, Miles RR, van Deursen J, Galardy PJ. The de-ubiquitinase UCH-L1 is an oncogene that drives the development of lymphoma in vivo by deregulating PHLPP1 and Akt signaling. Leukemia. 2010; 24:1641–1655.
13. Pal A, Young MA, Donato NJ. Emerging potential of therapeutic targeting of ubiquitin-specific proteases in the treatment of cancer. Cancer Res. 2014; 74:4955–4966.
14. Tian Z, D’Arcy P, Wang X, Ray A, Tai YT, Hu Y, Carrasco RD, Richardson P, Linder S, Chauhan D, Anderson KC. A novel small molecule inhibitor of deubiquitylating enzyme USP14 and UCHL5 induces apoptosis in multiple myeloma and overcomes bortezomib resistance. Blood. 2014; 123:706–716.
15. Chauhan D, Tian Z, Nicholson B, Kumar KG, Zhou B, Carrasco R, McDermott JL, Leach CA, Fulcinniti M, Kodrasov MP, Weinstock J, Kingsbury WD, Hideshima T, Shah PK, Minvielle S, Altun M, et al. A small molecule inhibitor of ubiquitin-specific protease-7 induces apoptosis in multiple myeloma cells and overcomes bortezomib resistance. Cancer Cell. 2012; 22:345–358.
16. Otsuki T, Yata K, Takata-Tomokuni A, Hyodoh F, Miura Y, Sakaguchi H, Hatayama T, Hatada S, Tsujioka T, Sato Y, Murakami H, Sadahira Y, Sugihara T. Expression of protein gene product 9.5 (PGP9.5)/ubiquitin-C-terminal hydrolase 1 (UCHL-1) in human myeloma cells. Br J Haematol. 2004; 127:292–298.
17. Ovaa H, Kessler BM, Rolen U, Galardy PJ, Ploegh HL, Masucci MG. Activity-based ubiquitin-specific protease (USP) profiling of virus-infected and malignant human cells. Proc Natl Acad Sci U S A. 2004; 101:2253–2258.
18. Wilkinson KD, Lee KM, Deshpande S, Duerksen-Hughes P, Boss JM, Pohl J. The neuron-specific protein PGP 9.5 is a ubiquitin carboxyl-terminal hydrolase. Science. 1989; 246:670–673.
19. Hurst-Kennedy J, Chin LS, Li L. Ubiquitin C-terminal hydrolase l1 in tumorigenesis. Biochem Res Int. 2012; 2012:123706.
20. Goto Y, Zeng L, Yeom CJ, Zhu Y, Morinibu A, Shinomiya K, Kobayashi M, Hirota K, Itasaka S, Yoshimura M, Tanimoto K, Torii M, Sowa T, Menju T, Sonobe M, Kakeya H, et al. UCHL1 provides diagnostic and antimetastatic strategies due to its deubiquitinating effect on HIF-1alpha. Nat Commun. 2015; 6:6153.
21. Hussain S, Feldman AL, Das C, Ziesmer SC, Ansell SM, Galardy PJ. Ubiquitin hydrolase UCH-L1 destabilizes mTOR complex 1 by antagonizing DDB1-CUL4-mediated ubiquitination of raptor. Mol Cell Biol. 2013; 33:1188–1197.
22. Kabuta T, Mitsui T, Takahashi M, Fujiwara Y, Kabuta C, Konya C, Tsuchiya Y, Hatanaka Y, Uchida K, Hohjoh H, Wada K. Ubiquitin C-terminal hydrolase L1 (UCH-L1) acts as a novel potentiator of cyclin-dependent kinases to enhance cell proliferation independently of its hydrolase activity. J Biol Chem. 2013; 288:12615–12626.
23. Bheda A, Yue W, Gullapalli A, Whitehurst C, Liu R, Pagano JS, Shackelford J. Positive reciprocal regulation of ubiquitin C-terminal hydrolase L1 and beta-catenin/TCF signaling. PLoS ONE. 2009; 4:e5955.
24. Brinkmann K, Zigrino P, Witt A, Schell M, Ackermann L, Broxtermann P, Schull S, Andree M, Coutelle O, Yazdanpanah B, Seeger JM, Klubertz D, Drebber U, Hacker UT, Kronke M, Mauch C, et al. Ubiquitin C-terminal hydrolase-L1 potentiates cancer chemosensitivity by stabilizing NOXA. Cell Rep. 2013; 3:881–891.
25. Bheda A, Gullapalli A, Caplow M, Pagano JS, Shackelford J. Ubiquitin editing enzyme UCH L1 and microtubule dynamics: implication in mitosis. Cell Cycle. 2010; 9:980–994.
26. Hanamura I, Huang Y, Zhan F, Barlogie B, Shaughnessy J. Prognostic value of cyclin D2 mRNA expression in newly diagnosed multiple myeloma treated with high-dose chemotherapy and tandem autologous stem cell transplantations. Leukemia. 2006; 20:1288–1290.
27. Mulligan G, Mitsiades C, Bryant B, Zhan F, Chng WJ, Roels S, Koenig E, Fergus A, Huang Y, Richardson P, Trepicchio WL, Broyl A, Sonneveld P, Shaughnessy JD Jr., Bergsagel PL, Schenkein D, et al. Gene expression profiling and correlation with outcome in clinical trials of the proteasome inhibitor bortezomib. Blood. 2007; 109:3177–3188.
28. Bergsagel PL, Kuehl WM, Zhan F, Sawyer J, Barlogie B, Shaughnessy J Jr. Cyclin D dysregulation: an early and unifying pathogenic event in multiple myeloma. Blood. 2005; 106:296–303.
29. Chesi M, Nardini E, Lim RS, Smith KD, Kuehl WM, Bergsagel PL. The t(4,14) translocation in myeloma dysregulates both FGFR3 and a novel gene, MMSET, resulting in IgH/MMSET hybrid transcripts. Blood. 1998; 92:3025–3034.
30. Kuo AJ, Cheung P, Chen K, Zee BM, Kioi M, Lauring J, Xi Y, Park BH, Shi X, Garcia BA, Li W, Gozani O. NSD2 links dimethylation of histone H3 at lysine 36 to oncogenic programming. Mol Cell. 2011; 44:609–620.
31. Martinez-Garcia E, Popovic R, Min DJ, Sweet SM, Thomas PM, Zamdborg L, Heffner A, Will C, Lamy L, Staudt LM, Levens DL, Kelleher NL, Licht JD. The MMSET histone methyl transferase switches global histone methylation and alters gene expression in t(4,14) multiple myeloma cells. Blood. 2011; 117:211–220.
32. Shaughnessy JD Jr., Zhan F, Burington BE, Huang Y, Colla S, Hanamura I, Stewart JP, Kordsmeier B, Randolph C, Williams DR, Xiao Y, Xu H, Epstein J, Anaissie E, Krishna SG, Cottler-Fox M, et al. A validated gene expression model of high-risk multiple myeloma is defined by deregulated expression of genes mapping to chromosome 1. Blood. 2007; 109:2276–2284.
33. Kapuria V, Peterson LF, Fang D, Bornmann WG, Talpaz M, Donato NJ. Deubiquitinase inhibition by small-molecule WP1130 triggers aggresome formation and tumor cell apoptosis. Cancer Res. 2010; 70:9265–9276.
34. Ito T, Ando H, Suzuki T, Ogura T, Hotta K, Imamura Y, Yamaguchi Y, Ha H. Identification of a primary target of thalidomide teratogenicity. Science. 2010; 327:1345–1350.
35. Zhu YX, Braggio E, Shi CX, Bruins LA, Schmidt JE, Van Wier S, Chang XB, Bjorklund CC, Fonseca R, Bergsagel PL, Orlowski RZ, Stewart AK. Cereblon expression is required for the antimyeloma activity of lenalidomide and pomalidomide. Blood. 2011; 118:4771–4779.
36. Gavioli R, Frisan T, Vertuani S, Bornkamm GW, Masucci MG. c-myc overexpression activates alternative pathways for intracellular proteolysis in lymphoma cells. Nat Cell Biol. 2001; 3:283–288.
37. Abdi J, Chen G, Chang H. Drug resistance in multiple myeloma: latest findings and new concepts on molecular mechanisms. Oncotarget. 2013; 4:2186–2207.
38. Masih-Khan E, Trudel S, Heise C, Li Z, Paterson J, Nadeem V, Wei E, Roodman D, Claudio JO, Bergsagel PL, Stewart AK. MIP-1alpha (CCL3) is a downstream target of FGFR3 and RAS-MAPK signaling in multiple myeloma. Blood. 2006; 108:3465–3471.
39. Li F, Xu Y, Deng P, Yang Y, Sui W, Jin F, Hao M, Li Z, Zang M, Zhou D, Gu Z, Ru K, Wang J, Cheng T, Qiu L. Heterogeneous chromosome 12p deletion is an independent adverse prognostic factor and resistant to bortezomib-based therapy in multiple myeloma. Oncotarget. 2015.
40. Hyun T, Yam A, Pece S, Xie X, Zhang J, Miki T, Gutkind JS, Li W. Loss of PTEN expression leading to high Akt activation in human multiple myelomas. Blood. 2000; 96:3560–3568.
41. Tu Y, Gardner A, Lichtenstein A. The phosphatidylinositol 3-kinase/AKT kinase pathway in multiple myeloma plasma cells: roles in cytokine-dependent survival and proliferative responses. Cancer Res. 2000; 60:6763–6770.
42. Hideshima T, Nakamura N, Chauhan D, Anderson KC. Biologic sequelae of interleukin-6 induced PI3-K/Akt signaling in multiple myeloma. Oncogene. 2001; 20:5991–6000.
43. Mimura N, Hideshima T, Shimomura T, Suzuki R, Ohguchi H, Rizq O, Kikuchi S, Yoshida Y, Cottini F, Jakubikova J, Cirstea D, Gorgun G, Minami J, Tai YT, Richardson PG, Utsugi T, et al. Selective and potent Akt inhibition triggers anti-myeloma activities and enhances fatal endoplasmic reticulum stress induced by proteasome inhibition. Cancer Res. 2014.
44. Hideshima T, Catley L, Yasui H, Ishitsuka K, Raje N, Mitsiades C, Podar K, Munshi NC, Chauhan D, Richardson PG, Anderson KC. Perifosine, an oral bioactive novel alkylphospholipid, inhibits Akt and induces in vitro and in vivo cytotoxicity in human multiple myeloma cells. Blood. 2006; 107:4053–4062.
45. Zhu J, Wang M, Yu Y, Qi H, Han K, Tang J, Zhang Z, Zeng Y, Cao B, Qiao C, Zhang H, Hou T, Mao X. A novel PI3K inhibitor PIK-C98 displays potent preclinical activity against multiple myeloma. Oncotarget. 2015; 6:185–195.
46. Liu Y, Lashuel HA, Choi S, Xing X, Case A, Ni J, Yeh LA, Cuny GD, Stein RL, Lansbury PT Jr. Discovery of inhibitors that elucidate the role of UCH-L1 activity in the H1299 lung cancer cell line. Chem Biol. 2003; 10:837–846.
47. Neff BA, Voss SG, Allen C, Schroeder MA, Driscoll CL, Link MJ, Galanis E, Sarkaria JN. Bioluminescent imaging of intracranial vestibular schwannoma xenografts in NOD/SCID mice. Otol Neurotol. 2009; 30:105–111.
48. Xin X, Abrams TJ, Hollenbach PW, Rendahl KG, Tang Y, Oei YA, Embry MG, Swinarski DE, Garrett EN, Pryer NK, Trudel S, Jallal B, Mendel DB, Heise CC. CHIR-258 is efficacious in a newly developed fibroblast growth factor receptor 3-expressing orthotopic multiple myeloma model in mice. Clin Cancer Res. 2006; 12:4908–4915.