
INTRODUCTION
Alternative splicing (AS) functions as a prevalent mechanism in expanding the genetic diversity of eukaryotic cells [1]. Approximately 90% of human genes generate more than one transcript through this meticulously controlled process [2, 3]. The interplay between splicing factors and cis-elements constitutes the molecular mechanism in programming the splicing profile in spatiotemporal manners [4]. Altering expression levels or cellular localization directly changess the activity of splicing factors on AS events [5, 6]. The imbalanced expression or aberrant distribution of splicing factors is considered a common cause of hereditary diseases and cancers [7, 8]. An upregulated level of SRSF10 with a concomitant increase in the BCLAF1+exon 5a isoform contributed to the active progression of colorectal cancer (CRC) [9]. An increase in polypyrimidine tract binding (PTB) protein induced the proliferation and progression of cancer cells compared with normal cell lines [10]. The imbalanced AS is a molecular occasion of carcinogenic signatures such as cellular immortality, invasion, and metastasis [11–13].
RBM4 was reported to reprogram a group of muscle-related genes and consequently facilitated differentiation of skeletal muscle cells [14]. During myogenesis, RBM4 synergized its influence by triggering the AS-coupled nonsense-mediated decay of the polypyrimidine tract-binding (PTB) protein and its paralog, neuronal (n)PTB [14]. In multiple cancer cells, RBM4 and PTB proteins exerted opposite effects on the carcinogenic signatures [15, 16]. RBM4 sensitized breast cancer cells toward a cytotoxic agent by modulating the splicing profile of the insulin receptor and MCL-1 genes [17]. Overexpressing RBM4 antagonized the effect of oncogenic factors, including PTB and SRSF1 proteins in breast, lung, and prostate cancer cells [15].
PTB and nPTB are encoded by two paralogous genes and have highly similar RNA recognition motifs (RRMs), implying that they share RNA-binding properties [18]. Expression of PTB is ubiquitous but substantial among multiple tissues, whereas nPTB is mainly expressed in neuronal cells and testis [19, 20]. The extensively studied functions of the two PTB proteins are regulation of tissue-specific splicing events [21]. For instance, cross-regulation among miR-124, PTB, and nPTB constituted a molecular mechanism for the development of neuronal cells [22]. Upregulated expression of PTB and nPTB enhanced the progression of ovarian, breast cancer and glioma cells, and their expressions were highly relevant to the degree of malignancy [23–25]. The underlying mechanism for the cancer-associated upregulation of PTB/nPTB remained to be further investigated.
Herein, we assessed the influence of RBM4-regulated splicing cascade on the carcinogenic signature of CRC cells. Upregulated miR-92a reduced RBM4 expression by targeting to its coding region, which subsequently led to the increase in exon 10-included nPTB transcript in CRC tissues and cell lines. The RBM4-nPTB circuit modulated the invasion, migration, and mitochondrial activity of CRC cells by programming the splicing profiles of FGFR2 and PKM genes.
RESULTS
RBM4 expression is reduced in cancerous tissues of CRC patients
RBM4 was demonstrated as a tumor suppressor in various malignancies, including breast, lung, ovarian, liver, and prostate cancer [15, 17]. To further investigate influences of RBM4 on distinct malignancies, such as CRC, its relevance in clinical tissue samples was first validated. Compared to adjacent normal tissues, reduced levels of the RBM4 protein were widely observed in cancerous tissues of CRC patients (Fig. 1A). A densitometric analysis of immunoblotting images showed about a 30% reduction in RBM4 in cancerous tissues (Fig. 1A, bar graph). Our previous study reported that RBM4 reduced the nPTB protein through the AS-coupled NMD in differentiating myocytes [14]. As expected, an increase in nPTB (~2.85-fold) was noted in cancerous tissues compared to adjacent normal tissues (Fig. 1A). The immunoblot results also revealed similar expression profiles of RBM4 and nPTB in distinct CRC cell lines, including HCT-8 and Colo205 cells as that of cancerous tissues (Fig. 1B). In contrast, the relatively high level of RBM4 with a concomitant decline in nPTB protein was observed in HCT-116 cells (Fig. 1B). The loss of RBM4 may result in the imbalanced expression of nPTB in CRC tissues and cells, which consequently reprogrammed splicing profiles in CRC cells.
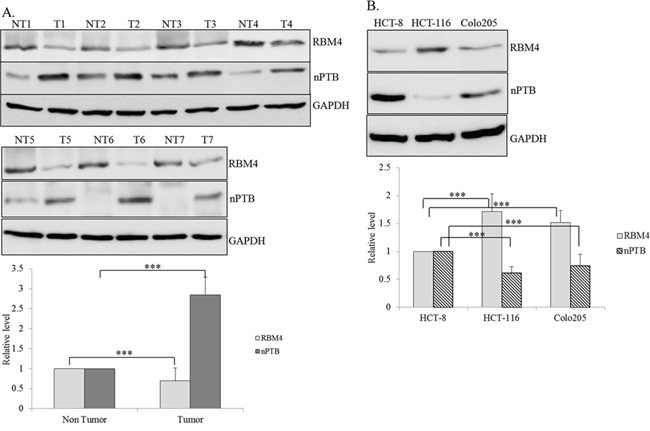
Figure 1: Differential expressions of RNA-binding motif 4 [RBM4] and neuronal polypyrimidine tract-binding protein [nPTB] in colorectal cancer [CRC] tissues and cell lines. A. Protein extracts prepared from human CRC tissues [T] and adjacent non-cancerous tissues [NT] were subjected to an immunoblot assay using the indicated antibodies. The bar graph presents relative levels of RBM4 and nPTB in CRC tissues [n = 7]. B. Cell lysates isolated from distinct CRC cells were subjected to an immunoblot assay with the indicated antibodies. The bar graph shows relative levels of RBM4 and nPTB in three independent experiments using TotalLab Quant Software [*p < 0.05; **p < 0.01; ***p < 0.005].
CRC-associated miRNA reduces the expression of RBM4
RBM4 expression was controlled through multilayer regulation, including autoregulated AS and transcriptional control in differentiating brown adipocytes [27, 28]. However, microRNAs (miRNAs) constituted a posttranscriptional control in fine-tuning the protein expression profiles, which may also reduce RBM4 expression. The miRNA expression profiles in CRC tissues has been investigated using array analysis and further validated by quantitative approaches [29]. Forty-two upregulated CRC-related miRNAs (fold change > 2, q value < 0.05; 29) which contributed to CRC carcinogenesis were included for the following prediction (Supplementary Table 2). The folding energy of putative miRNA-RBM4 pair was estimated using RNA22 V2.0 algorithm, a pattern-based program for identifying miRNA target site [30]. Supplementary Table 1 showed the predicted folding energies of thirteen miRNA-hRBM4 pairs, which were generated by aligning the sequence of RBM4 coding region or 3′-UTR with the mature miRNAs sequence in RNA22 2.0 algorithm. The folding energies of these thirteen heteroduplexes were next calculated using RNAhybrid algorithm. One miR-92a targeting site was identified within the RBM4 coding region (Fig. 2A, left) and two miR-17 targeting sites were predicted to reside in the coding region and 3′-UTR (Supplementary Table 1). The putative miR-92a binding site is conserved within RBM4 transcripts in multiple species (Fig. 2A, right). In view of the low folding energy of miR-92a RBM4 pair (-19.2 Kcal/mol), the cross-species homology of miR-92a target site and the oncogenic effect of miR-92a on CRC [31], we next validated the effect of miR-92a on RBM4 reduction in CRC tissues and cells (Fig. 1A and 1B). A relatively high level of miR-92a was shown in cancerous tissues compared to adjacent normal tissues by a polyadenylation-coupled RT-PCR (Fig. 2A, n = 7). Results of real-time PCR analyses further indicated that the elevated miR-92a could be originated from primary miR-92a-1 and miR-92a-2 (n = 20, bar chart). The relatively high levels of miR-92a in HCT-8 and Colo205 cells (Fig. 2B) were relevant to the reduced RBM4 levels in those cells (Fig. 1B) even though the influence of miR-92a on RBM4 expression may have varied in the colorectal adenocarcinoma-derived (HCT8) and carcinoma-derived (Colo205) cell lines. To evaluate the targeting specificity of miR-92a toward RBM4 transcripts, the miR-92a-2 expression vector was mutated by guanine-to-thymidine or adenine-to-cytosine substitutions at the second nucleotide within the seed sequence of miR-92a-2-5p and miR-92a-2-3p. Immunoblotting results showed the reduction of endogenous RBM4 protein with a concomitant increase in the nPTB protein in the presence of overexpressing miR-92a-2-3p (Fig. 2C, WT and m5p), but not miR-92a-2-5p (Fig. 2C, m3p) in HCT-116 cells. We next explored the validity of the bioinformatic forecast using in vivo and in vitro translation assays in turn. The Renilla luciferase reporter containing the miR-92a targeting site within the coding region of the hRBM4 gene was constructed, and the derived mutant was next made by the thymidine-to-guanosine substitution in the second nucleotide of this targeting site. The activities of WT or mutant reporter were examined in the presence of empty or miR-92a-2-3p expressing vector in HCT-116 cells which expressed a relatively low level of miR-92a. The presence of the miR-92a targeting site reduced the activity of Renilla luciferase to about 71.4% of the level of the original reporter (Fig. 2D, lanes 1 and 2), whereas the single-nucleotide substitution of the miR-92a targeting element (Fig. 2D upper, T372G) partially restored the reduced activity (lane 3). Overexpressing miR-92a-2-3p further reduced the activity of the Renilla reporter containing the targeting site (lane 5), but not the derived mutant (lane 6). Moreover, the single-nucleotide substitution of miR-92a-2-3p, but not miR-92a-2-5p, relieved its repressive effect on the activity of the Renilla reporter containing the miR-92a target site (Fig. 2E, lane 8).
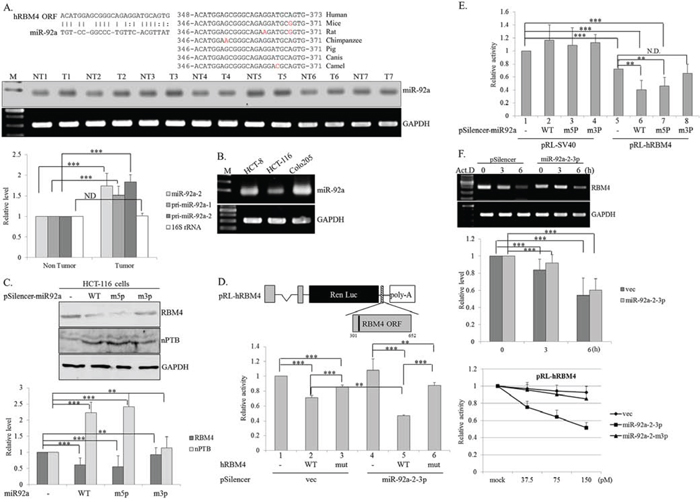
Figure 2: Targeting of miR92a-2-3p reduces the expression of RNA-binding motif 4 [RBM4] in colorectal cancer [CRC] cells. A. The scheme represents the alignment between miR-92a and the non-canonical binding site within the human RBM4 coding region [left]. The alignment result represents the conservation of the binding site within RBM4 gene in different species [right]. Total RNAs extracted from [A] CRC tissues and B. CRC cell lines were polyadenylated using poly[A] polymerase. Expressions of miR92a in CRC tissues and cells were analyzed using an RT-PCR [n = 7]. The bar graph represents the expression profiles of miR92a, pri-miR-92-1/2, and 16S rRNA in 20 pairs of CRC tissues using a qRT-PCR analysis. C. The protein extract was prepared from cells transfected with the expression vector of WT miR-92a-2 and derived mutants, followed by an immunoblot assay using the indicated antibodies. The bar graph presents the relative level of nPTB and RBM4 using TotalLab Quant Software [*p < 0.05; **p < 0.01; ***p < 0.005]. D. The scheme shows the Renilla luciferase reporter containing the miR-92a targeting site [black line]. The intact pRL-hRBM4 ORF reporter or its mutant was cotransfected with the expression vector of miR-92a-2 and the pFir-luc reference vector into HCT-116 cells. E. The intact pRL-hRBM4 or pRL-SV40 reporter was cotransfected with the expression vector of WT miR-92a-2 and derived mutants into HCT-116 cells. The bar graph shows the relative Renilla luciferase activity normalized to firefly luciferase activity F. Abundances of RBM4 transcripts in distinct groups were measured using an RT-PCR and qPCR assay. In vitro translation was performed with rabbit reticulocyte lysates and increasing amounts of overexpressing miR-92a-2 or the derived mutant. The translational activity was normalized to that in the reaction lacking overexpression of miR-92a. [*p < 0.05; **p < 0.01; ***p < 0.005].
Imperfect base-pairing between microRNA and the non-canonical binding site was widely identified to preferentially stall translation, instead of inducing degradation of the target gene [32]. To verify the molecular mechanism regarding the miR-92a-caused reduction of RBM4, the stability of RBM4 transcripts was validated in empty vector- or miR92a-2-3p-overexpressing cells after treatment with actinomycin D. Using RT-PCR and qPCR analyses, overexpression of miR-92a-2-3p had no distinct effect on the stability of RBM4 transcripts (Fig. 2F, upper and middle). In contrast, the cytoplasmic extract containing the overexpressing WT miR92a-2-3p (Fig. 2F, lower, square), but not the derived mutant (triangle), substantially reduced the translation of in vitro-transcribed RNA containing the miR-92a binding site. These results demonstrated the mechanistic role of miR-92a on RBM4 reduction in CRC tissues and cells.
RBM4 enhances exclusion of the nPTB exon 10 in CRC cells
AS-coupled NMD pathway constituted a molecular mechanism leading to the tissue-restricted expression of the nPTB protein [33]. As shown in Fig 3A, a substantial decrease in the nPTB−10 transcript, the AS-NMD substrate, was widely observed in CRC tissues compared to adjacent normal tissues (Fig. 3A, left). Densitometric analysis of RT-PCR images showed a 71% reduction in the nPTB−10 transcript (non-tumor: 47%; tumor: 14%) in cancerous tissues (Fig. 3A, right). Fig. 3B shows different splicing patterns of nPTB and its paralog, PTB, in CRC cell lines. The majority of nPTB and PTB transcripts were nPTB+10 and PTB+11 in HCT-8 and Colo205 cells, whereas relatively high levels of the nPTB−10 and PTB−11 transcripts were noted in HCT-116 cells. Protein levels of nPTB and PTB were relevant to its splicing profile in the CRC cell lines (Fig. 1B and 3B). The expression profile of the nPTB gene may be correlated with the RBM4 abundance in the CRC cell lines. To verify this inference, the splicing pattern of nPTB was validated in the presence of FLAG-tagged RBM4 and the derived mutants. RT-PCR results and the densitometric analysis showed that the overexpression of WT RBM4 and nonphosphorylatable S309A protein (SA), but not phosphormimetic S309D (SD) and the RRM mutant containing four mutations, enhanced skipping of nPTB exon 10 in HCT-8 cells (Fig. 3C, upper and lower). Influences of overexpressing RBM4 proteins on the splicing pattern of nPTB pre-mRNA and the protein level were dependent on its biological activity instead of expression level (Fig. 3C, middle). The cytoplasm-enriched SD mutant was incompetent at mRNA processing, whereas the nuclear-localized SA mutant functioned normally as ordinary RBM4 [14, 17].
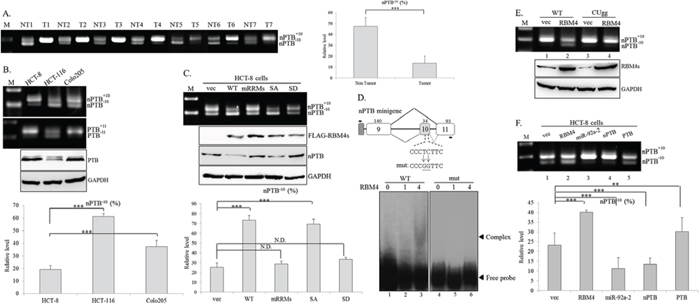
Figure 3: RNA-binding motif 4 [RBM4] enhances the skipping of neuronal polypyrimidine tract-binding protein [nPTB] exon 10 in colorectal cancer [CRC] cells. Total RNAs extracted from A. paired CRC tissues and B. CRC cell lines were analyzed by an RT-PCR with a specific primer set against the nPTB and PTB genes. Western blotting was performed with the indicated antibodies. C. Total RNAs were extracted from HCT-8 cells transfected with FLAG-tagged RBM4 and derived mutants. The splicing profile of nPTB and its protein expression were analyzed as previously described. The bar graph presents the relative level of nPTB−10 transcripts using TotalLab Quant Software [*p < 0.05; **p < 0.01; ***p < 0.005]. D. The diagram presents the sequence of the CU-element within nPTB exon 10. The mutant reporter contained pyrimidine-to-guanine nucleotide substitutions in the CU element. The mock eluate or recombinant His-tagged RBM4 protein was incubated with DIG-labeled probes. Mixtures were fractionated in 8% native acrylamide gels and transferred to Nylon membranes, followed by probing with an HRP-conjugated anti-DIG Fab fragment. E. The WT nPTB minigene or CUgg mutant was cotransfected with the empty vector or FLAG-RBM4 expression vector into HCT-8 cells. The PCR product of the spliced transcript was analyzed using electrophoresis on 2% agarose gels. F. The nPTB minigene was cotransfected with various expressing vectors into HCT-8 cells. The spliced transcript of the nPTB minigene was analyzed as described in the previous panel. The bar graph shows the relative level of nPTB−10 in three independent experiments using TotalLab Quant Software [*p < 0.05; **p < 0.01; ***p < 0.005].
Our previous studies documented that the effect of RBM4 on the regulated exon changed with localization of the RBM4-responsive element [14, 17, 27, 28]. RBM4 enhanced the inclusion of alternatively spliced exons by directly binding to intronic elements close to it [34], but the simultaneous binding of RBM4 to the cassette exon and its flanking intron via the CU-element resulted in its skipping [14, 17, 27]. To demonstrate this speculation, the nPTB minigene and a derived mutant containing the cytosine and thymidine-to-guanine nucleotide substitutions in exon 10 were constructed (Fig. 3D). The binding between recombinant RBM4 and the exonic CU-element originating from nPTB exon 10 and intron 10 (120 nt) was examined using REMSA. The WT probe and RBM4 protein formed ribonucleoprotein complexes in a dose-dependent manner (Fig. 3D, lanes 2 and 3), whereas the guanine nucleotide substitutions within the CU-rich element reduced complex formation (Fig. 3D, mut). Overexpression of RBM4 induced the skipping of nPTB exon 10 within the WT minigene (Fig. 3E, lane 2), but had almost no effect on the mutant nPTB exon 10 (Fig. 3E, lane 4). These results indicated that a direct binding between RBM4 and the exonic CU-element reduced the utilization of nPTB exon 10. Overexpression of PTB protein exerted similar activity to RBM4 of repressing nPTB+10 transcripts which originated from the nPTB minigene (Fig. 3F, lanes 2 and 5) as previously reported [22], and overexpressing miR-92a-2 inversely enhanced the production of nPTB+10 transcripts (lane 3). Overexpressing nPTB constitute a feed-forward circuit which enhanced its exon 10-included transcripts in the CRC cells (lane 4).
RBM4 exerts an opposite effect to nPTB on splicing profiles of CRC-related genes
nPTB was demonstrated as a CRC-related oncogene in recent reports [35], but its effect on the CRC-associated splicing network is largely unknown. Around 74% similarity between the RRMs sequence of nPTB and PTB implies that nPTB possibly exerts a similar specificity to PTB-regulated splicing events, such as FGFR2 and PKM in CRC cells [36–38]. The RT-PCR assay showed relatively high levels of FGFR2 IIIc and PKM2 in cancerous tissues of CRC patients compared to adjacent normal tissues (Fig. 4A). The relatively high levels of FGFR2 IIIc and PKM2 transcripts were noted in HCT-8 and Colo205 cells, but not in HCT-116 cells (Fig. 4B), which may be correlated to the expression profiles of RBM4 and nPTB proteins (Fig. 1B). Fig. 4C shows that RBM4 overexpression and nPTB knockdown distinctly reprogrammed the CRC-related splicing profiles including FGFR2, PKM, PTB, and nPTB transcripts in HCT-8 cells (left panel). In contrast, overexpression of nPTB, miR-92a-2, PTB or RBM4 knockdown induced the production of FGFR2 IIIc, PKM2, nPTB+10, and PTB+11 transcripts which were ordinarily recessive in HCT-116 cells (right panel; Supplementary Fig. 1). Results of Fig. 3 and 4 suggested that the complex interplay among RBM4, PTB, and nPTB reprogrammed the CRC-associated AS cascade.
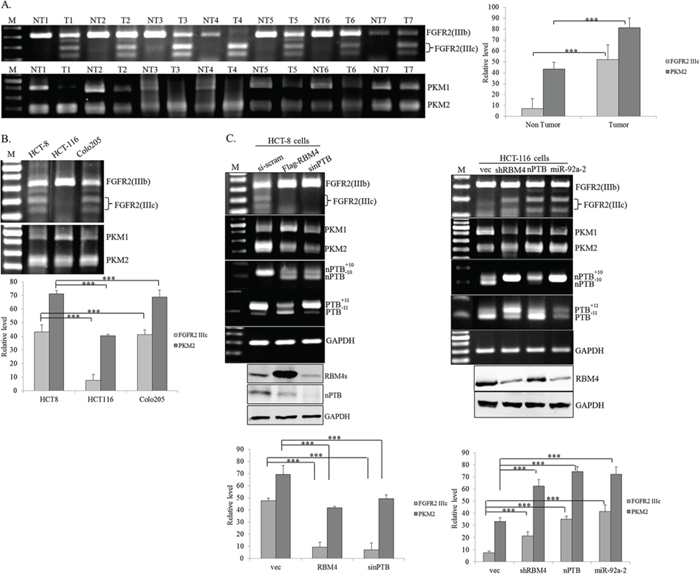
Figure 4: RNA-binding motif 4 [RBM4] and neuronal polypyrimidine tract-binding protein [nPTB] exerted opposite effects on the splicing patterns of the FGFR2 and PKM genes. Total RNA extracted from A. paired colorectal cancer [CRC] tissues and B. CRC cell lines were analyzed using an RT-PCR with specific primer sets. C. HCT-8 and HCT-116 cells were transfected with overexpressing or targeting vectors or synthesized siRNA, followed by total RNA extraction. Splicing profiles of FGFR2 and PKM pre-mRNAs were analyzed as described in Materials and methods section. The bar graph shows relative levels of FGFR2 IIIc and PKM2 in three independent experiments using TotalLab Quant Software [*p < 0.05; **p < 0.01; ***p < 0.005].
Isoform switching of FGFR2 alters activities of downstream signaling proteins
Dysregulated signaling pathways, including active extracellular signal-regulated kinase (ERK) and AKT (or protein kinase B) greatly enhanced progression of CRC cells [39–42]. Upregulation of FGFR2 was reported to participate in activation of these two molecules in invasive cancer cells [43]. We wondered whether the RBM4-regulated splicing cascade changed the activities of these signaling pathways. Expression profiles of ERK and AKT were examined using specific antibodies which recognized the total or phosphorylated ERK and AKT proteins. In HCT-8 cells, RBM4 overexpression exerted a similar effect to that of nPTB knockdown on reducing phosphorylation of ERK/AKT without altering total levels of these two proteins (Fig. 5A, left). Quantitative results showed that the phosphorylated ERK/AKT in RBM4-overexpressing or nPTB-KD HCT-8 cells was downregulated to 50%~60% of empty vector-transfected cells (Fig. 5A, right). Conversely, overexpression of nPTB or miR-92a-2 or RBM4 knockdown induced phosphorylation of ERK/AKT in HCT-116 cells (Fig. 5B, left). Quantitative results of immunoblot images indicated that phosphorylated ERK/AKT was induced to about 2~3-fold of empty vector-transfected cells (Fig. 5B, right). These results suggested that RBM4 and nPTB exerted antagonistic effects on programming the splicing profile of FGFR2 and subsequently changed the activity of its downstream signaling pathway.
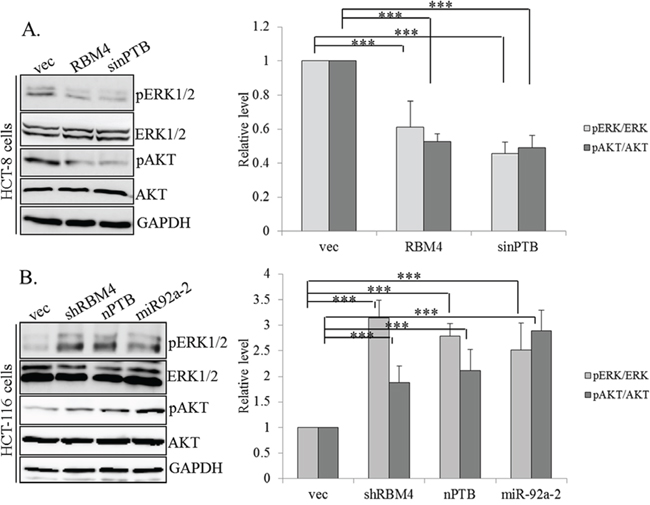
Figure 5: RNA-binding motif 4 [RBM4]-regulated splicing cascade modulates the activity of AKT/ERK signaling. A. HCT-8 cells were transfected with an RBM4-expressing vector or siRNA against neuronal polypyrimidine tract-binding protein [nPTB]. B. HCT-116 cells were transfected with an nPTB- or miR92a-2-expressing vector or targeting vector of RBM4. The protein extract was extracted followed by an immunoblot analysis with the indicated antibodies. The bar graph presents the relative levels of phosphor-AKT and ERK protein using TotalLab Quant Software in three independent experiments.
RBM4 and nPTB differentially regulate invasive and migratory activities of CRC cells
AKT/ERK signaling was reported to constitute a molecular mechanism in controlling the progression of CRC cells [39–42]. The motility of CRC cells may be correlated with the expression profiles of RBM4 and nPTB due to their influence on the phosphorylation of AKT/ERK proteins. To investigate this hypothesis, a migration/invasion assay was performed with distinct CRC cells transfected with distinct expressing or targeting vectors. Compared to empty vector-transfected HCT-8 cells, the staining images of transwell assay showed that the migratory activity of HCT-8 cells was reduced in the presence of overexpressing RBM4 or with ablation of endogenous nPTB (Fig. 6A, upper). The number of RBM4-overexpressing or nPTB-knockdown HCT-8 cells which migrated through the membrane was respectively reduced to ~50% or 30% of empty vector-transfected cells (Fig. 6A, lower). On the contrary, overexpression of nPTB or miR-92a-2 enhanced the migratory activity of HCT-116 cells compared to empty vector-transfected cells (Fig. 6A, upper). The number of migrating HCT-116 cells was elevated to ~5.7- or 3.6-fold of empty vector-transfected cells (Fig. 6A, lower). Similarly, staining images of the transwell assay showed that RBM4 overexpression or nPTB knockdown reduced the penetrating ability of HCT-8 cells through Matrigel and the membrane (Fig. 6B, upper). The number of RBM4-overexpressing or nPTB-KD HCT-8 cells invading through Matrigel was respectively reduced to ~55% or 29% of empty vector-transfected cells (Fig. 6B, lower). nPTB or miR-92a-2 overexpression consistently increased the invasive activity of HCT-116 cells to penetrate through the gel and membrane (Fig. 6B, upper); the number of invading HCT-116 cells respectively increased by ~4.1- or 4.8-fold with nPTB or miR-92a-2 overexpression compared to empty vector-transfected cells (Fig. 6B, lower). These results showed that the RBM4-regulated splicing cascade constituted a molecular mechanism which partially controlled the progression of CRC cells.
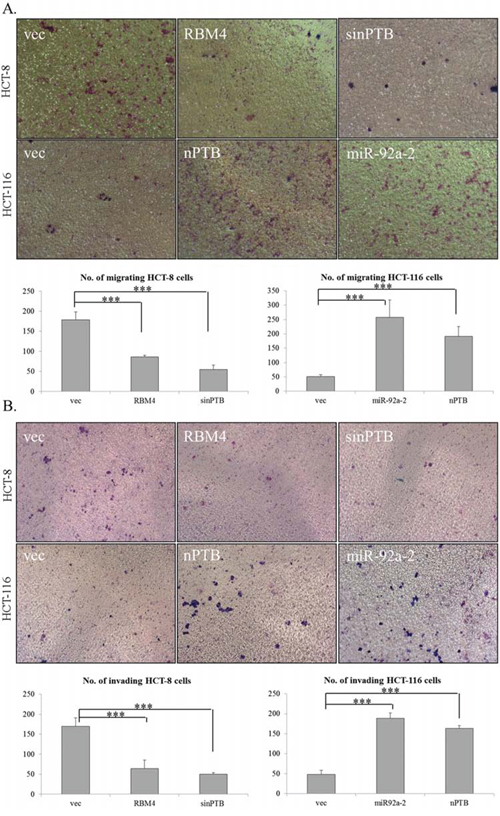
Figure 6: Expression profiles of RNA-binding motif 4 [RBM4] and neuronal polypyrimidine tract-binding protein [nPTB] influence the progression of colorectal cancer [CRC] cells. A. The motility of HCT-8 and HCT-116 cells transfected with distinct expressing vectors or synthesized siRNA was analyzed using a transwell system, followed by Giemsa staining. B. HCT-8 and HCT-116 cells were transfected with a parallel set of expressing vectors or siRNA and seeded onto Matrigel at 24 h post-transfection. Penetrating cells were fixed and stained with Giemsa solution. Images were taken of penetrated cells on the filters. The counting results of three independent experiments are presented in a bar chart as the mean ± STD.
RBM4 and nPTB exert opposite effects on the Warburg effect of CRC cells
Compared to normal cells, cancerous cells exhibit active aerobic glycolysis, known as the Warburg effect [44, 45]. PKM2 was considered a key factor of this phenomenon which was closely correlated with the growth and progression of CRC cells [46, 47]. We next wondered whether the RBM4-regulated splicing cascade reduced the Warburg effect of CRC cells. As shown in Fig. 7A, overexpression of RBM4 or nPTB had a profound but opposite effect on the mitochondrial activity of HCT-8 cells by treating cells with complex-specific substrates. The analytic results showed that the basal oxygen consumption rate (OCR) was slightly elevated in RBM4-overexpressing or nPTB-knockdown HCT-8 cells compared to empty vector-transfected cells. On the contrary, the basal OCR of RBM4-knockdown or nPTB-overexpressing cells was slightly reduced (Fig. 7A, Basal). The maximal and spare capacities of the OCR were substantially upregulated in RBM4-overexpressing or nPTB-KD HCT-8 cells. Surprisingly, almost no spare respiratory capacity was left in RBM4-knockdown or nPTB-overexpressing HCT-8 cells (Fig. 7A, Maximal and Spare OCR). Results of parallel experiments were reproduced using HCT-116 cells. Elevated basal, maximal, and spare respiratory capacities were observed in RBM4-overexpressing or nPTB-knockdown HCT-116 cells, whereas RBM4-knockdown or nPTB-overexpressing cells exhibited reduced mitochondrial activity (Fig. 7B). The mitochondrial function was similar in distinct CRC cell lines. Taking the results together, RBM4 functioned as a tumor suppressor in reducing the progression and Warburg effect of CRC cells by reprogramming the CRC-associated splicing cascade.
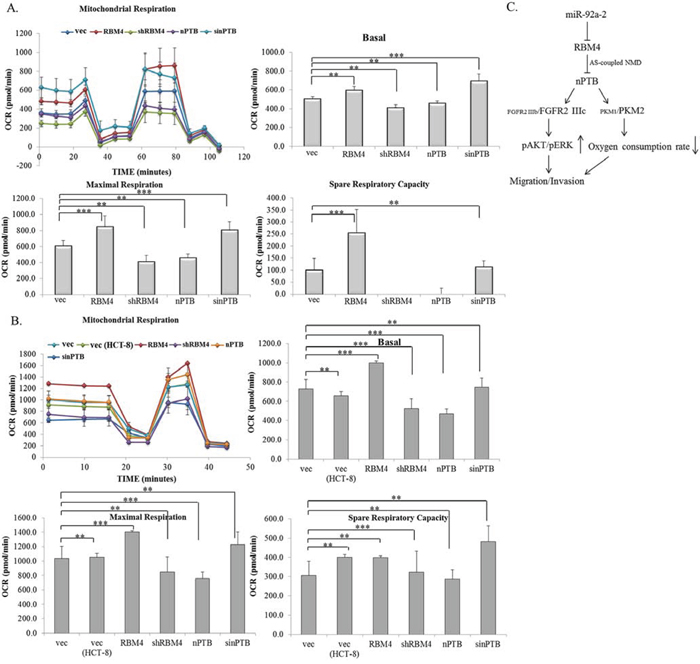
Figure 7: Expression profiles of RNA-binding motif 4 [RBM4] and neuronal polypyrimidine tract-binding protein [nPTB] modulate the mitochondrial activity of colorectal cancer [CRC] cells. A. HCT-8 and B. HCT-116 cells were transfected with a parallel set of expressing or targeting vectors for 24 h. The basal and maximal oxygen consumption rates and spare respiratory capacity were measured using an XF20 Bioanalyzer [n = 4]. C. The RBM4-regulated splicing cascade was closely correlated with the cancerous signatures of CRC cells. Elevated miR92a-2 reduced the RBM4 level, which relieved its repressive effect on nPTB expression. The imbalanced expression of nPTB respectively enhanced relative levels of the FGFR2 IIIc and PKM2 transcripts which modulated the progression and energy expenditure of CRC cells.
DISCUSSION
The expression levels of splicing factors directly control their biological activity on AS control [48]. The protein level and cellular localization of RBM4 was changed by multilayer mechanisms, including autoregulated AS, AS -coupled transcription control, and SRPK1-driven phosphorylation [17, 27, 28]. In this study, elevated miR-92a-3p constituted another mechanism for reducing RBM4 expression in CRC cells (Fig. 3C-F). These results indicated that RBM4 expression is meticulously controlled through complex mechanisms, since the influence of RBM4 could be expanded by initiating splicing cascades. RBM4 was previously demonstrated to reduce the protein levels of PTB and nPTB which constituted a cross-regulatory mechanism for the neuron development [20, 33]. Overexpressing PTB induced relative levels of the PTB−exon 11 and nPTB−exon 10 transcripts [33], but the nPTB-induced autoregulatory mechanism was first reported to enhance the expression of nPTB+exon 10 transcripts (Fig. 3F). The feed-forward circuit could partially relieve the suppressive effect of elevated PTB protein on the expression of nPTB in CRC cells. Although mutual expressions of PTB and nPTB were observed during the development of neurons and skeletal muscles [33, 49], RBM4 was reported to repress expressions of PTB/nPTB via an AS-coupled NMD pathway in differentiating myocytes [14]. The regulatory effects of nPTB and PTB on the splicing profile were additive due to their cross-regulation, but RBM4 functioned as a dominant repressor in reducing the effects of nPTB/PBT proteins on AS events.
Imbalanced expression or localization of splicing factors leads to dysregulated splicing events, which are considered an occasion of cancerous progression [50, 51]. HnRNP A2/B1, PTB, and SRSF1 were reported to act oncogenes due to their influence of inducing cancer-associated transcripts [16, 52, 53]. In CRC cells, direct binding between elevated metastasis associated with lung adenocarcinoma transcript-1 (MALAT1) and the PTB-associated splicing factor (PSF) induced the dissociation of the nPTB/PSF complex, which promoted the progression of CRC cells. [35]. However, the molecular mechanism for the expression of nPTB protein in CRC cells was unknown. In this study, the miR-92a-caused reduction of RBM4 constituted a molecular mechanism that enhanced the expression of nPTB (Fig. 4C, lower). The regulatory effect of RBM4 on modulating nPTB/PTB expressions through an AS-coupled NMD pathway was previously reported in differentiating myocytes [14]. These results suggested that RBM4 functioned as a dominant repressor which reduced nPTB expression in a spatial-temporal manner, although more investigation is still required to verify this inference.
The FGFR2 and PKM isoforms were expressed spatiotemporally through AS mechanisms [54, 55]. The FGFR2 IIIb and PKM1 isoforms are exclusively expressed in differentiated cells, whereas FGFR2 IIIc and PKM2 are abundant in embryonic and cancerous cells [56, 57]. Increases in FGF2 and its receptor were widely observed in CRC tissues [58]. The relatively high expression FGFR2 IIIc led to the migration and invasion of cancerous cells [59]. In addition, HCT-8 cells exhibited an active EGF-EGFR response mediating the proliferation and progression of CRC, whereas HCT-116 was less responsive to EGF treatment [60]. Despite HCT-8 and HCT-116 being considered less-aggressive CRC cells and the invasive activity between these cells not having been experimentally evaluated, the relatively high level of FGFR2 IIIc transcripts suggested the active progression of HCT-8 compared to HCT-116 cells. Overexpressing RBM4 repressed the progression of various cancer cell lines [15], and our results showed that RBM4-modulated splicing cascade constituted a molecular mechanism regarding this phenomenon. In addition, the FGFR2 gene was predicted as the specific candidate of RBM4 in a previous study [56]. Further investigation is required to verify this hypothesis in the future.
Dysregulated AS was considered a molecular hallmark of malignancy [61, 62]. Imbalanced expressions of FGFR2 IIIc and PKM2 isoforms contributed to the progression and metabolism of cancer cells [63, 64]. The mechanistic investigation of cancer-associated splicing events could bring new insights into the occurrence of distinct malignancies. In this report, we present a model of how RBM4 expression was reduced and its influence on the splicing cascade that participated in the cancerous signatures. Further investigation of the splicing factor and corresponding splicing events may provide a route for developing a useful biomarker and clinical therapy for various malignancies.
MATERIALS AND METHODS
Patient samples and cell culture
Human colorectal tumor samples (n = 20) were requested as anonymous specimens from the TMU Joint Biobank (approval no. 201409044). All of the recommendations of the Declaration of Helsinki for biomedical research involving human subjects were followed. The HCT-8, Colo205, and HCT-116 human colorectal adenocarcinoma and carcinoma cell lines were kind gifts from Dr. Yu-Chih, Liang (Taipei Medical University, Taipei, Taiwan). HCT-8, Colo205, and HCT-116 cells were cultured in RPMI-1640 medium supplemented with 10% fetal bovine serum, 600 mg/ml glutamine, 100 U/ml penicillin, and 100 mg/ml streptomycin (Invitrogen, Camarillo, CA, USA).
Bioinformatic prediction of miRNA responsive element within hRBM4 gene
To identify the putative miRNA target site within human RBM4 gene, we used the publicly available algorithm, RNA22 V2.0 (https://cm.jefferson.edu/rna22/, 30) for the miRNA-hRBM4 pair prediction. The upregulating profiles of CRC-related miRNAs were previously identified [29] and the convincing candidates (fold change > 2, and q value <0.05; Supplementary Table 2) were included for the following prediction. The sequence of mature miRNAs was individually aligned with the sequence of RBM4 3′UTR or coding region in the RNA22 V2.0 algorithm. The parameter setting for RNA22 is: only 1 “UN-paired” base is allowed within the seed size of 7, minimum number of paired-up bases within predicted heteroduplex is 12, maximum value for the folding energy in any reported heteroduplex = −14 kcal/mol, and 2 wobble paired bases are allowed in seed region. The folding energy of putative miRNA-hRBM4 pair was further predicted using RNAhybrid algorithm (http://bibiserv.techfak.uni-bielefeld.de/rnahybrid). A lower p value generated by these programs represented a higher possibility that the aligned target sequence contained a valid miRNA responsive element. The miRNA target pairs with low folding energy (<-14 kcal/mol) and convincing p value (<0.005) were subjected to the further investigation.
Plasmid construction and transfection
The pRL-hRBM4 open reading frame (ORF) reporter was constructed by inserting the human RBM4 ORF fragment (301~652 nt) into the pRL-SV40 vector (Promega, Madison, WI, USA). The human RBM4 ORF was polymerase chain reaction (PCR)-amplified using a complementary (c)DNA library prepared from fetal brain tissue as the template and then inserted into Xba I/Not I sites of the pRL-SV40 vector. To express human miR-92a-2 RNA, the PCR product coding for its primary sequence was cloned into the pSilencer 1.0-U6 vector (Invitrogen). The nPTB minigene reporter was constructed by inserting the complete human nPTB genomic fragment containing exons 9, 10, and 11 and intra-exon introns. The genomic fragments were amplified by a PCR using genomic DNA prepared from MRC5 fibroblasts as the template and then inserted into KpnI/EcoRV sites to replace the β-galactosidase gene of pCH110 (Amersham Pharmacia, Uppsala, Sweden). Mutant pRL-hRBM4 ORF, pCH-nPTB, and pSilencer-miR-92a-2 vectors containing changed nucleotides were constructed using the QuikChange site-directed mutagenesis system (Stratagene, Amsterdam, Netherlands). Sequences of the PCR primer sets are listed in Supplementary Table 3. All constructs were auto-sequenced. Cultured cells were grown to 60% confluence, and the indicated plasmid was transfected using PolyJet (SignaGen Laboratories, Ijamsville, MD, USA). After 24 h, total RNA and proteins were separately extracted using the Trizol reagent (Invitrogen). For the reverse-transcription (RT)-PCR assay, 2 μg of RNA was reverse-transcribed using SuperScriptase III (Invitrogen) in a 10-μl reaction. The PCR analysis of individual genes was performed using gene-specific primer sets (Supplementary Table 2). The PCR-amplified amplicons of PKM and FGFR2 were then digested with PstI and EcoRV to discriminate the products containing PKM2 exon 10 and FGFR2IIIc exons. Densities of the PCR products were determined using TotalLab Quant Software. A quantitative (q)RT-PCR was performed with SYBR green fluorescent dye and gene-specific primer sets using an ABI One Step™ PCR machine (Applied Biosystems, Foster City, CA, USA). The relative messenger (m)RNA level was quantitated by the ßß-Ct method, and the level of GAPDH mRNA served as the internal control.
Immunoblot assay
The immunoblot analysis was conducted using an enhanced chemiluminescence (ECL) system (Millipore, Billerica, MA, USA), and images were analyzed with the LAS-4000 imaging system (Fujifilm, Tokyo, Japan). Primary antibodies used in this study included polyclonal anti-RBM4 (Santa Cruz Biotechnology, Santa Cruz, CA, USA), monoclonal anti-nPTB (Abnova, Taipei, Taiwan), polyclonal anti-GAPDH (MDBio, Taipei, Taiwan), monoclonal anti-FLAG M2 (Sigma-Aldrich, St. Louis, MO, USA), polyclonal anti-ERK1/2, polyclonal anti-AKT, monoclonal anti-phospho-ERK1/2 and monoclonal anti-phospho-AKT (Cell Signaling Technology, Danvers, MA, USA).
RNA electrophoretic mobility shift assay (REMSA)
Recombinant His-tagged proteins were prepared as described previously.17 RNA probes used were nPTB exon 10 (CU, 34 nt) and the downstream intron (86 nt). Exonic and intronic elements were in vitro-transcribed and used as probes. For RNA-protein interactions, 1 or 4 μg of recombinant protein was incubated with 10 nM of DIG-labeled probe in a 20-μl reaction containing 10 mM HEPES (pH 7.9), 50 μM EDTA, 10% glycerol, 1 mM dithiothreitol, 5 mM MgCl2, 0.5 μg/ml bovine serum albumin, and 12.5 ng/ml tRNA for 15 min at room temperature. Reactions were analyzed by electrophoresis on an 8% nondenaturing polyacrylamide gel in TBE buffer (45 mM Tris-HCl, 45 mM boric acid, and 1 mM EDTA; pH 8.0). Binding complexes were transferred to nylon membranes (Hybond N, Amersham Bioscience, Piscataway, NJ, USA) that were irradiated under 254-nm light for 60 s. Immunoblotting was conducted by incubating membranes with horseradish peroxidase (HRP)-conjugated anti-DIG Fab fragments (Roche, Mannheim, Germany).
Poly(A) tailing of small RNA
Small RNAs were poly(A)-tailed by A-Plus Poly(A) polymerase (Cellscript, Madison, WI, USA) as per the user’s instruction manual. In brief, 50 μg of total RNA was preheated to 65°C for 10 min. The RNAs were then incubated with 8 U A-Plus Poly(A) polymerase in a 100-μl mixture at 37°C for 60 min. The reaction was immediately stopped by storing the mixture in a −70°C freezer. Tailed-RNAs were extracted using a PCA/ethanol method. The RNA pellet was dissolved in nuclease-free water and subjected to an RT-PCR assay using specific primer sets (Supplementary Table 3).
In vivo translation assay
HCT-8 cells were seeded in six-well plates (2 × 10⁵ cells/well) 24 h prior to transfection. The transfection reaction mixture contained 0.5 μg of the pRL-SV40 and the engineered Renilla luciferase reporters which contained a wild-type (WT) or mutant hRBM4 ORF fragment, 1 μg of the effector expression vector, and 0.5 μg of the pFir-Luc vector (Promega) as the control. After 24 h, transfectants were lysed using passive lysis buffer, and cell debris was removed after centrifugation. Activities of the firefly and Renilla luciferases were measured using a dual-luciferase assay kit (Promega) and the Synergy HT multi-mode microplate reader (BioTek, Winooski, VT, USA).
In vitro translation assay
pRL-hRBM4 and pGL3-Basic vectors were linearized and used as templates for in vitro transcription; these transcripts were diguanosine-capped and had a short poly(A) tail. The transcribed RNA was precipitated using LiCl (7M) and quantified by Nanodrop spectrophotometry. The cytoplasmic fraction (S100) was extracted from miR-92a-2-3p- or miR-92a-2m3p-overexpressing HCT-116 cells as previously described (26). The abundance of total miR-92a was estimated using a qRT-PCR. The in vitro translation reaction (25 μl) contained 5 ng of in vitro-transcribed RNA, 150 pM of miR-92a, 25 μM amino acids, and 12.5 μl reticulocyte lysate (Promega). The mixture was incubated at 30°C for 2 h, followed by subjecting 10% of the mixture to the luciferase assay as described above. Each reaction was independently performed at least three times.
Mitochondrial respiration assay
A Seahorse XF24 extracellular flux analyzer (Seahorse Bioscience, North Billerica, MA, USA) was used to measure the oxygen consumption rate (OCR; as an indicator of mitochondrial respiration). In brief, 5 × 10⁴ HCT-8 cells were seeded in each well of Seahorse XF24 plates with 250 μl of Dulbecco’s modified Eagle medium (DMEM) and incubated overnight. Prior to the measurement, cells were washed with unbuffered medium and immersed in 675 μl of unbuffered medium without CO2 for 1 h. The OCR was assessed in 8-min cycles as recommended by Seahorse Bioscience. The basal and maximal OCRs, and spare respiratory capacity were recorded following injection of complex-specific substrates, including FCCP (0.5 μM), rotenone (2 μM), and oligomycin (2.5 μg/ml).
In vitro migration and invasion assay
HCT-8 and HCT-116 cells (5 × 10⁴ cells/well) transfected with distinct effector expression vectors were seeded in the top chamber containing a polycarbonate membrane (8-μM pore, Corning, Cambridge, MA, USA). The lower chamber contained complete culture medium which served as a chemoattractant. After 24 h, the inner membrane was scraped with a swab, and cells which had migrated to the lower side of the membrane were fixed with 4% paraformaldehyde and stained with Giemsa solution for counting. For the in vitro invasion assay, transwell chambers were coated with Matrigel prior to cell seeding. After 24 h, the inner membrane was scraped with a swab, and cells which had invaded were fixed with 4% paraformaldehyde and stained with Giemsa solution for counting. Numbers of migrating and invading cells were counted in four high-power fields (HPFs).
ACKNOWLEDGMENTS
This work was supported by a grant (MOST103-2320-B-038-047-MY2) from the Ministry of Science and Technology of Taiwan and one (103-TMU-WFH-003) from Taipei Medical University and Wan-Fang Hospital.
CONFLICTS OF INTEREST
All authors declare no conflicts of interest exists.
REFERENCES
1. Nilsen TW, Graveley BR. Expansion of the eukaryotic proteome by alternative splicing. Nature. 2010; 463:457–463.
2. Pan Q, Shai O, Lee LJ, Frey BJ, Blencowe BJ. Deep surveying of alternative splicing complexity in the human transcriptome by high-throughput sequencing. Nat Genet. 2008; 40:1413–1415.
3. Wang ET, Sandberg R, Luo S, Khrebtukova I, Zhang L, Mayr C, Kingsmore SF, Schroth GP, Burge CB. Alternative isoform regulation in human tissue transcriptomes. Nature. 2008; 456:470–476.
4. Matera AG, Wang Z. A day in the life of the spliceosome. Nat Rev Mol Cell Biol. 2014; 15:108–121.
5. Cohen-Eliav M, Golan-Gerstl R, Siegfried Z, Andersen CL, Thorsen K, Ørntoft TF, Mu D, Karni R. The splicing factor SRSF6 is amplified and is an oncoprotein in lung and colon cancers. J Pathol. 2014; 229:630–639.
6. Iborra S, Hirschfeld M, Jaeger M, Zur Hausen A, Braicu I, Sehouli J, Gitsch G, Stickeler E. Alterations in expression pattern of splicing factors in epithelial ovarian cancer and its clinical impact. Int J Gynecol Cancer. 2013; 23:990–996.
7. Mavrou A, Brakspear K, Hamdollah-Zadeh M, Damodaran G, Babaei-Jadidi R, Oxley J, Gillatt DA, Ladomery MR, Harper SJ, Bates DO, Oltean S. Serine-arginine protein kinase 1 (SRPK1) inhibition as a potential novel targeted therapeutic strategy in prostate cancer. Oncogene. 2014; doi: 10.1038/onc.2014.360.
8. Hamdollah Zadeh MA, Amin EM, Hoareau-Aveilla C, Domingo E, Symonds KE, Ye X, Heesom KJ, Salmon A, D’Silva O, Betteridge KB, Williams AC, Kerr DJ, Salmon AH, et al. Alternative splicing of TIA-1 in human colon cancer regulates VEGF isoform expression, angiogenesis, tumour growth and bevacizumab resistance. Mol Oncol. 2015; 9:167–178.
9. Zhou X, Li X, Cheng Y, Wu W, Xie Z, Xi Q, Han J, Wu G, Fang J, Feng Y. BCLAF1 and its splicing regulator SRSF10 regulate the tumorigenic potential of colon cancer cells. Nat Commun. 2014; 5:4581.
10. Wang C, Norton JT, Ghosh S, Kim J, Fushimi K, Wu JY, Stack MS, Huang S. Polypyrimidine tract-binding protein (PTB) differentially affects malignancy in a cell line-dependent manner. J Biol Chem. 2008; 283:20277–20287.
11. Marcel V, Fernandes K, Terrier O, Lane DP, Bourdon JC. Modulation of p53β and p53γ expression by regulating the alternative splicing of TP53 gene modifies cellular response. Cell Death Differ. 2014; 21:1377–1387.
12. Liu Y, Conaway L, Rutherford Bethard J, Al-Ayoubi AM, Thompson Bradley A, Zheng H, Weed SA, Eblen ST. Phosphorylation of the alternative mRNA splicing factor 45 by Clk1 regulates its splice site utilization, cell migration and invasion. Nucleic Acids Res. 2013; 41:4949–4962.
13. Braeutigam C, Rago L, Rolke A, Waldmeier L, Christofori G, Winter J. The RNA-binding protein Rbfox2: an essential regulator of EMT-driven alternative splicing and a mediator of cellular invasion. Oncogene. 2014; 33:1082–1092.
14. Lin JC, Tarn WY. RBM4 down-regulates PTB and antagonizes its activity in muscle cell-specific alternative splicing. J Cell Biol. 2011; 193:509–520.
15. Wang Y, Chen D, Qian H, Tsai YS, Shao S, Liu Q, Dominguez D, Wang Z. The splicing factor RBM4 controls apoptosis, proliferation, and migration to suppress tumor progression. Cancer Cell. 2014; 26:374–389.
16. David CJ, Chen M, Assanah M, Canoll P, Manley JL. HnRNP proteins controlled by c-Myc deregulate pyruvate kinase mRNA splicing in cancer. Nature. 2010; 463:364–368.
17. Lin JC, Lin CY, Tarn WY, Li FY. Elevated SRPK1 lessens apoptosis in breast cancer cells through RBM4-regulated splicing events. RNA. 2014; 20:1621–1631.
18. Oberstrass FC, Auweter SD, Erat M, Hargous Y, Henning A, Wenter P, Reymond L, Amir-Ahmady B, Pitsch S, Black DL, Allain FH. Structure of PTB bound to RNA: specific binding and implications for splicing regulation. Science. 2005; 309:2054–2057.
19. Patton JG, Mayer SA, Tempst P, Nadal-Ginard B. Characterization and molecular cloning of polypyrimidine tract-binding protein: a component of a complex necessary for pre-mRNA splicing. Genes Dev. 1991; 5:1237–1251.
20. Lillevali K, Kulla A, Ord T. Comparative expression analysis of the genes encoding polypyrimidine tract binding protein (PTB) and its neural homologue (brPTB) in prenatal and postnatal mouse brain. Mech Dev. 2001; 101:217–220.
21. Xue Y, Zhou Y, Wu T, Zhu T, Ji X, Kwon YS, Zhang C, Yeo G, Black DL, Sun H, Fu XD, Zhang Y. Genome-wide analysis of PTB-RNA interactions reveals a strategy used by the general splicing repressor to modulate exon inclusion or skipping. Mol Cell. 2009; 36:996–1006.
22. Makeyev EV, Zhang J, Carrasco MA, Maniatis T. The MicroRNA miR-124 promotes neuronal differentiation by triggering brain-specific alternative pre-mRNA splicing. Mol Cell. 2007; 27:435–448.
23. He X, Pool M, Darcy KM, Lim SB, Auersperg N, Coon JS, Beck WT. Knockdown of polypyrimidine tract-binding protein suppresses ovarian tumor cell growth and invasiveness in vitro. Oncogene. 2007; 26:4961–4968.
24. He X, Arslan AD, Ho TT, Yuan C, Stampfer MR, Beck WT. Involvement of polypyrimidine tract-binding protein (PTB) in maintaining breast cancer cell growth and malignant properties. Oncogenesis. 2014; 3:e84.
25. Cheung T, Hai T, Zhu W, Baggerly KA, Tsavachidis S, Krahe R, Cote GJ. Splicing factors PTB and PTBP2 promote proliferation and migration of glioma cell lines. Brain. 2009; 132:2277–2288.
26. Lin JC, Tarn WY. RNA-binding motif protein 4 translocates to cytoplasmic granules and suppresses translation via argonaute2 during muscle cell differentiation. J Biol Chem. 2009; 284:34658–34665.
27. Lin JC, Tarn WY, Hsieh WK. Emerging role for RNA binding motif protein 4 in the development of brown adipocytes. Biochim Biophys Acta. 2014; 1843:769–779.
28. Lin JC. RBM4-MEF2C network constitutes a feed-forward circuit that facilitates the differentiation of brown adipocytes. RNA Biol. 2015; 15:208–220.
29. Nishida N, Nagahara M, Sato T, Mimori K, Sudo T, Tanaka F, Shibata K, Ishii H, Sugihara K, Doki Y, Mori M. Microarray analysis of colorectal cancer stromal tissue reveals upregulation of two oncogenic miRNA clusters. Clin Cancer Res. 2012; 18:3054–3070.
30. Miranda KC, Huynh T, Tay Y, Ang YS, Tam WL, Thomson AM, Lim B, Rigoutsos I. A pattern-based method for the identification of MicroRNA binding sites and their corresponding heteroduplexes. Cell. 2006; 126:1203–1217.
31. Zhou T, Zhang G, Liu Z, Xia S, Tian H. Overexpression of miR-92a correlates with tumor metastasis and poor prognosis in patients with colorectal cancer. Int J Colorectal Dis. 2013; 28:19–24.
32. Martin HC, Wani S, Steptoe AL, Krishnan K, Nones K, Nourbakhsh E, Vlassov A, Grimmond SM, Cloonan N. Imperfect centered miRNA binding sites are common and can mediate repression of target mRNAs. Genome Biol. 2014; 14:R51.
33. Boutz PL, Stoilov P, Li Q, Lin CH, Chawla G, Ostrow K, Shiue L, Ares M Jr, Black DL. A post-transcriptional regulatory switch in polypyrimidine tract-binding proteins reprograms alternative splicing in developing neurons. Genes Dev. 2007; 21:1636–1652.
34. Lin JC, Tarn WY. Exon selection in alpha-tropomyosin mRNA is regulated by the antagonistic action of RBM4 and PTB. Mol Cell Biol. 2005; 25:10111–10121.
35. Ji Q, Zhang L, Liu X, Zhou L, Wang W, Han Z, Sui H, Tang Y, Wang Y, Liu N, Ren J, Hou F, Li Q. Long non-coding RNA MALAT1 promotes tumour growth and metastasis in colorectal cancer through binding to SFPQ and releasing oncogene PTBP2 from SFPQ/PTBP2 complex. Br J Cancer. 2014; 111:736–748.
36. Carstens RP, Wagner EJ, Garcia-Blanco MA. An intronic splicing silencer causes skipping of the IIIb exon of fibroblast growth factor receptor 2 through involvement of polypyrimidine tract binding protein. Mol Cell Biol. 2000; 20:7388–7400.
37. Clower CV, Chatterjee D, Wang Z, Cantley LC, Vander Heiden MG, Krainer AR. The alternative splicing repressors hnRNP A1/A2 and PTB influence pyruvate kinase isoform expression and cell metabolism. Proc Natl Acad Sci U S A. 2010; 107:1894–1899.
38. Chen M, David CJ, Manley JL. Concentration-dependent control of pyruvate kinase M mutually exclusive splicing by hnRNP proteins. Nat Struct Mol Biol. 2012; 19:346–354.
39. El-Baba C, Mahadevan V, Fahlbusch FB, S S M, Rau TT, Gali-Muhtasib H, Schneider-Stock R. Thymoquinone-induced conformational changes of PAK1 interrupt prosurvival MEK-ERK signaling in colorectal cancer. Mol Cancer. 2014; 13:201.
40. Bigatto V, De Bacco F, Casanova E, Reato G, Lanzetti L, Isella C, Sarotto I, Comoglio PM, Boccaccio C. TNF-α promotes invasive growth through the MET signaling pathway. Mol Oncol. 2015; 9:377–388.
41. Cui YM, Jiang D, Zhang SH, Wu P, Ye YP, Chen CM, Tang N, Liang L, Li TT, Qi L, Wang SY, Jiao HL, Lin J, et al. FOXC2 promotes colorectal cancer proliferation through inhibition of FOXO3a and activation of MAPK and AKT signaling pathways. Cancer Lett. 2014; 353:87–94.
42. Wu DM, Zhang P, Liu RY, Sang YX, Zhou C, Xu GC, Yang JL, Tong AP, Wang CT. Phosphorylation and changes in the distribution of nucleolin promote tumor metastasis via the PI3K/Akt pathway in colorectal carcinoma. FEBS Lett. 2014; 588:1921–1929.
43. Mathur A, Ware C, Davis L, Gazdar A, Pan BS, Lutterbach B. FGFR2 is amplified in the NCI-H716 colorectal cancer cell line and is required for growth and survival. PLoS One. 2014; 9:e98515.
44. Lee KM, Nam K, Oh S, Lim J, Lee T, Shin I. ECM1 promotes the Warburg effect through EGF-mediated activation of PKM2. Cell Signal. 2015; 27:228–235.
45. Nam SO, Yotsumoto F, Miyata K, Fukagawa S, Yamada H, Kuroki M, Miyamoto S. Warburg effect regulated by amphiregulin in the development of colorectal cancer. Cancer Med. 2015; doi: 10.1002/cam4.416.
46. Yang P, Li Z, Fu R, Wu H, Li Z. Pyruvate kinase M2 facilitates colon cancer cell migration via the modulation of STAT3 signalling. Cell Signal. 2014; 26:1853–1862.
47. Hamabe A, Konno M, Tanuma N, Shima H, Tsunekuni K, Kawamoto K, Nishida N, Koseki J, Mimori K, Gotoh N, Yamamoto H, Doki Y, Mori M, et al. Role of pyruvate kinase M2 in transcriptional regulation leading to epithelial-mesenchymal transition. Proc Natl Acad Sci U S A. 2014; 111:15526–15531.
48. Sun S, Zhang Z, Sinha R, Karni R, Krainer AR. SF2/ASF autoregulation involves multiple layers of post-transcriptional and translational control. Nat Struct Mol Biol. 2010; 17:306–312.
49. Spellman R, Llorian M. Crossregulation and functional redundancy between the splicing regulator PTB and its paralogs nPTB and ROD1. Mol Cell. 2007; 27:420–434.
50. Gonçalves V, Henriques A, Pereira J, Neves Costa A, Moyer MP, Moita LF, Gama-Carvalho M, Matos P Jordan P. Phosphorylation of SRSF1 by SRPK1 regulates alternative splicing of tumor-related Rac1b in colorectal cells. RNA. 2014; 20:474–482.
51. Chang SH, Elemento O, Zhang J, Zhuang ZW, Simons M, Hla T, Rajan P. ELAVL1 regulates alternative splicing of eIF4E transporter to promote postnatal angiogenesis. Proc Natl Acad Sci U S A. 2014; 111:18309–18314.
52. Stockley J, Villasevil ME, Nixon C, Ahmad I, Leung HY, Rajan P. The RNA-binding protein hnRNPA2 regulates β-catenin protein expression and is overexpressed in prostate cancer. RNA Biol. 2014; 11:755–765.
53. de Miguel FJ, Sharma RD, Pajares MJ, Montuenga LM, Rubio A, Pio R. Identification of alternative splicing events regulated by the oncogenic factor SRSF1 in lung cancer. Cancer Res. 2014; 74:1105–1115.
54. Eswarakumar VP, Monsonego-Ornan E, Pines M, Antonopoulou I, Morriss-Kay GM, Lonai P. The IIIc alternative of Fgfr2 is a positive regulator of bone formation. Development. 2002; 129:3783–3793.
55. Gao Z, Cooper TA. Reexpression of pyruvate kinase M2 in type 1 myofibers correlates with altered glucose metabolism in myotonic dystrophy. Proc Natl Acad Sci U S A. 2013; 110:13570–13575.
56. Oltean S, Sorg BS, Albrecht T, Bonano VI, Brazas RM, Dewhirst MW, Garcia-Blanco MA. Alternative inclusion of fibroblast growth factor receptor 2 exon IIIc in Dunning prostate tumors reveals unexpected epithelial mesenchymal plasticity. Proc Natl Acad Sci U S A. 2006; 103:14116–14121.
57. Desai S, Ding M, Wang B, Lu Z, Zhao Q, Shaw K, Yung WK, Weinstein JN, Tan M, Yao J. Tissue-specific isoform switch and DNA hypomethylation of the pyruvate kinase PKM gene in human cancers. Oncotarget. 2014; 5:8202–8210.
58. Hung SY, Shih YP, Chen M, Lo SH. Up-regulated cten by FGF2 contributes to FGF2-mediated cell migration. Mol Carcinog. 2014; 53:787–792.
59. Matsuda Y, Hagio M, Seya T, Ishiwata T. Fibroblast growth factor receptor 2 IIIc as a therapeutic target for colorectal cancer cells. Mol Cancer Ther. 2012; 11:2010–2020.
60. Gialeli Ch, Theocharis AD, Kletsas D, Tzanakakis GN, Karamanos NK. Expression of matrix macromolecules and functional properties of EGF-responsive colon cancer cells are inhibited by panitumumab. Invest New Drugs. 2013; 31:516–524.
61. David CJ, Manley JL. Alternative pre-mRNA splicing regulation in cancer: pathways and programs unhinged. Genes Dev. 2014; 24:2343–2364.
62. Oltean S, Bates DO. Hallmarks of alternative splicing in cancer. Oncogene. 2014; 33:5311–5318.
63. Peng WX, Kudo M, Fujii T, Teduka K, Naito Z. Altered expression of fibroblast growth factor receptor 2 isoform IIIc: relevance to endometrioid adenocarcinoma carcinogenesis and histological differentiation. Int J Clin Exp Pathol. 2014; 7:1069–1076.
64. Wu H, Li Z, Yang P, Zhang L, Fan Y, Li Z. PKM2 depletion induces the compensation of glutaminolysis through β-catenin/c-Myc pathway in tumor cells. Cell Signal. 2014; 26:2397–2405.