
Introduction
Acute myeloid leukemia (AML) is a cytogenetically and molecularly heterogeneous disease characterized by accumulation of a variety of somatically acquired genetic aberrations in myeloid precursors, resulting in their clonal proliferation and maturation arrest. These genetic alterations are found in bone marrow or blood cells of approximately 55% of previously-untreated adults with AML and have long been recognized as independent predictors for clinical outcome, allowing the classification of patients into favorable, intermediate, and unfavorable prognostic groups [1]. However, no genetic aberrations have been identified in 45% of adult AML patients yet. These cytogenetically normal (CN) patients are usually assigned to intermediate prognostic group [2]. Over the past decades, several gene mutations such as internal tandem duplication (ITD) of the FLT3 gene, mutations in the NPM1 gene, partial tandem duplication of the MLL gene, mutations in the CEBPA gene, and changes in gene expression, such as overexpression of BAALC, ERG, EVI1, MN1 and CDKN1B, have been discovered to strongly affect clinical outcome of CN-AML patients [3,4]. Twenty-four % of CN-AML patients show none of the aforementioned mutations, underlining the biological and clinical heterogeneity of this disease [5].
The development of high-throughput gene expression profiling (GEP) is of interest to improve risk classification of patients with CN-AML. Bullinger et al. [6], by combining supervised and unsupervised data analysis from 40K cDNA microarrays, reported a 133-gene signature that split CN-AML patients into 2 groups with different survival. Radmacher et al. [7] confirmed the prognostic significance of this signature on an independent CN-AML cohort, using Affymetrix U133plus2.0 microarrays. Metzeler et al. [8] identified 66 genes, whose expression was prognostic for overall survival (OS), and defined a prognostic score based on this signature. Altogether, these studies emphasized the power of GEP data to predict outcome of CN-AML patients.
Based on our previous experience in building powerful risk scores in patients with malignant plasma cell disorders [9], we looked for whether this strategy could be applied to design gene expression (GE) based-risk score in CN-AML patients using publicly-available data. We report here the design of a GE-based risk score, involving 22 genes, whose value is strongly prognostic in 2 independent cohorts of CN-AML patients.
Results
GE-based risk score in CN-AML
Using Maxstat R function and Benjamini-Hochberg multiple testing correction [10], 27 probe sets were found to be significantly associated with poor prognosis (adjusted P value <.05) (Table 1). These probe sets probed for 22 unique genes and 2 expressed sequence tag clones and were used to build the GE-based risk score. Figure 1 shows the variation of GE-based risk score along patients of the training cohort and the expression of the prognostic probe sets. With respect to AML FAB classification system, the GE-based risk score was significantly higher (P < 3.10-3) and lower (P < 1,8.10-2) in M1 and M5 subgroups, respectively (Figure 2).
Table 1: List of the 27 probe sets associated with poor prognosis in CN-AML patients. Gene symbol, adjusted P-value and hazard ratios (HR) are given for each gene. Probe sets are sorted by decreasing HR.
Name |
Gene Symbol |
Adjusted P value |
Hazard Ratio |
217975_at |
WBP5 |
0,0023 |
3,67 |
203860_at |
PCCA |
0,0057 |
3,67 |
227964_at |
FRMD8 |
0,0407 |
3,46 |
237311_at |
--- |
0,0009 |
3,37 |
203373_at |
SOCS2 |
0,0011 |
3,33 |
201540_at |
FHL1 |
0,0091 |
3,27 |
218086_at |
NPDC1 |
0,0032 |
3,25 |
219922_s_at |
LTBP3 |
0,0125 |
3,25 |
217820_s_at |
ENAH |
0,0101 |
3,22 |
215034_s_at |
TM4SF1 |
0,0029 |
3,14 |
203372_s_at |
SOCS2 |
0,0026 |
3,12 |
221973_at |
LOC100506076 /// LOC100506123 |
0,0281 |
3,07 |
222803_at |
PRTFDC1 |
0,0133 |
3,06 |
213056_at |
FRMD4B |
0,0065 |
3,00 |
212364_at |
MYO1B |
0,0426 |
2,96 |
204030_s_at |
IQCJ-SCHIP1 |
0,0298 |
2,93 |
232752_at |
LOC100287616 |
0,0130 |
2,91 |
209386_at |
TM4SF1 |
0,0286 |
2,90 |
212387_at |
TCF4 |
0,0106 |
2,88 |
243010_at |
MSI2 |
0,0123 |
2,87 |
206950_at |
SCN9A |
0,0377 |
2,87 |
208798_x_at |
GOLGA8A |
0,0495 |
2,78 |
215071_s_at |
HIST1H2AC |
0,0248 |
2,73 |
227943_at |
--- |
0,0355 |
2,73 |
206478_at |
KIAA0125 |
0,0503 |
2,66 |
209387_s_at |
TM4SF1 |
0,0425 |
2,66 |
212509_s_at |
MXRA7 |
0,0444 |
2,65 |
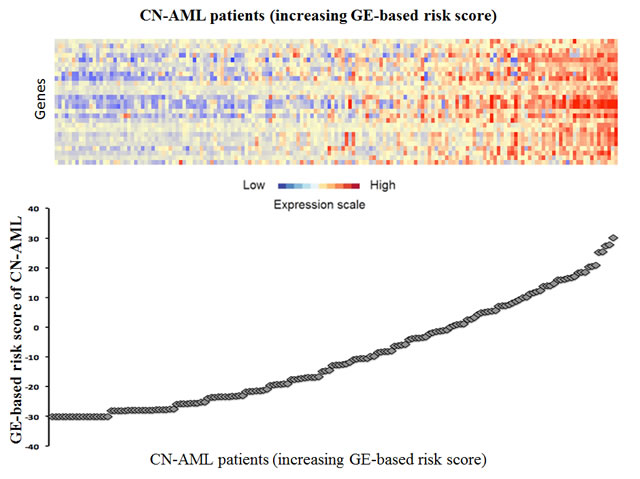
Figure 1: GE-based risk score in CN-AML. Clustergram (upper part) of genes ordered from best to worst prognosis and samples ordered by increasing GE-based risk score (lower part) for CN-AML patients (N=163). The level of the probe set signal is displayed from low, deep blue to high, deep red gene expression.
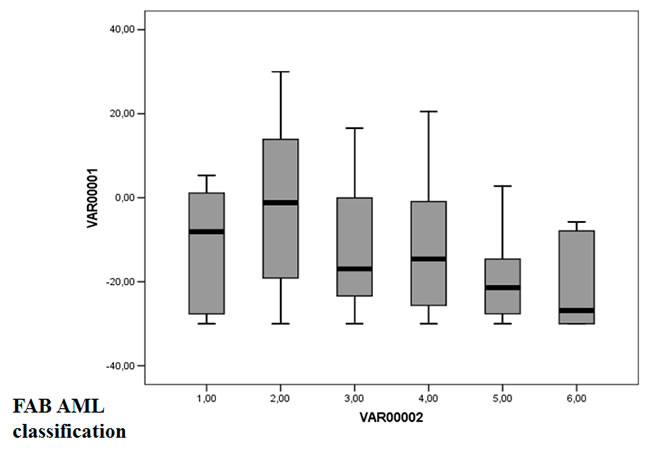
Figure 2: GE-based risk score in FAB CN-AML classification. The GE-based risk score was investigated in the groups of the FAB classification AML in the CN-AML cohort of 163 patients (M0: Minimally differentiated acute myeloblastic leukemia; M1: Acute myeloblastic leukemia without maturation; M2: Acute myeloblastic leukemia with maturation; M4: Acute myelomonocytic leukemia; M5: Acute monocytic and monoblastic leukemia; M6: Acute erythroid leukemia). * Indicate that the score value is significantly higher in the group compared to all the patients of the cohort (P < .05). ** Indicate that the score value is significantly lower in the group compared to all the patients of the cohort (P < .05).
When used as a continuous variable, GE-based risk score had prognostic value (P ≤ 10-4; data not shown). Patients of the training cohort (N=163) were ranked according to increased prognostic score, and for a given score value, the difference in survival of patients with a GE-based risk score ≤ score or > score was computed. A maximum difference in overall survival (OS) was obtained with a score = -16.92 splitting patients in a high-risk group of 53.4% of patients (prognostic score > -16.92) with a 6.2 months median OS and a low risk group of 46.6% of patients (prognostic score ≤ -16.92) with not reached median survival (Figure 3A). The prognostic value of our GE-based risk score was validated in an independent CN-AML patient’s cohort (N=79) with a 9.9 months median OS in the high risk group and not reached median survival in the low risk group (Figure 3B).
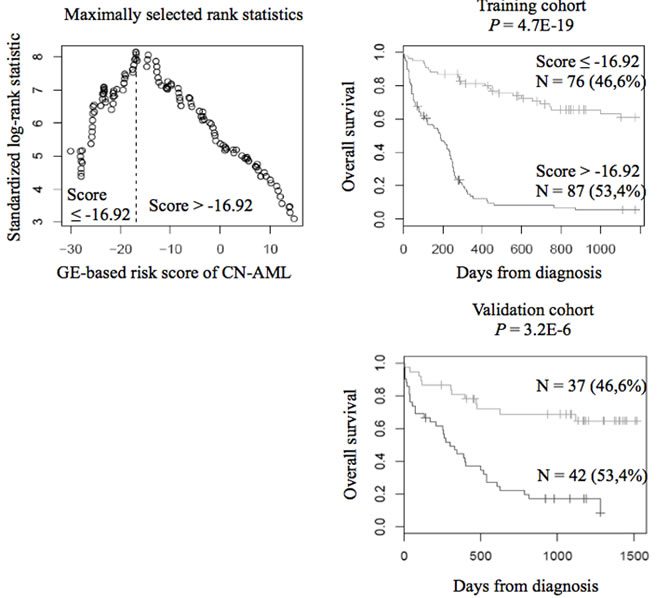
Figure 3: Prognostic value of GE-based risk score in CN-AML. Patients of the training cohort (N=163) were ranked according to increased GE-based risk score and a maximum difference in OS was obtained with a score = -16.92 splitting patients in a high risk (53.4%) and low risk (46.6%) groups. The prognostic value of GE-based risk score was tested on an independent cohort of 79 patients (validation cohort). The parameters to compute the GE-based risk score of patients in the validation cohort and the proportions delineating the 2 prognostic groups were those defined with the training cohort.
Cox analysis was used to determine whether GE-based risk score provides additional prognostic information compared to previously-identified poor outcome-related markers such as BAALC, ERG, MN1 or EVI1 gene expression (supplementary Figure S1), and for gene signatures established by Bullinger’s and Metzeler’s groups [6,8]. Using univariate analyses, GE-based risk score, Bullinger’s and Metzler’s gene expression signatures, BAALC, ERG, MN1 and EVI1 gene expression were prognostic (P < .005; Table 2A). When compared two by two, GE-based risk score tested with EVI1 expression remained significant (P < .0001; Table 2B). When all parameters were tested together, only GE-based risk score and EVI1 gene expression kept prognostic value (Table 2C).
Table 2: Cox univariate and multivariate analysis of OS in CN-AML patients’ training cohort (N = 163). The prognostic factors were tested as single variable (A) or multi variables (B, C) using Cox-model. P-values and the hazard ratios (HR) are shown. NS, Not significant at a 5% threshold.
A. |
Overall survival (n=163) |
|
Prognostic variable |
HR |
P value |
GE-based risk score |
6.79 |
<.0001 |
BAALC expression |
1.99 |
.001 |
ERG expression |
2.01 |
<.0001 |
MN1 expression |
2.49 |
<.0001 |
EVI1 expression |
2.06 |
.001 |
Metzeler's GEP score |
3.41 |
<.0001 |
Bullinger's GEP signature |
1.59 |
.01 |
B. |
Overall survival (n=163) |
|
Prognostic variables compared two by two |
HR |
P value |
GE-based risk score |
6.51 |
<.0001 |
BAALC expression |
1.12 |
NS |
GE-based risk score |
6.84 |
<.0001 |
ERG expression |
.98 |
NS |
GE-based risk score |
6.05 |
<.0001 |
MN1 expression |
1.57 |
NS |
GE-based risk score |
7.57 |
<.0001 |
EVI1 expression |
2.37 |
<.0001 |
GE-based risk score |
8.71 |
<.0001 |
Metzeler's GEP score |
.73 |
NS |
GE-based risk score |
7.74 |
<.0001 |
Bullinger's GEP signature |
.75 |
NS |
C. |
Overall survival (n=163) |
|
All prognostic variables |
HR |
P value |
GE-based risk score |
8.5 |
<.0001 |
BAALC expression |
1.1 |
NS |
ERG expression |
1.0 |
NS |
MN1 expression |
1.42 |
NS |
EVI1 expression |
2.25 |
<.0001 |
Metzeler's GEP score |
.52 |
NS |
Bullinger's GEP signature |
.59 |
NS |
Association of GE-based risk score and EVI1 expression as prognostic factor in CN-AML patients
Since EVI1 and GE-based risk score had independent prognostic information, they were combined to split patients into 3 groups with different OS. The first group comprised 40% of patients with low risk score, the second group 25% of patients with high risk score and EVI1low expression and the third group 35% of patients with high risk score and EVI1high expression. Patients of group 3 had the worst survival with 3.6 month median OS, patients of group 2 with high risk score and EVI1low expression had a median OS of 8.4 months and patients of group 1 had not reached median OS (Figure 4A). In the validation cohort of 79 CN-AML patients, median OS was not reached for group 1, was 13 months for group 2 and 8 months for group 3 (Figure 4B).
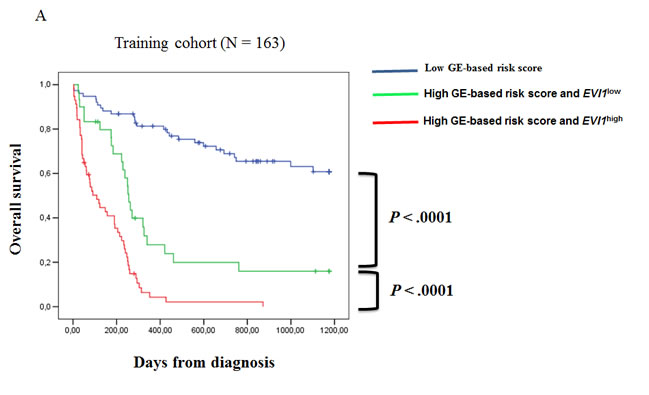
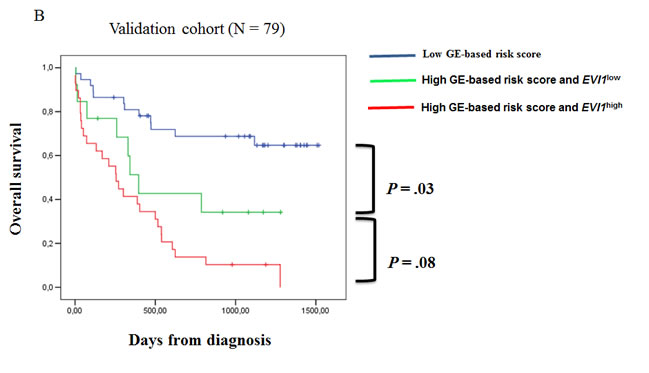
Figure 4: Association of GE-based risk score and EVI1 expression in CN-AML patients. (A) Distribution of the patients and Kaplan-Meier estimates of overall survival in the training cohort of 163 patients of low risk score and EVI1low expression patients (blue), low risk score and EVI1high expression patients (black), high risk score and EVI1low expression patients (green) and high risk score and EVI1high expression patients (red). (B) Kaplan-Meier estimates of overall survival in the training cohort and validation cohort (C) of low risk score patients (blue), high risk score and EVI1low expression patients (green) and high risk score and EVI1high expression patients (red).
Discussion
Given the genetic heterogeneity of hematological malignancies, GEP studies have enabled the detection of new biologically and prognostically relevant subtypes of patients [9,11,12]. In the present study, we designed a GE-based risk score incorporating the prognostic information of 22 genes associated with poor OS in CN-AML patients. This risk score allowed splitting CN-AML patients of 2 independent cohorts into 2 groups: a high risk group with 6.2 or 9.9 months median OS and a low risk group with not reached median OS (Figure 3) [6,8].
Comparing the current list of 22 distinct genes with previously-published prognostic gene signatures, 2 and 17 of our identified target genes overlapped with the 133 and 86 survival predictors described by Bullinger et al. and Metzeler et al., respectively [6,8] (supplemental Tables S1 A&B).
Besides the powerful prognostic value of this GE-based risk score, our current study highlights some pathways that could be involved in poor prognostic CN-AML. Among the 22 genes, the transcription factor TCF4 (T-cell factor 4) was shown to be a part of a gene set overexpressed in leukemic cells of acute T-cell leukemia/lymphoma patients [13] and to be associated with chemotherapy cross-resistance and treatment outcome in childhood acute lymphoblastic leukemia [14]. TCF4 protein is also known to interact with beta-catenin whose up-regulation has been observed in AML samples in association with poor prognosis [15]. Interaction of beta-catenin with TCF4 is critical in the activation of the cell cycle genes in response to upstream signals of Wnt/beta-catenin pathway. Interestingly, Tian et al. identified a new small molecule inhibitor named BC21 which inhibits TCF4/beta-catenin binding in colon cancer cells. BC21 blocks the clonogenic activity of colon cancer cells, down-regulates c-Myc and cyclin-D1 expression, and represents a new potential anticancer agent that targets TCF4/beta-catenin interaction [16]. This inhibitor could be of clinical interest in the high-risk group of CN-AML patients identified with our GE-based risk score. Overexpression of others genes included in our signature, MSI2 (Musashi 2) and SOCS2 (Suppressor of cytokines signaling 2), predicted unfavorable outcome in AML and chronic myeloid leukemia (CML) [17,18]. The two genes were also shown to be up-regulated in leukemia in the report from the Microarray Innovation in Leukemia (MILE) study group [19]. MSI2 plays an important role in hematopoietic stem cells (HSC) proliferation and differentiation [20]. Enforced expression of MSI2 in mice created a pre-leukemic phase [21] and its overexpression was found during transition from chronic to acute phase in a CML murine model. These findings were validated in CML patients [22]. Moreover, it has been demonstrated that MSI2 activates Notch signaling pathway, inhibiting translation of Numb mRNA, a negative regulator of Notch [20]. As well, among our prognostic predictors, we identified TM4SF1 (Transmembrane 4 L six family member 1) and SCN9 (Sodium channel, voltage-gated, type IX, alpha subunit). These markers were described as novel key regulators of tumor growth, invasion and metastasis in prostate cancer and were found to be markedly up-regulated in patients’ prostatic cells [23,24]. TM4SF1 is a tetraspanin-like membrane protein reported as a negative regulator of apoptosis in pleural mesothelioma tumor cells [25] and as a key regulator of endothelial cells function and angiogenesis that could represent an attractive therapeutic target [26].
Interestingly, when compared using multivariate analysis, only the current GE-based risk score and EVI1 expression kept prognostic value. EVI1 gene encodes a transcription factor with important role in normal hematopoiesis and leukemogenesis [27]. EVI1 up-regulates cell proliferation through the activation of AP1 and by repression of transforming growth factor beta (TGF-beta) [28]. Moreover, high EVI1 blocks differentiation through its interaction with transcription factors essential in hematopoiesis such GATA1 [29], SPI1 [30] and RUNX1[31]. The prognostic impact of EVI1 expression has been a subject of debate since many years. Langabeer et al. [32] have demonstrated that EVI1 deregulation is a relatively frequent event in AML, with no predictive impact on patients’ outcome. On the contrary, Lugthart et al. [33] showed that high EVI1 levels predict adverse outcome among intermediate cytogenetic risk AML. In our study, this association allowed prognostic stratification of the high-risk group of patients who were either EVI1low or EVI1high. Furthermore, the prognostic impact of our GE-based score should be tested in the context of molecular mutations such as FLT3 ITD and NPM1 mutations [3].
Given the heterogeneity of CN-AML patients, the current GE-based risk score associated with EVI1 expression would be of clinical value to identify patients who may benefit from intensive therapeutic strategies and to develop new targeted treatments in high risk patients.
Materials and Methods
Patients
Gene expression microarray data from two independent cohorts of patients with CN-AML were used, the first cohort comprising 163 adult patients and the second one 79 adult patients. Pretreatment clinical characteristics of patients are shown elsewhere [8]. All patients received intensive chemotherapy. Affymetrix gene expression data are publicly available via the online Gene Expression Omnibus (http://www.ncbi.nlm.nih.gov/geo/)under accession number GSE12417. They were performed using Affymetrix HG-U133 A&B microarrays for first cohort of 163 patients and using Affymetrix HG-U133 plus 2.0 microarrays for the second cohort of 79 patients. Normalization of microarray data was performed using the variance stabilizing normalization algorithm, and probe set signals calculated by the median polish method. Quality control consisted of visual inspection of the array image for artifacts, assessment of RNA degradation plots, and inspection of rank-vs-residual plots after normalization and probe set summarization.
Gene expression profiling and statistical analyses
Gene expression data were analyzed with SAM (Significance Analysis of Microarrays) [34], R [35] and Bioconductor [36] softwares. Hierarchical clustering was performed with the Cluster and Treeview softwares from Eisen [37].
Selection of prognostic genes on the training set (cohort of 163 patients)
Probe sets were selected for prognostic significance using Maxstat R function and Benjamini Hochberg multiple testing correction [10] yielding 27 significant probe sets (Adjusted P value < .05; Table 1).
Building gene expression (GE)-based risk score
To gather prognostic information of the 27 prognostic probe sets within one parameter, GE-based risk score of CN-AML was built as the sum of the beta coefficients weighted by ± 1 according to the patient signal above or below the probe set Maxstat value [10].
Validation on the independent cohort of patients
The GE-based risk score of CN-AML was individually calculated and patients grouped according to the prognostic models and cut-offs from the training cohort. The prognostic value of this scoring was evaluated using log-rank statistics and Cox models.
Statistical analyses
BAALC, ERG, MN1 and EVI1 gene expression was assessed using 222780_s_at, 211626_s_at, 205330_at and 221884_at Affymetrix probe sets, respectively. Their prognostic value was assessed using Maxstat R function (Supplementary Figure S1). Computations were done with R.2.10.1 (http://www.r-project.org/) and bioconductor version 2.5. Cox analyses were performed with the SPSS version 12.0 software (SPSS, Chicago, IL, USA).
Acknowledgements
This work was supported by grants from ARC (SL220110603450, Paris France) and the European Community (FP7- OVERMYR). We thank the Microarray Core Facility of IRB (http://irb.montp.inserm.fr/en/index.php?page=Plateau&IdEquipe=6).
Reference
1. Mrózek K, Heerema NA, Bloomfield CD. Cytogenetics in acute leukemia. Blood Reviews. 2004; 18:115-136
2. Grimwade D, Walker H, Oliver F, Wheatley K, Harrison C, Harrison G, Rees J, Hann I, Stevens R, Burnett A, Goldstone A. The Importance of Diagnostic Cytogenetics on Outcome in AML: Analysis of 1,612 Patients Entered Into the MRC AML 10 Trial. Blood. 1998; 92:2322-2333
3. Mrózek K, Marcucci G, Paschka P, Whitman SP, Bloomfield CD. Clinical Relevance of Mutations and Gene-Expression Changes in Adult Acute Myeloid Leukemia with Normal Cytogenetics: Are We Ready for a Prognostically Prioritized Molecular Classification? Blood. 2007; 109:431-448
4. Haferlach C, Kern W, Schindela S, Kohlmann A, Alpermann T, Schnittger S, Haferlach T. Gene expression of BAALC, CDKN1B, ERG, and MN1 adds independent prognostic information to cytogenetics and molecular mutations in adult acute myeloid leukemia. Genes Chromosomes Cancer. 2012; 51:257-265
5. Döhner K, Schlenk RF, Habdank M, Scholl C, Rücker FG, Corbacioglu A, Bullinger L, Fröhling S, Döhner H. Mutant Nucleophosmin (NPM1) Predicts Favorable Prognosis in Younger Adults with Acute Myeloid Leukemia and Normal Cytogenetics: Interaction with Other Gene Mutations. Blood. 2005; 106:3740-3746
6. Bullinger L, Dohner K, Bair E, Frohling S, Schlenk RF, Tibshirani R, Dohner H, Pollack JR. Use of Gene-Expression Profiling to Identify Prognostic Subclasses in Adult Acute Myeloid Leukemia. The New England Journal of Medecine. 2004; 350:1605-1616
7. Radmacher MD, Marcucci G, Ruppert AS, Mrózek K, Whitman SP, Vardiman JW, Paschka P, Vukosavljevic T, Baldus CD, Kolitz JE, Caligiuri MA, Larson RA, Bloomfield CD. Independent Confirmation of a Prognostic Gene-Expression Signature in Adult Acute Myeloid Leukemia with a Normal Karyotype: A Cancer and Leukemia Group B Study. Blood. 2006; 108:1677-1683
8. Metzeler KH et al. An 86-probe-set gene-expression signature predicts survival in cytogenetically normal acute myeloid leukemia. Blood. 2008; 112:4193-4201
9. Moreaux J, Klein B, Bataille R, Descamps G, Maïga S, Hose D, Goldschmidt H, Jauch A, Rème T, Jourdan M, Amiot M, Pellat-Deceunynck C. A high-risk signature for patients with multiple myeloma established from the molecular classification of human myeloma cell lines. Haematologica. 2011; 96:574-582
10. Kassambara A, Hose D, Moreaux J, Walker BA, Protopopov A, Reme T, Pellestor F, Pantesco V, Jauch A, Morgan G, Goldschmidt H, Klein B. Genes with a spike expression are clustered in chromosome (sub)bands and spike (sub)bands have a powerful prognostic value in patients with multiple myeloma. Haematologica. 2011; DOI: 10.3324/haematol.2011.046821
11. Wouters BJ, Löwenberg B, Delwel R. A decade of genome-wide gene expression profiling in acute myeloid leukemia: flashback and prospects. Blood. 2009; 113:291 -298
12. Bou Samra E, Moreaux J, Vacheret F, Mills K, Rufflé F, Chiesa J, Piquemal D, Boureux A, Lavabre-Bertrand T, Jourdan E, Commes T. New prognostic markers, determined using gene expression analyses, reveal two distinct subtypes of chronic myelomonocytic leukaemia patients. British Journal of Haematology. 2012; 157:347–356
13. Pise-Masison CA, Radonovich M, Dohoney K, Morris JC, O’Mahony D, Lee M-J, Trepel J, Waldmann TA, Janik JE, Brady JN. Gene Expression Profiling of ATL Patients: Compilation of Disease-Related Genes and Evidence for TCF4 Involvement in BIRC5 Gene Expression and Cell Viability. Blood. 2009; 113:4016-4026
14. Lugthart S, Cheok MH, den Boer ML, Yang W, Holleman A, Cheng C, Pui C-H, Relling MV, Janka-Schaub GE, Pieters R, Evans WE. Identification of genes associated with chemotherapy crossresistance and treatment response in childhood acute lymphoblastic leukemia. Cancer Cell. 2005; 7:375-386
15. Gandillet A, Park S, Lassailly F, Griessinger E, Vargaftig J, Filby A, Lister TA, Bonnet D. Heterogeneous sensitivity of human acute myeloid leukemia to |[beta]|-catenin down-modulation. Leukemia. 2011; 25:770-780
16. Tian W, Han X, Yan M, Xu Y, Duggineni S, Lin N, Luo G, Li YM, Han X, Huang Z, An J. Structure-Based Discovery of a Novel Inhibitor Targeting the β-Catenin/Tcf4 Interaction. Biochemistry. 2011; 51:724-731
17. Byers RJ, Currie T, Tholouli E, Rodig SJ, Kutok JL. MSI2 Protein Expression Predicts Unfavorable Outcome in Acute Myeloid Leukemia. Blood. 2011; 118:2857-2867
18. Zheng C, Li L, Haak M, Brors B, Frank O, Giehl M, Fabarius A, Schatz M, Weisser A, Lorentz C, Gretz N, Hehlmann R, Hochhaus A, Seifarth W. Gene expression profiling of CD34|[plus]| cells identifies a molecular signature of chronic myeloid leukemia blast crisis. Leukemia. 2006; 20:1028-1034
19. Haferlach T et al. Clinical Utility of Microarray-Based Gene Expression Profiling in the Diagnosis and Subclassification of Leukemia: Report From the International Microarray Innovations in Leukemia Study Group. Journal of Clinical Oncology. 2010; 28:2529 -2537
20. de Andres-Aguayo L, Varas F, Graf T. Musashi 2 in hematopoiesis. [Miscellaneous Article]. Current Opinion in Hematology July 2012. 2012; 19:268-272
21. Kharas MG et al. Musashi-2 regulates normal hematopoiesis and promotes aggressive myeloid leukemia. Nature Medicine. 2010; 16:903-908
22. Ito T et al. Regulation of myeloid leukaemia by the cell-fate determinant Musashi. Nature. 2010; 466:765-768
23. Allioli N, Vincent S, Vlaeminck-Guillem V, Decaussin-Petrucci M, Ragage F, Ruffion A, Samarut J. TM4SF1, a novel primary androgen receptor target gene over-expressed in human prostate cancer and involved in cell migration. The Prostate. 2011; 71:1239–1250
24. Diss JKJ, Stewart D, Pani F, Foster CS, Walker MM, Patel A, Djamgoz MBA. A potential novel marker for human prostate cancer: voltage-gated sodium channel expression in vivo. Prostate Cancer and Prostatic Diseases. 2005; 8:266-273
25. Gordon GJ, Bueno R, Sugarbaker DJ. Genes associated with prognosis after surgery for malignant pleural mesothelioma promote tumor cell survival in vitro. BMC Cancer. 2011; 11:169
26. Shih S-C, Zukauskas A, Li D, Liu G, Ang L-H, Nagy JA, Brown LF, Dvorak HF. The L6 Protein TM4SF1 Is Critical for Endothelial Cell Function and Tumor Angiogenesis. Cancer Res. 2009; 69:3272-3277
27. Maicas M, V|[aacute]|zquez I, Vicente C, Garc|[iacute]|a-S|[aacute]|nchez MA, Marcotegui N, Urquiza L, Calasanz MJ, Odero MD. Functional characterization of the promoter region of the human EVI1 gene in acute myeloid leukemia: RUNX1 and ELK1 directly regulate its transcription. Oncogene. 2012;
28. Wieser R. The oncogene and developmental regulator EVI1: Expression, biochemical properties, and biological functions. Gene. 2007; 396:346-357
29. Laricchia-Robbio L, Fazzina R, Li D, Rinaldi CR, Sinha KK, Chakraborty S, Nucifora G. Point Mutations in Two EVI1 Zn Fingers Abolish EVI1-GATA1 Interaction and Allow Erythroid Differentiation of Murine Bone Marrow Cells. Mol. Cell. Biol. 2006; 26:7658-7666
30. Laricchia-Robbio L, Premanand K, Rinaldi CR, Nucifora G. EVI1 Impairs Myelopoiesis by Deregulation of PU.1 Function. Cancer Res. 2009; 69:1633-1642
31. Senyuk V, Sinha KK, Li D, Rinaldi CR, Yanamandra S, Nucifora G. Repression of RUNX1 Activity by EVI1: A New Role of EVI1 in Leukemogenesis. Cancer Res. 2007; 67:5658-5666
32. Langabeer SE, Rogers JR, Harrison G, Wheatley K, Walker H, Bain BJ, Burnett AK, Goldstone AH, Linch DC, Grimwade D, Party OBOTMALW. EVI1 expression in acute myeloid leukaemia. British Journal of Haematology. 2001; 112:208–211
33. Lugthart S, Van Drunen E, Van Norden Y, Van Hoven A, Erpelinck CAJ, Valk PJM, Beverloo HB, Löwenberg B, Delwel R. High EVI1 Levels Predict Adverse Outcome in Acute Myeloid Leukemia: Prevalence of EVI1 Overexpression and Chromosome 3q26 Abnormalities Underestimated. Blood. 2008; 111:4329-4337
34. Cui X, Churchill GA. Statistical tests for differential expression in cDNA microarray experiments. Genome Biol. 2003; 4:210-210
35. R Development Core Team. R: A language and environment for statistical computing, 3-900051-07-0R Foundation for Statistical Computing, Vienna, Austria. 2010;
36. Gentleman RC et al. Bioconductor: open software development for computational biology and bioinformatics. Genome Biol. 2004; 5:R80
37. Eisen MB, Spellman PT, Brown PO, Botstein D. Cluster analysis and display of genome-wide expression patterns. Proc Natl Acad Sci U S A. 1998; 95:14863-14868