
INTRODUCTION
Colorectal cancer (CRC) is the third most common neoplastic disease worldwide and is the second leading cause of cancer death in the Western world [1]. It develops via a multistage process that involves the accumulation of genetic and epigenetic alterations. Wnt signaling pathway activation and mutations in the KRAS and APC genes in the majority of colorectal cancers have been demonstrated [2, 3]. However, little is known regarding the fine regulation of the Wnt/β-catenin pathway or its biological functions that might be involved in the pathogenesis of CRC. Recent studies have focused on the activity of Wnt signals, showing that they are tightly controlled by various extracellular molecules. Kakugawa and colleagues recently added greatly to our understanding of Wnt signaling and the central role of Notum in the regulation of this pathway [4]. Notum is a negative feedback regulator of Wnt. Initial studies in fruit flies suggested that it could act as a phospholipase enzyme able to cleave the link between the membrane and glypicans (GPCs), a family of heparan sulfate proteoglycans that are linked to the outer leaflet of the plasma membrane by a glycosylphosphatidylinositol (GPI) anchor and that complex with Wnt [5]. However, Kakugawa et al. recently unveiled that Notum might be considered as a hydrolase enzyme which removes the acyl group from Wnt, thereby rendering the protein inactive. The acquisition or loss of the acyl group from palmitoleic acid can ably control the activation of Wnt signals [4]. Although Hedgehog is another signaling molecule whose activity is modified by lipids, it has been demonstrated that, unlike Wnt, Hedgehog is not a substrate for Notum and that, in flies, Notum does not interact with Hedgehog signaling [4]. It has been also shown that Notum contains binding sites for polysaccharides such as GPCs sugar chains, inviting speculation that GPCs bring together Notum and Wnt — thus modulating the enzymatic interaction of Notum with Wnt, rather than acting as a substrate for Notum to cleave GPI anchors [4].
In humans, colon carcinogenesis is a long, chronic process that is thought to occur over 10 to 20 years [6]. Experimental models that mimic the disease in rodents by chemical induction in less than a few months provide a means to understand the molecular alterations that arise in human CRC [7]. The well-established azoxymethane/dextran sodium sulfate (AOM/DSS) mouse model is a suitable platform to study the most dramatic molecular and signaling changes that occur during different phases of CRC development. Although the model does not progress to metastasis, as shown by studies extending until 20–30 weeks from tumor induction, it mimics quite well many of the steps found in human sporadic CRC progression [8]. Indeed, AOM/DSS-induced tumors share many histopathological and genetic characteristics with sporadic human colon tumors [9]. Furthermore, a number of studies have shown that the AOM/DSS model is a reliable tool for the investigation of not only the most advanced phases of colorectal carcinogenesis but also the earliest events underlying CRC initiation. At an early stage, single aberrant crypts appear in the colonic mucosa, which are hard to evaluate in corresponding human pathological specimens [10].
It could be an optimal experimental platform for the investigation of new biomarkers, also through advanced approaches. In this view, the analysis of the genomic instability resulting in copy number aberrations through massive parallel sequencing, as already demonstrated for prostate cancer [11] or the detection of tumor-derived circulating cell-free DNA in plasma samples [12] could represent new possibilities for the detection and monitoring of CRC to investigate in the AOM/DSS murine model.
Here, we performed a genome-wide expression profiling of colon mucosa to identify novel potential biomarkers that could be related to tumor initiation and progression after colon cancer induction via AOM and DSS in mice.
Interestingly, in addition to the preeminent activation of the Wnt/β-catenin pathway, we observed the enhanced expression of genes that encode Wnt antagonists, which might set up a negative feedback response to activated Wnt/β-catenin signaling in CRC. In particular, we found that the NOTUM gene was significantly up-regulated and that two heparan sulfate proteoglycans, Glypican-1 (GPC1) and Glypican-3 (GPC3), which are under Notum control and act as competitive inhibitors of Wnt [13], were up- and down-regulated, respectively. Our preclinical results as well as the recent study of Kakugawa et al. [4] and the comments of Nusse [14], describing the mechanism by which Wnt signals can be down-regulated by the extracellular enzyme Notum in Drosophila, prompted us to investigate Notum and glypican levels in a set of human CRC samples. Strikingly, we found a significant alteration of these Wnt pathway molecular mediators in human colorectal adenocarcinomas with respect to normal mucosa.
Taken together, our results provide the first demonstration of a perturbed expression in the NOTUM, GPC1 and GPC3 genes in the context of colorectal carcinogenesis. Additionally, we show a significant correlation between the expression levels of these molecules and that of β-catenin, suggesting their role as novel biomarkers in advanced CRC.
RESULTS
AOM and DSS combination is effective in inducing colon cancer
Twenty weeks after AOM/DSS treatment (Figure 1A), the development of adenocarcinomas in the distal colon of mice was visually evident. Mice treated with AOM/DSS showed engrossed intestines with polypoid tumors, whereas mice that received AOM or DSS alone displayed macroscopically normal colons that were indistinguishable from those of untreated mice (Figure 1B).
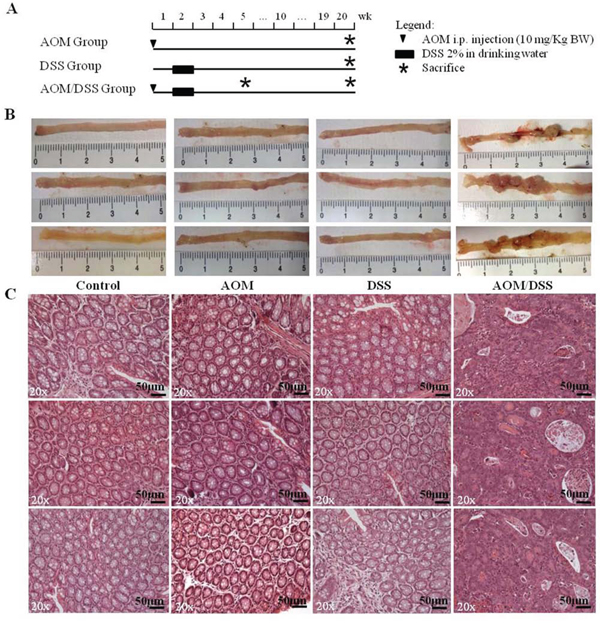
Figure 1: Experimental procedure and macroscopic and histological observation of the AOM/DSS murine model. A. Schematic experimental procedure for groups treated with AOM-alone and/or DSS. Control group (untreated littermate controls) not represented. B. Macroscopic observation of the distal regions of colons from control, AOM-, DSS- and AOM/DSS-treated mice at the end of the 20th week (only 3 of 6 animals per group are shown). Evident macroscopic lesions detectable only in AOM/DSS-treated colons. C. Hematoxylin/eosin staining of tumors and normal colons. Colon mucosae of AOM-only and DSS-only treated mice show the same histological characteristics of the control group. Adenocarcinomas with a high degree of dysplasia are detectable in AOM/DSS-treated mice. 20x original magnification. Scale bar, 50 μm.
All AOM/DSS-treated mice developed tumors (100% incidence) and the mean number of total tumors/mouse was 6.8 ± 2.7 (SD, standard deviation). After being isolated from the AOM/DSS treated mice, all lesions were analysed and confirmed to be adenocarcinomas (Figure 1C). These mouse lesions were histopathologically equivalent to human colorectal adenocarcinomas. They corresponded to well-differentiated enteroid adenocarcinomas and presented large numbers of flat and polypoid malignant tumors that were characterized by irregular, complex glands, an increased nucleus-to-cytoplasm ratio and marked losses of polarity and desmoplasia. The AOM-treated mucosa was perfectly comparable with the normal mucosa of untreated mice, whereas the DSS-treated mucosa was characterized by complete epithelial regeneration at 20 weeks after inflammatory stimulation (Figure 1C).
An additional group of animals, which were treated according to the AOM/DSS protocol, was sacrificed 5 weeks after treatment, and colon samples were collected for the immunohistochemistry of early stage CRC development. All samples presented 3–5 aberrant crypt foci (ACF), the earliest histopathological manifestations of colon lesions, which were characterized by clusters of abnormal tube-like glands in the lining of the colon and 1–3 low dysplastic microadenomas with sizes of less than 1 mm.
The macroscopic observation and histopathological analyses were made independently by two observers masked with respect to the treatment group and confirmed that the AOM/DSS model reliably reproduces, within a predictable time line, colorectal lesions distinctive of human CRC development, as reported in previous studies [7, 9]. On this basis, we investigated the transcriptional profile of advanced adenocarcinomas.
Gene expression profile via microarray analysis
RNA from colon adenocarcinomas (AOM/DSS-treated) was analysed using MouseWG-6 v2.0 Expression BeadChips and compared with normal mucosae (untreated controls), AOM-only mucosae and DSS-only treated mucosae of mice euthanised on the 20th week.
The hierarchical clustering of array expression data showed a clear distinction between AOM/DSS-treated animals and the other groups (Figure 2). In addition, the AOM- or DSS-only treatments did not significantly affect the transcriptome, as their data clustered together with those of the untreated animals.
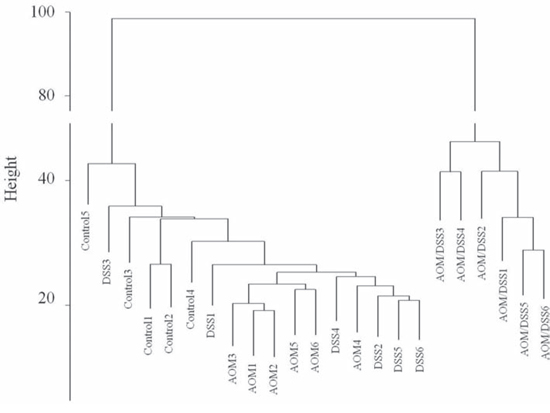
Figure 2: Hierarchical clustering of gene expression data. Hierarchical clustering was generated by R hclust function, using Euclidean distance and average linkage as metrics.
Linear model analysis (BH corrected p-value ≤ 0.05 |log2FoldChange| ≥ 1) of the 45280 probes present in the MouseWG-6 v2.0 Expression BeadChips, detected 2036 probes as differentially expressed in the adenocarcinoma group, 36 probes in DSS-mucosa and 44 probes in the AOM-mucosa group. The complete list of the gene probes and their expression levels, as determined by statistical analysis, is provided in Supplemental Table 1. Qiagen’s Ingenuity Pathway Analysis version 7 program (IPA7, http://www.ingenuity.com) was applied to all 2036 probes (1502 genes) that were differentially expressed in the adenocarcinoma group.
Amongst the 50 most up-regulated and the 50 most down-regulated genes in adenocarcinomas, it is worth noting that several Paneth cell-specific genes, including those that code for defensins (DEFA5, DEFA-RS2, DEFA4) [15], secretory phospholipase A2 (PLA2G2A), frizzled-5 (FZD5) and matrix metallopeptidases (MMPs), were differentially expressed. In addition to the expected up-regulation of AXIN2, which is widely accepted to be an important downstream effector of the Wnt signaling cascade [16], a high number of other important targets and members of the Wnt signaling pathway were differentially expressed in adenocarcinoma. They included SOX4 (SRY (sex determining region Y-box 4), PLA2G2A (phospholipase A2, group IIA), CCND1 (cyclin D1), WNT6 (wingless-type MMTV integration site family, member 6), WIF1 (WNT inhibitory factor 1), CD44, DKK3 (dickkopf WNT signaling pathway inhibitor 3), TCF4 (transcription factor 4), SFRP (secreted frizzled-related protein), FZL5 (frizzled-5), LGR5 (leucine rich repeat containing G protein coupled receptor 5) and EPHB2 (Eph receptor B2), as shown in Table 1 and Supplemental Table 1. Other interesting regulatory genes of the Wnt, Hh (Hedgehog), and BMP (Bone Morphogenetic Proteins) pathways were found to be up-regulated, such as NOTUM (log2 FC = 4.3) and GPC1 (Glypican-1) (log2 FC = 4.3), or down-regulated, such as GPC3 (Glypican-3) (log2 FC=−1.15). KRT23 (keratin 23), which was recently identified as a putative immunologic target for colon cancer prevention [17], was also significantly up-regulated in the tumors.
Table 1: Top up and down regulated genes in adenocarcinoma, AOM- and DSS-treated colon mucosae
Accession number |
Gene name |
Gene description |
log2FC |
log2 average expression |
BH corrected p-value |
Experimental group |
|---|---|---|---|---|---|---|
13240 |
Defa6 |
defensin, alpha, 6 |
6.78 |
9.44 |
5.95E-22 |
adenocarcinoma |
18780 |
Pla2g2a |
phospholipase A2, group IIA (platelets, synovial fluid) |
6.68 |
10.19 |
3.28E-22 |
adenocarcinoma |
100503970 |
AY761185 |
defensin related… |
6.61 |
9.37 |
2.36E-20 |
adenocarcinoma |
18946 |
Pnliprp1 |
pancreatic lipase-related protein 1 |
6.40 |
9.94 |
3.28E-22 |
adenocarcinoma |
13222 |
Defa-rs2 |
defensin, alpha, 3 |
6.04 |
9.41 |
2.60E-18 |
adenocarcinoma |
13238 |
Defa4 |
defensin, alpha, 4 |
5.72 |
9.26 |
5.20E-17 |
adenocarcinoma |
16673 |
Krt36 |
keratin 36 |
5.25 |
9.97 |
4.66E-19 |
adenocarcinoma |
17384 |
Mmp10 |
matrix metallopeptidase 10 (stromelysin 2) |
5.22 |
9.59 |
5.87E-17 |
adenocarcinoma |
94214 |
Spock2 |
sparc/osteonectin |
5.11 |
9.33 |
4.86E-20 |
adenocarcinoma |
17386 |
Mmp13 |
matrix metallopeptidase 13 (collagenase 3) |
5.02 |
10.19 |
1.10E-16 |
adenocarcinoma |
77583 |
Notum |
Notum pectinacetylesterase homolog (Drosophila) |
5.00 |
9.21 |
1.04E-16 |
adenocarcinoma |
94179 |
Krt23 |
keratin 23 (histone deacetylase inducible) |
4.78 |
10.49 |
4.48E-17 |
adenocarcinoma |
17082 |
Il1rl1 |
interleukin 1 receptor-like 1 |
4.75 |
9.35 |
1.07E-21 |
adenocarcinoma |
13218 |
Defa-rs1 |
defensin, alpha, related sequence 1 |
4.72 |
9.12 |
1.92E-17 |
adenocarcinoma |
230810 |
Slc30a2 |
solute carrier family 30 (zinc transporter), member 2 |
4.69 |
9.02 |
3.28E-22 |
adenocarcinoma |
23966 |
Odz4 |
teneurin transmembrane protein 4 |
4.67 |
9.30 |
4.55E-20 |
adenocarcinoma |
213948 |
Atg9b |
autophagy related 9B |
4.67 |
9.14 |
8.28E-20 |
adenocarcinoma |
18791 |
Plat |
plasminogen activator, tissue |
4.65 |
9.86 |
4.51E-17 |
adenocarcinoma |
18947 |
Pnliprp2 |
pancreatic lipase-related protein |
4.51 |
9.19 |
1.89E-17 |
adenocarcinoma |
68713 |
Ifitm1 |
interferon induced transmembrane protein 1 |
4.48 |
11.11 |
3.43E-16 |
adenocarcinoma |
99709 |
AI747448 |
autophagy related 9B |
4.35 |
9.65 |
1.96E-13 |
adenocarcinoma |
56753 |
Tacstd2 |
tumor-associated calcium signal transducer 2 |
4.35 |
9.15 |
5.20E-17 |
adenocarcinoma |
20210 |
Saa3 |
serum amyloid A 3 |
4.34 |
9.17 |
3.51E-18 |
adenocarcinoma |
14733 |
Gpc1 |
glypican 1 |
4.31 |
11.01 |
1.03E-15 |
adenocarcinoma |
12006 |
Axin2 |
axin2 |
4.16 |
10.22 |
1.37E-15 |
adenocarcinoma |
14038 |
Wfdc18 |
WAP four-disulfide core domain 18 |
4.16 |
9.48 |
1.82E-14 |
adenocarcinoma |
13216 |
Defa1 |
defensin, alpha 1 |
4.08 |
8.92 |
1.13E-15 |
adenocarcinoma |
11833 |
Aqp8 |
aquaporin 8 |
-4.96 |
13.31 |
1.05E-14 |
adenocarcinoma |
12351 |
Car4 |
carbonic anhydrase 4 |
-4.70 |
12.54 |
2.68E-18 |
adenocarcinoma |
192113 |
Atp12a |
ATPase, H+/K+ transporting, nongastric, alpha polypeptide |
-4.44 |
12.63 |
1.18E-12 |
adenocarcinoma |
56857 |
Slc37a2 |
solute carrier family 37, member 2 |
-4.43 |
10.94 |
1.82E-14 |
adenocarcinoma |
11537 |
Cfd |
complement factor D |
-4.20 |
11.50 |
5.17E-05 |
adenocarcinoma |
20341 |
Selenbp1 |
selenium binding protein 1 |
-4.12 |
13.61 |
2.56E-16 |
adenocarcinoma |
13170 |
Dbp |
D site albumin promoter binding protein |
-3.91 |
11.05 |
1.05E-08 |
adenocarcinoma |
72082 |
Cyp2c55 |
cytochrome P450, family 2, subfamily c, polypeptide 55 |
-3.90 |
12.58 |
6.66E-12 |
adenocarcinoma |
380997 |
Cyp2d12 |
cytochrome P450, family 2, subfamily d, polypeptide 12 |
-3.70 |
10.82 |
7.34E-17 |
adenocarcinoma |
23919 |
Insl5 |
insulin-like 5 |
-3.68 |
11.12 |
1.77E-15 |
adenocarcinoma |
20500 |
Slc13a2 |
solute carrier family 13, member 2 |
-3.68 |
12.17 |
7.29E-13 |
adenocarcinoma |
72273 |
2210404O07Rik |
small integral membrane protein |
-3.66 |
12.49 |
1.92E-14 |
adenocarcinoma |
216225 |
Slc5a8 |
solute carrier family 5 (iodide transporter), member 8 |
-3.56 |
12.81 |
7.78E-13 |
adenocarcinoma |
21818 |
Tgm3 |
transglutaminase 3, E polypeptide |
-3.47 |
11.03 |
2.63E-13 |
adenocarcinoma |
382097 |
Gm1123 |
predicted gene 1123 |
-3.45 |
11.67 |
3.95E-13 |
adenocarcinoma |
20342 |
Selenbp2 |
selenium binding protein 2 |
-3.43 |
11.25 |
1.59E-14 |
adenocarcinoma |
11522 |
Adh1 |
alcohol dehydrogenase 1 (class I) |
-3.37 |
13.98 |
9.73E-12 |
adenocarcinoma |
20363 |
Sepp1 |
selenoprotein P, plasma, 1 |
-3.34 |
12.83 |
3.79E-14 |
adenocarcinoma |
68416 |
Sycn |
syncollin |
-3.34 |
14.97 |
9.25E-12 |
adenocarcinoma |
64385 |
Cyp4f14 |
cytochrome P450, family 4, subfamily f, polypeptide 14 |
-3.29 |
12.48 |
1.58E-12 |
adenocarcinoma |
234669 |
Ces2b |
carboxyesterase 2B |
-3.24 |
11.00 |
6.07E-15 |
adenocarcinoma |
13105 |
Cyp2d9 |
cytochrome P450, family 2, subfamily d, polypeptide 9 |
-3.22 |
11.05 |
2.32E-12 |
adenocarcinoma |
20887 |
Sult1a1 |
sulfotransferase family 1A, phenol-preferring, member 1 |
-3.19 |
12.30 |
1.78E-15 |
adenocarcinoma |
13346 |
Des |
desmin |
-3.16 |
11.60 |
1.53E-10 |
adenocarcinoma |
13113 |
Cyp3a13 |
cytochrome P450, family 3, subfamily a, polypeptide 13 |
-3.13 |
11.30 |
1.46E-14 |
adenocarcinoma |
53315 |
Sult1d1 |
sulfotransferase family 1D, member 1 |
-3.12 |
11.12 |
1.28E-14 |
adenocarcinoma |
393082 |
Mettl7a2 |
methyltransferase like 7A2 |
-3.11 |
9.63 |
4.52E-10 |
adenocarcinoma |
13101 |
Cyp2d10 |
cytochrome P450, family 2, subfamily d, polypeptide 10 |
-3.10 |
11.64 |
5.38E-14 |
adenocarcinoma |
56643 |
Slc15a1 |
solute carrier family 15 (oligopeptide transporter), member 1 |
-3.02 |
10.38 |
5.60E-17 |
adenocarcinoma |
14734 |
Gpc3 |
glypican-3 |
-1.15 |
8.94 |
1.14E-08 |
adenocarcinoma |
93695 |
Gpnmb |
glycoprotein (transmembrane) nmb |
1.81 |
10.01 |
1.26E-05 |
AOM |
12653 |
Chgb |
chromogranin B |
1.57 |
10.46 |
2.95E-06 |
AOM |
15360 |
Hmgcs2 |
3-hydroxy-3-methylglutaryl-Coenzyme A synthase 2 |
1.49 |
12.65 |
3.87E-02 |
AOM |
75646 |
Rai14 |
retinoic acid induced 14 |
1.37 |
7.32 |
2.45E-02 |
AOM |
76459 |
Car12 |
carbonic anyhydrase 12 |
1.28 |
10.38 |
7.15E-04 |
AOM |
21990 |
Tph1 |
tryptophan hydroxylase 1 |
1.12 |
8.88 |
2.82E-07 |
AOM |
26914 |
H2afy |
H2A histone family, member Y |
-2.61 |
8.71 |
3.08E-15 |
AOM |
13170 |
Dbp |
D site albumin promoter binding protein |
-2.56 |
11.05 |
5.15E-04 |
AOM |
225742 |
St8sia5 |
ST8 alpha-N-acetyl-neuraminide alpha-2,8-sialyltransferase 5 |
-2.3 |
9.07 |
1.75E-07 |
AOM |
108017 |
Fxyd4 |
FXYD domain-containing ion transport regulator 4 |
-2.22 |
10.23 |
1.04E-05 |
AOM |
393082 |
Mettl7a2 |
methyltransferase like 7A2 |
-1.83 |
9.63 |
1.93E-04 |
AOM |
192113 |
Atp12a |
ATPase, H+/K+ transporting, nongastric, alpha polypeptide |
-1.66 |
12.63 |
8.85E-04 |
AOM |
229599 |
Gm129 |
circadian associated repressor of transcription |
-1.65 |
8.93 |
7.08E-06 |
AOM |
17748 |
Mt1 |
metallothionein 1 |
-1.6 |
14.81 |
3.45E-06 |
AOM |
380997 |
Cyp2d12 |
cytochrome P450, family 2, subfamily d, polypeptide 12 |
-1.52 |
10.82 |
1.75E-07 |
AOM |
66184 |
Rps4y2 |
ribosomal protein S4-like |
-1.52 |
8.43 |
1.55E-09 |
AOM |
17829 |
Muc1 |
mucin 1, transmembrane |
-1.4 |
9.57 |
1.31E-04 |
AOM |
67133 |
Gp2 |
glycoprotein 2 (zymogen granule membrane) |
-1.27 |
10.00 |
3.27E-03 |
AOM |
20208 |
Saa1 |
serum amyloid A 1 |
-1.22 |
11.16 |
3.60E-03 |
AOM |
12346 |
Car1 |
carbonic anhydrase 1 |
-1.21 |
14.02 |
1.05E-02 |
AOM |
56857 |
Slc37a2 |
solute carrier family 37, member 2 |
-1.21 |
10.94 |
2.07E-03 |
AOM |
13105 |
Cyp2d9 |
cytochrome P450, family 2, subfamily d, polypeptide 9 |
-1.2 |
11.05 |
1.29E-03 |
AOM |
67204 |
Eif2s2 |
eukaryotic translation initiation factor 2, subunit 2 (beta) |
-1.19 |
11.80 |
7.47E-06 |
AOM |
27409 |
Abcg5 |
ATP-binding cassette, sub-family G (WHITE), member 5 |
-1.17 |
11.49 |
4.01E-03 |
AOM |
13034 |
Ctse |
cathepsin E |
-1.15 |
11.54 |
8.49E-04 |
AOM |
53376 |
Usp2 |
ubiquitin specific peptidase 2 |
-1.14 |
9.19 |
6.67E-05 |
AOM |
207952 |
Klhl25 |
kelch-like 25 |
-1.06 |
8.24 |
6.88E-07 |
AOM |
208715 |
Hmgcs1 |
3-hydroxy-3-methylglutaryl-Coenzyme A synthase 1 |
-1.03 |
14.25 |
6.52E-03 |
AOM |
20692 |
Sparc |
secreted acidic cysteine rich glycoprotein |
-1.01 |
10.58 |
7.42E-03 |
AOM |
67080 |
1700019D03Rik |
RIKEN cDNA 1700019D03 gene |
-1 |
11.38 |
1.40E-03 |
AOM |
66660 |
Sltm |
SAFB-like, transcription modulator |
2.36 |
8.82 |
3.75E-02 |
DSS |
12653 |
Chgb |
chromogranin B |
1.6 |
10.46 |
2.62E-06 |
DSS |
75646 |
Rai14 |
retinoic acid induced 14 |
1.4 |
7.32 |
2.57E-02 |
DSS |
18030 |
Nfil3 |
nuclear factor, interleukin 3, regulated |
1.29 |
9.42 |
8.39E-05 |
DSS |
21990 |
Tph1 |
tryptophan hydroxylase 1 |
1.24 |
8.88 |
5.26E-08 |
DSS |
11551 |
Adra2a |
adrenergic receptor, alpha 2a |
1.23 |
10.69 |
7.68E-03 |
DSS |
76459 |
Car12 |
carbonic anyhydrase 12 |
1.16 |
10.38 |
1.94E-03 |
DSS |
104158 |
Ces1d |
carboxylesterase 1D |
1.13 |
11.21 |
3.84E-02 |
DSS |
242705 |
E2f2 |
E2F transcription factor 2 |
1.04 |
9.05 |
6.36E-05 |
DSS |
66811 |
Duoxa2 |
dual oxidase maturation factor 2 |
1 |
9.91 |
1.01E-02 |
DSS |
13170 |
Dbp |
D site albumin promoter binding protein |
-3.68 |
11.05 |
4.09E-06 |
DSS |
26914 |
H2afy |
H2A histone family, member Y |
-2.57 |
8.71 |
3.93E-15 |
DSS |
229599 |
Gm129 |
circadian associated repressor of transcription |
-1.87 |
8.93 |
1.18E-06 |
DSS |
225742 |
St8sia5 |
ST8 alpha-N-acetyl-neuraminide alpha-2,8-sialyltransferase 5 |
-1.65 |
9.07 |
4.46E-05 |
DSS |
393082 |
Mettl7a2 |
methyltransferase like 7A2 |
-1.64 |
9.63 |
9.21E-04 |
DSS |
66184 |
Rps4y2 |
ribosomal protein S4-like |
-1.44 |
8.43 |
4.32E-09 |
DSS |
108017 |
Fxyd4 |
FXYD domain-containing ion transport regulator 4 |
-1.42 |
10.23 |
2.94E-03 |
DSS |
21685 |
Tef |
thyrotroph embryonic factor |
-1.34 |
9.95 |
2.17E-03 |
DSS |
217166 |
Nr1d1 |
nuclear receptor subfamily 1, group D, member 1 |
-1.2 |
10.00 |
2.45E-02 |
DSS |
53376 |
Usp2 |
ubiquitin specific peptidase 2 |
-1.17 |
9.19 |
6.03E-05 |
DSS |
12346 |
Car1 |
carbonic anhydrase 1 |
-1.12 |
14.02 |
2.45E-02 |
DSS |
17829 |
Muc1 |
mucin 1, transmembrane |
-1.1 |
9.57 |
1.94E-03 |
DSS |
13034 |
Ctse |
cathepsin E |
-1.08 |
11.54 |
1.77E-03 |
DSS |
20692 |
Sparc |
secreted acidic cysteine rich glycoprotein |
-1.07 |
10.58 |
5.73E-03 |
DSS |
192113 |
Atp12a |
ATPase, H+/K+ transporting, nongastric, alpha polypeptide |
-1.05 |
12.63 |
3.84E-02 |
DSS |
380997 |
Cyp2d12 |
cytochrome P450, family 2, subfamily d, polypeptide 12 |
-1.04 |
10.82 |
6.48E-05 |
DSS |
56857 |
Slc37a2 |
solute carrier family 37, member 2 |
-1.04 |
10.94 |
8.74E-03 |
DSS |
The fourth column shows the Log2FC of adenocarcinoma, AOM-treated mucosa and DSS-treated mucosa, respectively, vs normal mucosa. The significance level is indicated by a corrected p-value.
Interestingly, the majority of down-regulated genes in the tumors were cell membrane transporters that are involved in the movement of ions or small substrates across the intestinal membrane, such as AQP8 (aquaporin 8), a marker of normal proliferating colonic epithelial cells that is involved in fluid transport in the colon; CAR4 (carbonic anhydrase 4), which has established roles in bicarbonate production and secretion in the intestine; ATP12A (ATPase, H+/K+ transporting), which is responsible for potassium absorption; SLC37A2 (solute carrier family 37 (glucose-6-phosphate transporter) member-2) and SELENBP1 (selenium-binding protein).
The AOM-only treated and DSS-only treated groups displayed a small set of altered genes, with very low log2-FC values, compared with the AOM/DSS treated colon mucosa. Among the altered genes, the common up-/down-regulated ones, which were found in both experimental groups, were genes that are mainly involved in (i) gene expression regulation, such as H2AFY (H2A histone family, member Y), DBP (the D site of albumin promoter binding protein), EIF2S2 (eukaryotic translation initiation factor 2, subunit 2), GM129 (circadian associated repressor of transcription), RPS4Y2 (ribosomal protein S4, Y-linked 2); (ii) membrane receptors and transporters, such as GPNMB (glycoprotein NMB), FXYD4 (frizzled family receptor 4), MUC1 (mucin 1), ATP12A (ATPase, H+/K+ transporting), SLC37A2 (solute carrier family 37 (glucose-6-phosphate transporter), member-2), CTS-E (cathepsin E), SPARC (secreted protein, acidic, cysteine-rich); and (iii) metabolism, such as HMGCS2 (3-hydroxy-3-methylglutaryl-CoA synthase-2), TPH1 (tryptophan hydroxylase 1); and SAA1 (serum amyloid A1). It is also worth noting that genes coding for detoxification enzymes were altered in both groups: in particular, MT1 (metallothionein 1), CYP2D12 and CYP2D9 (cytochrome P450) were found to be down-regulated in AOM-treated mice, whereas CES1D (carboxylesterase 1D) and CYP2DL2 (cytochrome P450) were up- and down-regulated, respectively, in DSS-treated mice. Both groups showed no alterations in inflammatory genes.
Single qPCR, which was performed on a subset of genes selected among that mainly dysregulated genes or involved in Wnt pathway control, confirmed the microarray analysis results: NOTUM, GPC1, AXIN2, WNT6, IL1RL1, DEFA-6, LGR5, and SOX4 were found to be up-regulated, whereas GPC3, AQP8, SFRP1, and CAR4 were down-regulated (Figure 3).
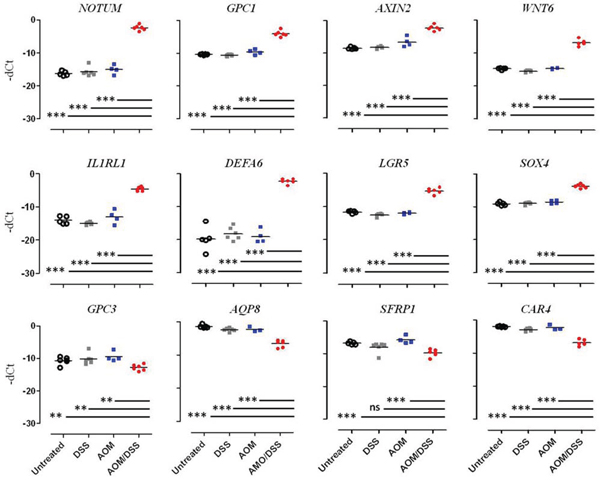
Figure 3: Multi-Gene qPCR validation of differential gene expression. Gene expression levels were measured in the four different conditions: Untreated (white circle), DSS (grey square), AOM (blue square) and AOM/DSS (red circle). The results are expressed as Delta CT values between the CT value of the gene of interest and the CT value of β2-microglobulin. Each dot represents the evaluation of the gene levels in a single mouse. Statistically significant differences were calculated using Student’s t-test: ***p < 0.0005; **p < 0.0078.
Two main pathways are altered in adenocarcinomas: the LPS/IL-1-mediated inhibition of RXR function and the Wnt/β-catenin signaling pathway
Our microarray data set was analysed using IPA7 to discern whether specific biological pathways or functional gene groups were differentially affected in tumors and which of these pathways were still altered in AOM-only and DSS-only treated mucosa after a period of mucosal regeneration.
The results of the gene ontology analysis showed that the top 3 canonical pathways altered in adenocarcinomas were the LPS/IL-1 mediated inhibition of RXR function, Wnt/β-catenin signaling and the super-pathway of melatonin degradation (Figure 4).
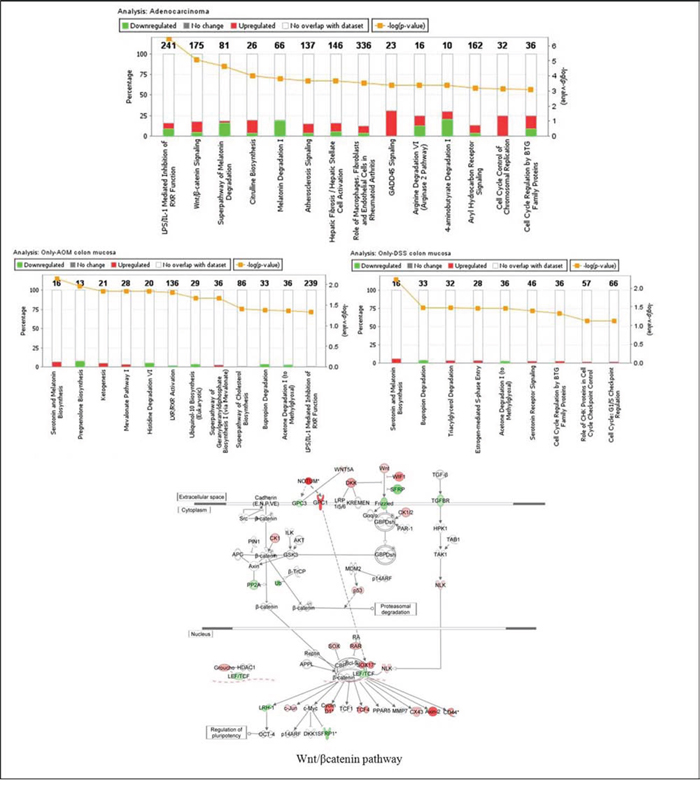
Figure 4: Enriched canonical pathways of the differentially expressed genes as determined by Ingenuity Pathway Analysis (IPA). The significance of canonical pathways was determined by IPA’s default threshold [–log(p-value)]> 3 for adenocarcinoma and [–log (p-value)] > 1.3 for colon mucosa of AOM-only and DSS-only treated mice. P-value calculated by Fisher’s exact test. The associated gene number above each column represents the number of differentially expressed genes that were involved in the respective canonical pathways. The percentage of genes that were up- or down-regulated is represented in red or green, respectively. In the lower figure, the Wnt/β-catenin pathway has been added and shows the IPA overlay of analysis in adenocarcinoma (up-regulated genes in red, down-regulated genes in green). Direct or indirect interactions are shown by complete or dashed lines, respectively.
The metabolic super-pathway of melatonin degradation was the pathway with the majority of genes being significantly down-regulated. Several mechanisms by which melatonin controls colon cancer have been proposed and involve the inhibition of tumor angiogenesis, maintenance of the intracellular level of glutathione, and modulation of mitotic and apoptotic processes [18]. However, further studies and controlled clinical trials are still needed in order to establish melatonin’s role in cancer treatment more concretely.
We focused our attention on the top 2 significantly dysregulated pathways both of which enclosed the highest number of genes (Supplemental Table 2).
An examination of the LPS/IL-1-mediated inhibition of the RXR function signaling pathway revealed the strong transcriptional up-regulation of several genes that are linked to inflammation and injury response, including IL1β (interleukin 1 beta), IL1RL1 (IL1 receptor-like 1), TNF (tumor necrosis factor), TNFRSF11B (TNF receptor superfamily, member 11b), APOC4 (apolipoprotein C-IV), APOE (apolipoprotein E), and GST (glutathione S-transferase), but the down-regulation of PPARGC1A/B (peroxisome proliferator-activated receptor gamma, coactivator 1 alpha/beta). Reductions in the expression of transport proteins, such as ABCG5/8 (ATP-binding cassette, sub-family G, member 5/8) and ABCC3 (ATP-binding cassette, sub-family C, member 3), and metabolizing enzymes, such as GSTT1 (glutathione S-transferase theta 1), MGST1/3 (microsomal glutathione S-transferase 1/3) and CYP2C9 (cytochrome P450, family 2, subfamily C, polypeptide 9), were also detected. The decreased expression of these genes has been recently shown to cause impaired metabolism, transport and/or biosynthesis of lipids, cholesterol and xenobiotics [19–21].
As expected, the Wnt/β-catenin signaling pathway was found to be largely involved in tumor progression. As shown in Figure 4 and Supplemental Table 1, the major up-regulated genes were the ligands WNT5A, WNT6, and WNT10A; the Wnt receptor FZD10, the scaffolding protein AXIN2, which is essential for β-catenin degradation; the Wnt inhibitory proteins (WIF1, DKK3); TCF4, the β-catenin transcriptional partner and the Nemo-like kinase (NLK), which leads to low LEF/TCF/β-catenin complex binding to DNA and LEF1/TCF4 degradation [22].
Other genes, whose functions have been shown to correlate with the Wnt/β-catenin signaling pathway, were LGR5, EPHB2, EPHB4, EPHB6, NOTUM, GPC1 and GPC3 [22, 23]. Interestingly, only a few altered genes were found in the AOM-only and DSS-only treated colon mucosae. Moreover, NFKB and AKT were equally detected to be hub genes of the most altered molecular pathways in both experimental groups, even without the direct deregulation of their expression level (data not shown). In fact, only the residual activity of the NFKB inflammatory response pathway and the antiapoptotic activity of AKT appeared to persist during the regeneration of the colon mucosa, which occurred after either the AOM-only or DSS-only treatments.
Correlation of Notum overexpression with intracellular β-catenin staining and changes of glypicans tissue distribution
In the context of the Wnt/β-catenin pathway, we focused our attention on the regulation of Notum expression in CRC murine lesions as Armadillo, an ortholog of human and murine β-catenin, is known to regulate Drosophila Notum [23]. We performed immunohistochemistry on advanced adenocarcinomas and early lesions of animals sacrificed 5 weeks after tumor induction (Figure 5). Intracellular β-catenin (nuclear and cytoplasmic staining) was observed in all CRC FFPE sections, whereas membrane-bound β-catenin was detected only in normal colon mucosa. Dysplastic ACF exhibited intense intracellular β-catenin staining, which is consistent with previous reports [7, 9], and the same pattern was observed for microadenomas, adenomas and adenocarcinomas.
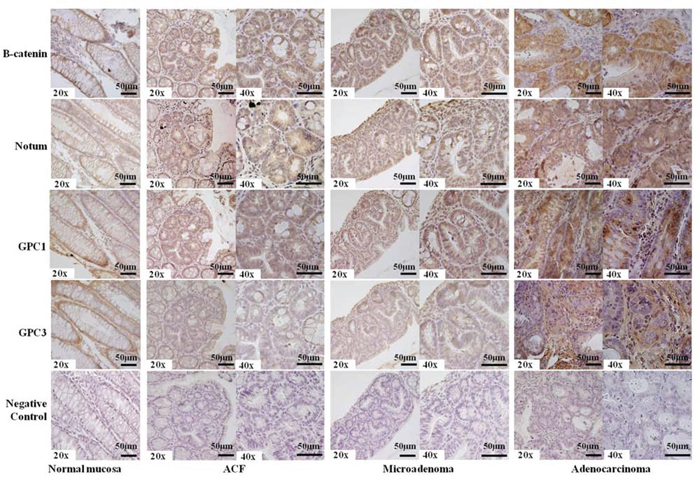
Figure 5: Representative results of immunostaining for β-catenin, Notum, Glypican-1, Glypican-3 in FFPE mouse tissue sections. Membrane-bound β-catenin, Notum and Glypican-1 were observed in normal colon mucosa, whereas dysplastic ACF (Aberrant Crypt Foci), microadenomas, and adenocarcinomas exhibited more intense (++) staining (nuclear or cytoplasmic). Glypican-3 staining was less intense (+) than Glypican-1 staining (++), and the adenocarcinoma showed a negative signal (-) with respect to nuclear or cytoplasmic compartments along with more intense (++) extracellular staining. Incubation with a primary antibody was omitted in the negative control. Sections were counterstained with hematoxylin: 20x and 40x original magnification. Scale bar, 50 μm.
Notum overexpression was associated with intracellular β-catenin localization (100% of cases) and also observed in early lesions. Glypican-1 staining showed the same type of Notum staining positivity, although a mild cytoplasmic signal was also observed in early lesions. Positive staining for Glypican-1 was observed in 90% of all studied ACFs (21 positive of 24 analysed), whereas Glypican-3 exhibited evident membrane staining in normal colon mucosa and a negative signal in all (100%) dysplastic colon crypts. Similarly, no membrane staining was present in the most advanced tumors. However, we observed extracellular staining in these tumors that is indicative of a marked release of Glypican-3 from the cell membrane (Figure 5).
Notum and glypicans gene expression and protein localization in human CRC samples
To investigate the eventual correspondence between our observations in the CRC murine model and human colorectal carcinogenesis, we analysed the mRNA levels of NOTUM, GPC1 and GPC3 in 10 representative human tissue samples, including primary CRC specimens and normal distal colorectal mucosa from the same patient. In this pilot study, a statistically significant up-regulation of NOTUM and GPC1 (p-value < 0.0001) and down-regulation of GPC3 (p-value < 0.001) mRNA levels were observed in all tumor samples. The relative expression levels were determined with the ΔΔCT method individually for each patient with the normal mucosa serving as the calibrator (Figure 6A). The expression level values ranged, respectively, from 66 to 4408 for NOTUM (median value 520.45), from 1.57 to 6.77 for GPC1 (median value 2.76), and from 0.2 to 1.2 for GPC3 (median value 0.69).
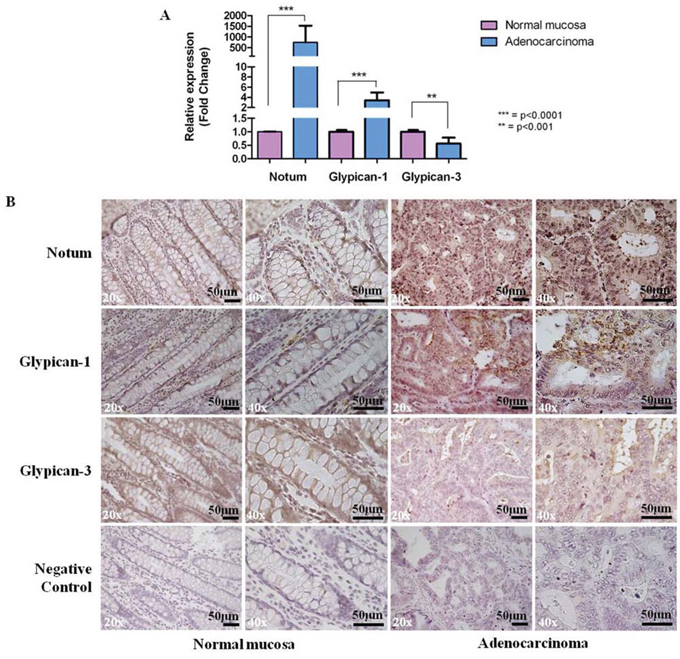
Figure 6: A. qPCR analysis of NOTUM, GPC1 and GPC3 differential gene expression in human samples. Gene expression levels were measured in human colorectal adenocarcinomas with respect to normal colon mucosae, and results are expressed as fold changes, considering the CT value of the gene of interest and the CT value of β-actin. Data are represented as mean +/− SD). Statistically significant differences were calculated using Student’s t-test: ***p < 0.0001; **p < 0.001. B. Representative results of immunostaining for Notum, Glypican-1 and Glypican-3 in human tissue sections. Strong staining (++) in CRC cases for Notum and Glypican-1; weak staining (−) in CRC cases for glypican-3. Incubation with a primary antibody was omitted in the negative control. Sections were counterstained with hematoxylin: 20x and 40x original magnification. Scale bar, 50 μm.
To assess Notum, Glypican-1 and Glypican-3 protein localization in human CRC samples, we performed immunohistochemical analysis on 10 tumor cases and 10 normal matched mucosa specimens. As previously observed in mouse specimens, the analysis revealed a strong increase of membrane/cytoplasmic staining in tumors for Notum and Glypican-1 in 100% (10/10) and 80% (8/10) of tumors, respectively, and a weak staining for Glypican-3 in 80% (8/10) (Figure 6B).
DISCUSSION
The aim of our study was to identify novel genes that are specifically deregulated in colorectal cancer using a reliable preclinical platform represented by the chemically induced mouse model of sporadic CRC. The AOM/DSS model employed in this study (one injection of AOM, one cycle of DSS – “two step model”) is an acute inflammation-related model in which the initial inflammatory microenvironment is important to promote and accelerate the malignant progression which starts after the AOM administration. Nevertheless, the most advanced adenomas and adenocarcinomas lack the strong inflammatory background observed in other mouse models, which proceed through repeated cycles of DSS administration (one injection of AOM, three cycles of DSS). In that case, the inflammation becomes chronic and non-resolved [24], as seen in human IBD-related CRC where chronic inflammation always precedes and is directly linked to tumor formation [25, 26]. Changes in gene expression are extensive in those models, especially in genes involved in the inflammatory response and immune defence [27]. Conversely, tumors generated by our “two step” AOM/DSS treatment accurately recapitulate the pathogenesis observed in human sporadic noninflammatory CRC [28]. We observed that the molecular assessment of AOM/DSS-induced tumors is characterized by a mild inflammatory background with a number of genes linked to inflammation and innate immune response, as will be discussed in detail hereafter, but without alterations in the key inflammation pathway mediators, e.g., the NFKB, IL-10, IL-6, TNFA and TGFβ genes [29, 30].
Few data are available on the long-term adaptive response of colon mucosa with respect to an independent low genotoxic stress effect (such as a single dose of the mutagen AOM) or to mild inflammatory stress (a single cycle of DSS administration). Therefore, we decided to analyse the colon mucosa of mice treated with single AOM and DSS administrations, following a regeneration time of 20 weeks. We observed a very small number of altered genes in both AOM-only and DSS-only treated mice with respect to the normal mucosa of untreated mice (Table 1). We confirmed that both the AOM-only and DSS-only treated mice showed not only morphologically normal colon mucosa but also no molecular alterations approximately 20 weeks after the initial AOM or DSS stimulation (Figure 1). Indeed, hierarchical clustering of gene expression profiles (Figure 2) revealed reasonable overlap between the genes altered in the AOM and DSS mucosae compared with the normal mucosa of the control group, proving that almost complete colon mucosa regeneration can occur after both AOM and DSS treatments. We also confirmed that the carcinogen AOM minimally affects the molecular functions of the treated colon mucosa without a subsequent DSS-induced inflammatory phase in the AOM/DSS colorectal cancer model, which is in accordance with the findings of Tanaka et al. [8].
Gene expression profiling in the adenocarcinoma showed the differential expression of 2036 probes with a |log2 FC| ≥ 1, including 1092 (53.6%) that were up-regulated and 944 (46.4%) that were down-regulated. In general, we observed a significant variation in the expression of genes, particularly those related to cell growth, immune response, cellular transport and the regulation of morphology. Our data indicate that antimicrobial α-defensins, known as components of the innate immune system, are among the most up-regulated genes in adenocarcinomas. The presence of abnormally high defensins expression levels has been identified in a variety of human tumors [31]; however, their role in carcinogenesis requires further investigation. Other markers of Paneth cells, such as secretory phospholipase A2 (PLA2G2A), MMP10 and MMP13, were also up-regulated, confirming that these cells are a cellular component of colon tumors, which is in agreement with previous reports [32, 33]. Interestingly, the presence of Paneth cells in colon cancers has been suggested to be a likely consequence of Wnt pathway activation [34].
We also reported the up-regulation of interleukin 1 receptor-like 1 (IL1RL1), interleukin-1 beta (IL1β) and other genes involved in the “LPS/IL1 mediated inhibition of RXR function”, which were all identified by IPA ontology analysis. The above observation is consistent with other data that report that the transgenic overexpression of IL1β in gastric mucosa is sufficient to induce gastric cancer in mice [35]. New findings have recently indicated that IL1β may promote colon tumor growth and invasion via the activation of cancer stem cell self-renewal and epithelial-mesenchymal transition (EMT) [36]
As expected, the second most dysregulated canonical pathway in adenocarcinoma was the Wnt/β-catenin pathway. Wnt target genes are varied and context-specific [37] because Wnt/β-catenin signaling controls proliferation, cell fate determination and differentiation in numerous developmental stages and in adult tissue homeostasis. Furthermore, Wnt signaling components are positively or negatively regulated by TCF/β-catenin [38–41].
Our results indicate that the Wnt-induced activation of AXIN2 and DKK3 as well as suppression of FZD5, secreted frizzled-related protein 1 (SFRP1) and transforming growth factor beta 3 (TGFB3) constituted negative feedback loops, which are able to dampen Wnt signaling. In addition, IL1β has been shown to indirectly activate β-catenin signaling by inducing canonical WNT7B expression and by inhibiting the expression of canonical Wnt antagonists [42]. Furthermore, we observed the up-regulation of IL1β and IL1RL1. We detected significant over-expression of TCF4, which is in accordance with Wnt-induced TCF/LEF gene expression and constitutes a positive feed-forward circuit that reinforces Wnt signaling. This feature has been observed elsewhere during colon carcinogenesis [43]. These various Wnt pathway self-regulatory loops are mostly used in a cell-specific modality, affording additional complexity to Wnt response amplitude and duration control.
Importantly, with regard to Wnt/β-catenin signal modulation, the results of our microarray analysis identified the overexpression of NOTUM and the alteration of GPC1 and GPC3 expression. There has been a recent renewed interest in the involvement of Notum and glypicans in the modulation of Wnt signaling. The secreted enzyme Notum has been found to inactivate Wnt by removing a lipid that is linked to the Wnt protein and that is required for the activation of Wnt receptor proteins [4]. Wnt signals also turn on the expression of the gene encoding Notum, leading to negative feedback regulation that intrinsically limits signaling. Originally discovered in fruit flies in screens for genes that interact with the Wnt protein Wingless, NOTUM gene encodes a secreted hydrolase, which has recently been identified in hepatocellular carcinoma with mutant β-catenin [44].
The Notum-enhanced expression in murine colorectal adenocarcinoma reflects its activation in the canonical Wnt/β-catenin pathway, implying the crucial involvement of Notum dysregulation in CRC pathogenesis. Our clinical findings in a set of human sporadic colorectal adenocarcinomas confirmed the transcriptional and protein up-regulation of Notum. This finding was in agreement with the over-expression of Notum observed in human primary colorectal and gastric cancers and their cell lines as shown in the expression database of the International Genomics Consortium (http://www.intgen.org/), where Notum overexpression is also reported in breast, lung, ovarian and endometrial cancers.
In addition, we observed the over-expression of GPC1 and under-expression of GPC3 in murine tumors. As the activity of NOTUM has been demonstrated to involve the release of GPI-anchored glypicans (analogous to Drosophila Dip and Dally) from the cell surface [45], we further investigated the involvement of such genes in the Wnt/β-catenin pathway in not only the tumors but also preneoplastic lesions detected in the colon of AOM/DSS-treated animals at 5 weeks after tumor induction. Immunohistochemistry confirmed the overexpression of Notum in 100% of the adenocarcinomas analysed. High levels of the protein were significantly associated with the intracellular (nuclear or cytoplasmic) accumulation of β-catenin (Figure 5). In contrast, the expression of the two glypicans followed a different trend. Glypican-3 exhibited marked membrane staining in normal colon mucosa, whereas a negative signal was observed in both early and late colon lesions. This finding provided further evidence supporting the functional link between Notum and Glypican-3. In fact, the use of a cellular system in which Glypican-3 stimulates Wnt signaling provided evidence that Notum can act as a negative functional regulator of this growth factor [46]. Glypican-3 has been shown to be an inhibitor of cell proliferation, and it can induce apoptosis in certain types of tumor cells [47]. Recent reports have indicated that Glypican-3 displays a tissue-specific pattern of expression during tumor progression. Glypican-3 expression is reduced in the progression of cancers that originate from GPC3-positive tissues, such as ovarian cancer [48] and mesothelioma [49]. Conversely, the expression of this glypican is up-regulated in hepatocellular carcinomas, although Glypican-3 is not expressed in the liver, suggesting that in this case it behaves as an oncofoetal protein [50]. Recent studies have also showed a down-modulation of Glypican-3 and an up-regulation of Glypican-1 gene expression in glioblastoma [51]. The molecular and immunohistochemical analysis performed in our human CRC set revealed very similar results, indicating the significant association of GPC1 over-expression and GPC3 under-expression in tumor lesions with respect to the normal colon mucosa (Figure 6).
Possible mechanisms at the basis of the transcriptional control of these two glypicans have been investigated. In several malignant tumors, including ovarian carcinoma, cholangiocarcinoma, mesothelioma, and breast cancer, GPC3 is down-regulated as a result of hypermethylation of the GPC3 promoter [48, 49, 52, 53]. Also, the involvement of miRNAs in postrascriptional control of GPC3 has been shown in hepatocellular carcinomas [54].
With regard to GPC1, few data have been reported describing transcriptional modulation of the gene in different kinds of tumors, but without a functional explanation [55]. However, the existence of other overlapping levels of regulation, possibly at level of translation have been suggested; as such, the existence of translation-level regulation has been described in some genes involved in the biosynthesis of glycosaminoglycans and proteoglycans [56].
Here, we showed the inverse correlation between gene expression and protein distribution of Notum and Glypican-3. The progressive accumulation of Glypican-3 in the adenocarcinoma extracellular environment may be explained by the release of Glypican-3 from the cell membrane. Nevertheless, the possibility that this release, in turn, could be due to the enzymatic activity of Notum, which is contextually up-regulated during CRC development, has been overcome by the last findings of Kakugawa et al [4]. Other mechanisms mediated by sheddase (protease or heparanase) could be responsible of the cleavage of cell surface attached Glypican-3 although further studies are needed to clarify this point. Currently, the mechanism of Glypican-3 shedding into the extracellular space and sera is of general interest, and the possibility of using GPC3 as a serological marker in different cancer types is under investigation [57].
Less is known regarding Glypican-1, which, in our study, showed a very similar expression pattern to that of Notum in late lesions, although some positive staining was also observed in 90% of the analysed ACFs. This finding suggests that Glypican-1 is important but not essential for tumor initiation. Glypican-1 expression has also been found to be significantly increased in a large proportion of pancreatic tumors [58, 59]. However, the functional link between Notum and Glypican-1 would benefit from in-depth investigation.
Numerous genetic and functional studies performed in Drosophila, Xenopus, zebrafish and mammals have demonstrated that glypicans may regulate the signaling activity of Wnts, Hedgehog (Hh), BMPs and FGFs in a tissue-specific manner [60–62].
For example, the activation of the Hh pathway, which is deeply involved in CRC development, can be due to the removal of the functional inhibitory effect which is exerted by GPC3 through the competition of GPC3 with the receptor Patched for Hh binding [45]. Interestingly, no transcriptional dysregulation of the principal genes involved in Hh signaling pathway was observed in our CRC model.
In the particular case of Wnts, GPI-anchored glypicans have been proposed to stimulate signaling by facilitating and/or stabilizing the interaction between Wnts and their cell surface receptors [63]. However, glypicans can also act as competitive inhibitors of Wnt signaling when secreted into the extracellular environment [64]. On this basis, our data on Glypican-1 and Glypican-3 dysregulation are of high interest, as they can help depict a more comprehensive picture of Wnt signal modulation in the tumor microenvironment.
In summary, we have demonstrated the following for the first time. Notum is over-expressed in early and late lesions of the AOM/DSS murine model of sporadic CRC and in human colorectal adenocarcinomas. Notum expression levels are correlated to β-catenin abnormal distribution, indicating that Notum expression is associated with canonical Wnt signal modulation in CRC pathogenesis. Glypican-1 and Glypican-3 dysregulation is related to Notum and β-catenin alterations mostly in AOM/DSS-induced colorectal adenocarcinomas and in human colorectal tumors but also, in some cases, in early murine CRC stages.
These data suggest that Notum, Glypican-1 and Glypican-3 may be included in the variegated landscape of the different regulators of Wnt/β-catenin signaling. Furthermore, the promising results obtained in the set of human CRC samples encouraged us to suggest them as new biomarker candidates for CRC that should be validated in further clinical studies.
MATERIALS AND METHODS
Animals and sample processing
A total of 30 6-week-old Balb/c mice were intraperitoneally injected with a single dose of 10 mg/kg azoxymethane (AOM) (Sigma-Aldrich, St. Louis, MO) on day 1, followed by a single weekly cycle of 2% dextran sulfate sodium (DSS) (MP Biomedicals, Solon, OH; MW 36–50 kDa) administered in their drinking water. The mice were divided into four groups: 1) AOM/DSS treated, 2) AOM treated, 3) DSS treated, and 4) untreated (control). At the end of the 20th week, 6 mice per group were euthanised. Early colorectal lesions were investigated at an age of 5 weeks by immunohistochemistry in an extra group of 6 AOM/DSS-treated mice. All animal procedures were performed in accordance with institutional guidelines for laboratory animal care and in adherence with ethical standards. The study was approved by the Italian Ministry of Health according to the decree n. 336/2013-B.
The large intestine was removed from each mouse, cut open longitudinally along the main axis and flushed with cold PBS. The tumor masses from AOM/DSS treated mice, AOM-only and DSS-only treated colon mucosa, as well as normal mucosa, were cut, immediately placed in 5 volumes of RNAlater (Ambion, Austin, TX), and then stored at −80°C for RNA extraction. Other areas of the large intestine were fixed in 4% paraformaldehyde for 24 hours and embedded in paraffin. Histological sections (4 μm) of formalin-fixed paraffin-embedded (FFPE) samples were then prepared using routine procedures for histopathological analyses and immunohistochemistry.
CRC patient samples
Tissues from 10 patients (5 males and 5 females; mean age of 74.1 ± 7.5 years) with CRC were obtained in collaboration with the Medical University of Plovdiv, Bulgaria. All patients signed informed consent in accordance with the WMA Declaration of Helsinki (2013). The study was approved by protocol # R-1838/15-07-2013. All patients were staged as T3N0 according to WHO classification (7th Revision of the TNM system) with a G2 grade of cellular differentiation. On the basis of the TNM classification, none of them had detected metastasis at the time of diagnosis which gives us grounds to assume that these cases could be possibly comparable to the mouse tumors.
All tissue samples were analysed by two independent pathologists.
Tumor tissue and distal normal mucosa were isolated from all patients during surgical resection, fixed in formalin and embedded in paraffin. A portion of the tumor and normal mucosa was placed in RNAlater (Ambion, Austin, TX), immediately frozen after surgery and stored at −80°C until nucleic acid extraction.
RNA extraction and purification
Total RNA was isolated from each tissue using TRIzol® reagent (Invitrogen, Carlsbad, CA) according to the manufacturer’s instructions. RNA was estimated qualitatively using an Agilent 2100 Bioanalyzer (Agilent, Santa Clara, CA) and quantified using a NanoVuePlus spectrophotometer (GE Healthcare, Milan, Italy). Any genomic DNA contamination was removed from the total RNA using a DNA-free kit (Ambion, Austin, TX, USA). Purified RNA was stored at −80°C until it was used.
RNA microarray analysis
Murine cRNA was synthesized with an Illumina RNA amplification kit (Ambion), starting from 500 ng of total RNA and following the manufacturer’s instructions. MouseWG-6 v2.0 Expression BeadChip hybridization, washing and staining were also carried out. Arrays were scanned on an Illumina BeadStation 500. BeadChip array data quality control was performed with the Illumina GenomeStudio software. The average probe intensity signal was calculated using GenomeStudio without background correction. Raw data were analysed with the oneChannelGUI [65] Bioconductor package [66]. Average probe intensities were log2 transformed and normalized by means of the Lowess method [67]. The number of genes to be evaluated was reduced by applying an interquartile (IQR) filter that removed non-significant probe sets (i.e., non-expressed and non-changing sets) [68]. Differentially expressed transcripts were detected by linear model analysis (BH corrected p-value ≤ 0.05 |log2FoldChange| ≥ 1). The following comparisons were considered: DSS-Control, AOM-Control, (AOM/DSS)-Control. Detected genes were loaded into IPA.
Gene ontology analysis
The biological interpretation of the microarray data was conducted using Qiagen’s Ingenuity Pathway Analysis version 7 (IPA7, http://www.ingenuity.com). Two parameters in the canonical pathway analysis, LogRatio and the p-value, measured the significance of the association between the data set and the canonical pathway. LogRatio represented the ratio of the number of genes from the dataset that mapped to the pathway divided by the total number of genes that mapped to the canonical pathway. The p-value was calculated with Fisher’s exact test.
Quantitative real time PCR (qPCR)
1 μg of murine DNase-treated RNA was retrotranscribed using RETROscript™ reagents (Ambion) and qPCRs were carried out using gene-specific primers (QuantiTect Primer Assay, Qiagen; Chatsworth, CA, USA; GAPDH:QT00079247, B2M:QT01149547, DEFA6:QT00 162491, IL1RL1:QT01063062, WNT6:QT01660883, SOX4:QT01755971, GPR49:QT00123193, AQP8:QT001 60559, CAR4:QT00095340, SFRP1:QT00167153, NOTUM:QT01749559, GPC1:QT00164017, GPC3: QT00118790, AXIN2:QT00126539), SYBR green and 7900HT RT-PCR Systems (Applied Biosystems, Milan, Italy). 1 μg of human DNase-treated RNA was reverse-transcribed using High Capacity cDNA Reverse Transcription kit (Applied Biosystems) and qPCRs were set up using Taqman® Gene Expression Assays (Applied Biosystems; Assay ID: NOTUM:Hs00394510_m1; GPC1:Hs00892476_m1; GPC3:Hs01018936_m1) and Taqman® Gene Expression Master Mix (Applied Biosystems). Reactions were run on 7900HT Fast RT-PCR System (Applied Biosystems). Data were analyzed using SDS software 2.3 (Applied Biosystems). Relative gene expression was quantified using the threshold cycle (CT) value and normalized to housekeeping genes β2-microglobulin and GAPDH (for murine RNA analysis) and β-actin and RNA18S5 (for human RNA analysis).
The results of the murine sample analysis were expressed as Delta CT, which represents the difference in CT values between the gene of interest and the β2-microglobulin reference gene. GAPDH normalized data gave comparable results (data not shown). Relative expression in the human tumor samples compared with distal normal colon tissue (calibrator) was calculated according to the method of Fold Change (2^-(DeltaDelta CT)). β-actin and RNA18S5 normalized data gave comparable results.
Statistical calculations were performed with Prism 3.0 software (GraphPad Software). Student’s unpaired t-test was used to analyse the qPCR results. The data were considered to be significant at p < 0.001.
Histopathological analysis and immunohistochemistry
Both murine and human FFPE sections were stained using hematoxylin (H) and eosin (E) according to standard histochemical procedures. Mouse colonic mucosa lesions (Aberrant Crypt Foci - ACF, microadenoma, adenoma, adenocarcinoma) were diagnosed according to the histopathological criteria described by Boivin et al [69]. Immunohistochemistry was performed on 4-μm-thick FFPE tissue sections after antigen retrieval in sodium citrate buffer (10 mM sodium citrate, pH 6), for 40 minutes at 95°C. The samples were incubated with rabbit anti-human/mouse Notum (ThermoFisher Scientific Inc, IL, USA, 1:300); goat anti- human/mouse Glypican 1 (Santa Cruz Biotechnology, Santa Cruz, CA, USA, 1:50), rat anti-mouse Glypican 3 (Novus Biologicals, LLC, Littleton, CO, USA, 1:50); rat anti-human Glypican 3 (ThermoFisher Scientific Inc, IL, USA, 1:100) or rabbit anti-mouse β-catenin (Santa Cruz Biotechnology, Santa Cruz, CA, 1:100) antibodies overnight at 4°C, followed by biotin-labelled secondary antibody and HRP-conjugated avidin for 30 minutes at room temperature. Detection was achieved using a substrate/chromogen mixture (DAB) and hematoxylin counterstaining. Incubation with the primary antibody was omitted for the negative controls. The immunostained slides were observed under a microscope, and the image data were analysed using NIS FreeWare 2.10 software (Nikon, Japan). A semi-quantitative intensity scale ranging from (−) for 10–20% immunopositive cells (low staining) to (+) for 40–60% immunopositive cells (medium staining) and (++) 80–100% immunopositive cells for intense staining was adopted.
ACKNOWLEDGMENTS AND FUNDING
The authors thank S. Morini and S. Carotti from CIR, the University Campus Bio-Medico of Rome for providing the instrumental equipment for tissue sectioning, as well as Dr Dale Lawson for the English revision of the manuscript.
This work was supported by grants from the Italian association for cancer research (IG 11675 to FC), the University of Torino and Compagnia di San Paolo (EU accelerating grant TO_call02_2012_0026 to FC), Filas Regione Lazio (Prot Filas-DB-2008-1077 to ES), and Medical University of Plovdiv (HO-2/2013 to YF and VS).
CONFLICTS OF INTEREST
The authors declare no competing financial interests.
REFERENCES
1. American Cancer Society. Cancer Facts & Figures 2014. Atlanta: American Cancer Society. 2014.
2. Fearon ER. Molecular genetics of colorectal cancer. Annu Rev Pathol. 2011; 6:479–507.
3. Serafino A, Moroni N, Zonfrillo M, Andreola F, Mercuri L, Nicotera G, Nunziata J, Ricci R, Antinori A, Rasi G, Pierimarchi P. WNT-pathway components as predictive markers useful for diagnosis, prevention and therapy in inflammatory bowel disease and sporadic colorectal cancer. Oncotarget. 2014; 5:978–992.
4. Kakugawa S, Langton PF, Zebisch M, Howell SA, Chang TH, Liu Y, Feizi T, Bineva G, O’Reilly N, Snijders AP, Jones EY, Vincent JP. Notum deacylates Wnt proteins to suppress signaling activity. Nature. 2015; 519:187–192.
5. Lin X. Functions of heparan sulfate proteoglycans in cell signaling during development. Development. 2004; 131:6009–6021.
6. Triantafillidis JK, Nasioulas G, Kosmidis PA. Colorectal Cancer and Inflammatory Bowel Disease: Epidemiology, Risk Factors, Mechanisms of Carcinogenesis and Prevention Strategies. Anticancer Res. 2009; 29:2727–2737.
7. Tanaka T. Colorectal carcinogenesis: Review of human and experimental animal studies. J Carcinog. 2009; 8:5.
8. Tanaka T, Kohno H, Suzuki R, Yamada Y, Sugie S, Mori H. A novel inflammation-related mouse colon carcinogenesis model induced by azoxymethane and dextran sodium sulfate. Cancer Sci. 2003; 94:965–973.
9. De Robertis M, Massi E, Poeta ML, Carotti S, Morini S, Cecchetelli L, Signori E, Fazio VM. The AOM/DSS murine model for the study of colon carcinogenesis: From pathways to diagnosis and therapy studies. J Carcinog. 2011; 10:9.
10. De Robertis M, Fazio VM, Signori E. Animal Models in Cancer Research and Human Disease: Applications, Outcomes and Controversies. Murine models of sporadic and inflammation-related colon carcinogenesis with particular focus on the AOM/DSS chemically induced colorectal cancer model. Murray S.A. USA: Nova Science Publishers, Inc. 2013.
11. Schütz E, Akbari MR, Beck J, Urnovitz H, Zhang WW, Bornemann-Kolatzki K, Mitchell WM, Nam RK, Narod SA. Chromosomal instability in cell-free DNA is a serum biomarker for prostate cancer. Clin Chem. 2015; 61:239–248.
12. Jiang P, Chan CW, Chan KC, Cheng SH, Wong J, Wong VW, Wong GL, Chan SL, Mok TS, Chan HL, Lai PB, Chiu RW, Lo YM. Lengthening and shortening of plasma DNA in hepatocellular carcinoma patients. Proc Natl Acad Sci U S A. 2015; 112:E1317–E1325.
13. Traister A, Shi W, Filmus J. Mammalian Notum induces the release of glypicans and other GPI-anchored proteins from the cell surface. Biochem J. 2008; 410:503–511.
14. Nusse R. Cell signaling: Disarming Wnt. Nature. 2015; 519:163–164.
15. Droin N, Hendra JB, Ducoroy P, Solary E. Human defensins as cancer biomarkers and antitumor molecules. J Proteomics. 2009; 72:918–927.
16. Jho EH, Zhang T, Domon C, Joo CK, Freund JN, Costantini F. Wnt/beta-catenin/Tcf signaling induces the transcription of Axin2, a negative regulator of the signaling pathway. Mol Cell Biol. 2002; 22:1172–1183.
17. Birkenkamp-Demtroder K, Mansilla F, Sørensen FB, Kruhøffer M, Cabezón T, Christensen LL, Aaltonen LA, Verspaget HW, Ørntoft TF. Phosphoprotein Keratin 23 accumulates in MSS but not MSI colon cancers in vivo and impacts viability and proliferation in vitro. Mol Oncol. 2007; 1:181–195.
18. Glenister R, McDaniel K, Francis H, Venter J, Jensen K, Dusio G, Gaudio E, Glaser S, Meng F, Alpini G. Therapeutic actions of melatonin on gastrointestinal cancer development and progression. Transl Gastrointest Cancer. 2013; 2:11–20.
19. Hlavata I, Mohelnikova-Duchonova B, Vaclavikova R, Liska V, Pitule P, Novak P, Bruha J, Vycital O, Holubec L, Treska V, Vodicka P, Soucek P. The role of ABC transporters in progression and clinical outcome of colorectal cancer. Mutagenesis. 2012; 27:187–196.
20. Edalat M, Mannervik B, Axelsson LG. Selective expression of detoxifying glutathione transferases in mouse colon: effect of experimental colitis and the presence of bacteria. Histochem. Cell Biol. 2004; 122:151–159.
21. Plewka D, Plewka A, Szczepanik T, Morek M, Bogunia E, Wittek P, Kijonka C. Expression of selected cytochrome P450 isoforms and of cooperating enzymes in colorectal tissues in selected pathological conditions. Pathol Res Pract. 2014; 210:242–249.
22. Van der Flier LG, Sabates-Bellver J, Oving I, Haegebarth A, De Palo M, Anti M, Van Gijn ME, Suijkerbuijk S, Van de Wetering M, Marra G, Clevers H. The Intestinal Wnt/TCF Signature. Gastroenterology. 2007; 132:628–632.
23. Flowers GP, Topczewska JM, Topczewski J. A zebrafish Notum homolog specifically blocks the Wnt/β-catenin signaling pathway. Development. 2012; 139:2416–2425.
24. Wirtz S, Neufert C, Weigmann B, Neurath MF. Chemically induced mouse models of intestinal inflammation. Nat Protoc. 2007; 2:541–546.
25. Grivennikov SI. Inflammation and colorectal cancer: colitis-associated neoplasia. Semin Immunopathol. 2013; 35:229–244.
26. Kim ER, Chang DK. Colorectal cancer in inflammatory bowel disease: the risk, pathogenesis, prevention and diagnosis. World J Gastroenterol. 2014; 20:9872–9881.
27. Li X, Gao Y, Yang M, Zhao Q, Wang G, Yang YM, Yang Y, Liu H, Zhang Y. Identification of gene expression changes from colitis to CRC in the mouse CAC model. PLoS One. 2014; 9:e95347.
28. Neufert C, Becker C, Neurath MF. An inducible mouse model of colon carcinogenesis for the analysis of sporadic and inflammation-driven tumor progression. Nat Protoc. 2007; 2:1998–2004.
29. Pikarsky E, Porat RM, Stein I, Abramovitch R, Amit S, Kasem S, Gutkovich-Pyest E, Urieli-Shoval S, Galun E, Ben-Neriah Y. NF-kappaB functions as a tumour promoter in inflammation-associated cancer. Nature. 2004; 431:461–466.
30. Nielsen OH, Vainer B, Madsen SM, Seidelin JB, Heegaard NH. Established and emerging biological activity markers of inflammatory bowel disease. Am J Gastroenterol. 2000; 95:359–367.
31. Giordano TJ, Shedden KA, Schwartz DR, Kuick R, Taylor JM, Lee N, Misek DE, Greenson JK, Kardia SL, Beer DG, Rennert G, Cho KR, Gruber SB, et al. Organ-specific molecular classification of primary lung, colon, and ovarian adenocarcinomas using gene expression profiles. Am J Pathol. 2001; 159:1231–1238.
32. Notterman DA, Alon U, Sierk AJ, Levine AJ. Transcriptional gene expression profiles of colorectal adenoma, adenocarcinoma, and normal tissue examined by oligonucleotide arrays. Cancer Res. 2001; 61:3124–3130.
33. Buckhaults P, Rago C, St Croix B, Romans KE, Saha S, Zhang L, Vogelstein B, Kinzler KW. Secreted and cell surface genes expressed in benign and malignant colorectal tumors. Cancer Res. 2001; 61:6996–7001.
34. Guezguez A, Paré F, Benoit YD, Basora N, Beaulieu JF. Modulation of stemness in a human normal intestinal epithelial crypt cell line by activation of the WNT signaling pathway. Exp Cell Res. 2014; 322:355–364.
35. Tu S, Bhagat G, Cui G, Takaishi S, Kurt-Jones EA, Rickman B, Betz KS, Penz-Oesterreicher M, Bjorkdahl O, Fox JG, Wang TC. Overexpression of interleukin-1ß induces gastric inflammation and cancer and mobilizes myeloid-derived suppressor cells in mice. Cancer Cell. 2008; 14:408–419.
36. Li Y, Wang L, Pappan L, Galliher-Beckley A, Shi J. IL-1β promotes stemness and invasiveness of colon cancer cells through Zeb1 activation. Mol Cancer. 2012; 11:87.
37. Logan CY, Nusse R. The Wnt signaling pathway in development and disease. Annu Rev Cell Dev Biol. 2004; 20:781–810.
38. Chamorro MN, Schwartz DR, Vonica A, Brivanlou AH, Cho KR, Varmus HE. FGF-20 and DKK1 are transcriptional targets of beta-catenin and FGF-20 is implicated in cancer and development. EMBO J. 2005; 24:73–84.
39. Kazanskaya O, Glinka A, del Barco Barrantes I, Stannek P, Niehrs C, Wu W. R-Spondin2 is a secreted activator of Wnt/beta-catenin signaling and is required for Xenopus myogenesis. Dev Cell. 2004; 7:525–534.
40. Khan Z, Vijayakumar S, de la Torre TV, Rotolo S, Bafico A. Analysis of endogenous LRP6 function reveals a novel feedback mechanism by which Wnt negatively regulates its receptor. Mol Cell Biol. 2007; 27:7291–7301.
41. Arce L, Yokoyama NN, Waterman ML. Diversity of LEF/TCF action in development and disease. Oncogene. 2006; 25:7492–7504.
42. Ma B, van Blitterswijk CA, Karperien M. A Wnt/β-catenin negative feedback loop inhibits interleukin-1-induced matrix metalloproteinase expression in human articular chondrocytes. Arthritis Rheum. 2012; 64:2589–2600.
43. Hoppler S, Kavanagh CL. Wnt signaling: variety at the core. J Cell Sci. 2007; 120:385–393.
44. Torisu Y, Watanabe A, Nonaka A, Midorikawa Y, Makuuchi M, Shimamura T, Sugimura H, Niida A, Akiyama T, Iwanari H, Kodama T, Zeniya M, Aburatani H. Human homolog of NOTUM, overexpressed in hepatocellular carcinoma, is regulated transcriptionally by beta-catenin/TCF. Cancer Sci. 2008; 99:1139–1146.
45. Filmus J, Capurro M, Rast J. Glypicans. Genome Biol. 2008; 9:224.
46. Capurro M, Martin T, Shi W, Filmus J. Glypican-3 binds to Frizzled and plays a direct role in the stimulation of canonical Wnt signaling. J Cell Sci. 2014; 127:1565–1575.
47. Cano-Gauci DF, Song HH, Yang H, McKerlie C, Choo B, Shi W, Pullano R, Piscione TD, Grisaru S, Soon S, Sedlackova L, Tanswell AK, Mak TW, et al. Glypican-3-deficient Mice Exhibit Developmental Overgrowth and Some of the Abnormalities Typical of Simpson-Golabi-Behmel Syndrome. J Cell Biol. 1999; 146:255–264.
48. Lin H, Huber R, Schlessinger D, Morin PJ. Frequent silencing of the GPC3 gene in ovarian cancer cell lines. Cancer Res. 1999; 59:807–810.
49. Murthy SS, Shen T, De Rienzo A, Lee WC, Ferriola PC, Jhanwar SC, Mossman BT, Filmus J, Testa JR. Expression of GPC3, an X-linked recessive overgrowth gene, is silenced in malignant mesothelioma. Oncogene. 2000; 19:410–416.
50. Hsu HC, Cheng W, Lai PL. Cloning and Expression of a Developmentally Regulated Transcript MXR7 in hepatocellular carcinoma: biological significance and temporospatial distribution. Cancer Res. 1997; 57:5179–5184.
51. Phillips JJ. Novel Therapeutic Targets in the Brain Tumor Microenvironment. Oncotarget. 2012; 3:568–575.
52. Man XB, Tang L, Zhang BH, Li SJ, Qiu XH, Wu MC, Wang HY. Upregulation of Glypican-3 expression in hepatocellular carcinoma but downregulation in cholangiocarcinoma indicates its differential diagnosis value in primary liver cancers. Liver Int. 2005; 25:962–6.
53. Xiang YY, Ladeda V, Filmus J. Glypican-3 expression is silenced in human breast cancer. Oncogene. 2001; 20:7408–7412.
54. Maurel M, Jalvy S, Ladeiro Y, Combe C, Vachet L, Sagliocco F, Bioulac-Sage P, Pitard V, Jacquemin-Sablon H, Zucman-Rossi J, Laloo B, Grosset CF. A functional screening identifies five microRNAs controlling glypican-3: role of miR-1271 down-regulation in hepatocellular carcinoma. Hepatology. 2013; 57:195–204.
55. Matsuda K, Maruyama H, Guo F, Kleeff J, Itakura J, Matsumoto Y, Lander AD, Korc M. Glypican-1 is overexpressed in human breast cancer and modulates the mitogenic effects of multiple heparin-binding growth factors in breast cancer cells. Cancer Res. 2001; 61:5562–5569.
56. García-Suárez O, García B, Fernández-Vega I, Astudillo A, Quirós LM. Neuroendocrine tumors show altered expression of chondroitin sulfate, glypican 1, glypican 5, and syndecan 2 depending on their differentiation grade. Front Oncol. 2014; 4:15.
57. Yasuda E, Kumada T, Toyoda H, Kaneoka Y, Maeda A, Okuda S, Yoshimi N, Kozawa O. Evaluation for clinical utility of GPC3, measured by a commercially available ELISA kit with Glypican-3 (GPC3) antibody, as a serological and histological marker for hepatocellular carcinoma. Hepatol Res. 2010; 40:477–485.
58. Whipple CA, Young AL, Korc M. A KrasG12D-driven genetic mouse model of pancreatic cancer requires glypican-1 for efficient proliferation and angiogenesis. Oncogene. 2012; 31:2535–2544.
59. Melo SA, Luecke LB, Kahlert C, Fernandez AF, Gammon ST, Kaye J, LeBleu VS, Mittendorf EA, Weitz J, Rahbari N, Reissfelder C, Pilarsky C, Fraga MF, et al. Glypican-1 identifies cancer exosomes and detects early pancreatic cancer. Nature. 2015; 523:177–182.
60. Capurro MI, Xiang YY, Lobe C, Filmus J. Glypican-3 promotes the growth of hepatocellular carcinoma by stimulating canonical Wnt signaling. Cancer Res. 2005; 65:6245–6254.
61. De Cat B, Muyldermans SY, Coomans C, Degeest G, Vanderschueren B, Creemers J, Biemar F, Peers B, David G. Processing by proprotein convertases is required for glypican-3 modulation of cell survival, Wnt signaling, and gastrulation movements. J Cell Biol. 2003; 163:625–635.
62. Lum L, Yao S, Mozer B, Rovescalli A, Von Kessler D, Nirenberg M, Beachy PA. Identification of hedgehog pathway components by RNAi in Drosophila cultured cells. Science. 2003; 299:2039–2045.
63. Paine-Saunders S, Viviano BL, Zupicich J, Skarnes WC, Saunders S. Glypican-3 controls cellular responses to Bmp4 in limb patterning and skeletal development. Dev Biol. 2000; 225:179–187.
64. Song HH, Shi W, Xiang YY, Filmus J. The loss of glypican-3 induces alterations in Wnt signaling. J Biol Chem. 2005; 280:2116–2125.
65. Sanges R, Cordero F, Calogero RA. oneChannelGUI: a graphical interface to Bioconductor tools, designed for life scientists who are not familiar with R language. Bioinformatics. 2007; 23:3406–3408.
66. Gentleman RC, Carey VJ, Bates DM, Bolstad B, Dettling M, Dudoit S, Ellis B, Gautier L, Ge Y, Gentry J, Hornik K, Hothorn T, Huber W, et al. Bioconductor: open software development for computational biology and bioinformatics. Genome Biol. 2004; 5:R80.
67. Bolstad BM, Irizarry RA, Astrand M, Speed TP. A comparison of normalization methods for high density oligonucleotide array data based on variance and bias. Bioinformatics. 2003; 19:185–193.
68. Von Heydebreck A, Huber W, Gentleman R. Differential expression with the Bioconductor Project. Collection Biostat Res Arch Working Paper 7; http://biostats.bepress.com/bioconductor/paper7. 2004.
69. Boivin GP, Washington K, Yang K, Ward JM, Pretlow TP, Russell R, Besselsen DG, Godfrey VL, Doetschman T, Dove WF, Pitot HC, Halberg RB, Itzkowitz SH, et al. Pathology of mouse models of intestinal cancer: consensus report and recommendations. Gastroenterology. 2003; 124:762–777.