
INTRODUCTION
MicroRNAs (miRNAs) are non-protein-coding small RNAs, 19–25 nucleotides (nt) in length, that are cleaved from 70–100 nt hairpin pre-miRNA precursors [1]. miRNAs negatively regulate gene expression primarily by binding to the 3′ untranslated regions (3′UTR) of their target messenger RNAs (mRNAs), leading to translational repression or mRNA cleavage [2]. Recent studies revealed that miRNAs regulate the expression of a wide variety of target genes, and are thus involved in a wide range of biological processes including cell proliferation, differentiation, and apoptosis [3–5]. In addition to their physiological functions, the wide-ranging biological effects of miRNAs can be also involved in cancer development [6, 7].
Nasopharyngeal carcinoma (NPC) is a rare disease in most parts of the world [8], but in Southern China and Southeast Asia it is one of the most prevalent malignant tumors and the leading cause of death among all head and neck cancers. Furthermore, this malignancy tends to be diagnosed at an advanced stage, and consequently has a poor prognosis. Currently, there is no reliable biomarker for early detection of NPC, and the underlying molecular mechanisms are poorly understood, making it difficult to develop effective therapeutic strategies. NPC is a complex disease resulting from a multi-step process of carcinogenesis that involves interactions among chronic Epstein-Barr virus (EBV) infection, environmental factors, genetic mutation, and epigenetic changes [9, 10]. Previously, in a study aimed at characterizing the epigenetic changes in NPC, we identified several candidate genes whose promoters are aberrantly methylated during NPC carcinogenesis [11–13]. However, it is necessary to thoroughly elucidate epigenetic mechanisms, including miRNAs, as well as DNA methylation. NPC is typically diagnosed at advanced stages; therefore, it is desirable to identify novel biomarkers including circulating miRNAs as clinical tools, and clarifying the mechanisms of carcinogenesis can facilitate the development of therapeutic targets.
In order to investigate the role of miRNAs in NPC pathogenesis, we performed microRNA profiling and quantitative RT-PCR to evaluate the expression levels of candidate miRNAs in a set of NPC primary tumor biopsies and plasma. The results of these analyses revealed concordant down-regulation of miR-497 in tissues and plasma. Using the TargetScan algorithm, we identified two genes, ANLN (anillin, actin-binding protein) and HSPA4L (heat shock 70 kDa protein 4–like) as potential targets of miR-497. Quantitative RT-PCR and immunohistochemical analyses confirmed that ANLN and HSPA4L were overexpressed in NPC tissues relative to NNE tissues. Transfection of a miR-497 mimic or small interfering RNAs (siRNAs) against ANLN and HSPA4L inhibited cancer phenotypes in NPC cells. Our findings suggest that miR-497 acts as a tumor suppressor by targeting ANLN and HSPA4L in NPC.
RESULTS
Identification of miRNAs differentially expressed in NPC tissues
We performed miRNA microarray analysis of clinical samples of seven NPC patients and five patients without cancer. Thirty-six EBV-related miRNAs were overexpressed in NPC, and we chose the top three miRNAs (Table 1A) as candidates for further studies. In addition, we selected the top four miRNAs among the 11 up-regulated human miRNAs, and the top eight miRNAs among the 66 down-regulated human miRNAs (Table 1B).
Table 1: Candidate miRNAs analyzed by miRNA microarray
miRNA name |
mirbase accession No. |
Fold change of NPC compared with NNE (log2) |
P-value |
|---|---|---|---|
(A) Epstein-Barr virus-related miRNAs |
|||
ebv-miR-BART22 |
MIMAT0010132 |
13.57 |
1.70E-09 |
ebv-miR-BART1-3p |
MIMAT0003390 |
13.16 |
5.29E-09 |
ebv-miR-BART9 |
MIMAT0003419 |
13.12 |
2.99E-09 |
(B) Human miRNAs |
|||
1) Up-regulated miRNAs |
|||
hsa-miR-205 |
MIMAT0000266 |
2.57 |
2.47E-05 |
hsa-miR-182 |
MIMAT0000259 |
1.70 |
0.00134 |
hsa-miR-135b |
MIMAT0000758 |
1.46 |
0.01364 |
hsa-miR-455-3p |
MIMAT0004784 |
1.26 |
0.04598 |
2) Down-regulated miRNAs |
|||
hsa-miR-145 |
MIMAT0000437 |
−2.81 |
0.00407 |
hsa-miR-497 |
MIMAT0002820 |
−2.51 |
0.00107 |
hsa-miR-150 |
MIMAT0000451 |
−2.42 |
0.01117 |
hsa-miR-195 |
MIMAT0000461 |
−2.27 |
0.00076 |
hsa-miR-342-5p |
MIMAT0004694 |
−2.25 |
0.00939 |
hsa-miR-143 |
MIMAT0000435 |
−2.22 |
0.00311 |
hsa-miR-34b* |
MIMAT0000685 |
−2.20 |
0.04503 |
hsa-miR-100 |
MIMAT0000098 |
−2.10 |
0.00063 |
To confirm the candidate dysregulated miRNAs identified by miRNA microarray analysis, we performed quantitative RT-PCR on 18 NPC and 11 NNE tissue samples. All three of the selected ebv-miR-BARTs (BamHI A Rightward Transcripts; ebv-miR-BART22, ebv-miR-BART1-3p, and ebv-miR-BART9) were more highly expressed in NPC tissues than in NNE (Fig. 1A). In addition, ΔCt values clearly distinguished between NPC (always <10) and NNE (always >10) (Fig. 1B). The quantitative RT-PCR analysis confirmed that all four of the selected up-regulated hsa (Homo sapiens)-miRNAs (miR-205, miR-182, miR-135b, and miR-455-3p) were significantly up-regulated in NPC tissues (Fig. 1C). We confirmed that six of the eight selected down-regulated hsa-miRNAs (miR-145, miR-497, miR-150, miR-342-5p, miR-34b* and miR-100) were significantly down-regulated in NPC tissues, whereas miR-195 and miR-143 exhibited no significant difference between the two groups of subjects (Fig. 1D).
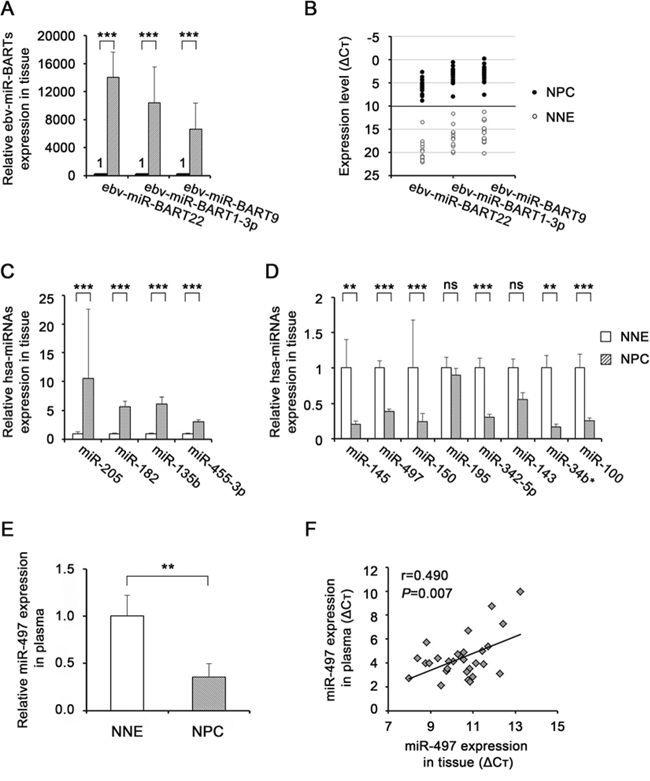
Figure 1: miRNA expression levels in nasopharyngeal tissues and plasma. miRNA expression levels of ebv-miR-BARTs (A, B) and human miRNAs (C, D) were determined by quantitative RT-PCR in NNE tissues (n = 11) and primary NPC tissues (n = 18) normalized against the corresponding levels of RNU6B. The relative quantity in NNE was defined as 1 (A, C, D). B. Graph shows ebv-miR-BARTs data in ΔCt scale (open circle: NNE, closed circle: NPC). E. miR-497 expression levels were determined by quantitative RT-PCR in plasma of the same patients mentioned above. The levels were normalized using the average of five reference miRNAs, and the relative quantity in NNE was defined as 1. P-values of differences between NPC and NNE were calculated using Student’s t-test (**P < 0.01, ***P < 0.001). F. Pearson correlation of miR-497 expression (expressed on the ΔCt scale) between tissues and plasma.
Circulating miR-497 is significantly down-regulated in plasma of NPC
We also measured the levels of miRNAs in plasma of NPC patients and noncancerous controls by quantitative RT-PCR. The five reference miRNAs exhibited no significant difference in plasma levels between NNE and NPC (Supplementary Fig. 1). One of the the 13 dysregulated miRNAs detected in tissues, miR-497, was present at significantly lower levels in NPC plasma than in noncancerous control plasma (P < 0.01, Fig. 1E), whereas the levels of other miRNAs were not significantly altered (Table S1). Expression of miR-497 was significantly correlated between tissues and plasma (Fig. 1F, Pearson correlation coefficient; r = 0.490, P = 0.007), whereas the other miRNAs exhibited no significant correlation (Table S1). Thus, miR-497 was concordantly down-regulated in tissues and plasma, suggesting that it would could be useful as a biomarker for NPC. Therefore, we focused on miR-497 in our subsequent exploration of miRNA functions in NPC.
Exogenous miR-497 suppresses cell proliferation and migration, and induces apoptosis, in NPC cell lines
Prior to our in vitro functional analyses, we confirmed by quantitative RT-PCR that miR-497 was down-regulated in NPC cell lines, as it is in NPC tissues relative to NNE tissues (Supplementary Fig. 2A). To investigate the biological function of miR-497 down-regulation in NPC, we assessed the effect of exogenously administered miRNA on cell proliferation using the MTT assay. Specifically, we transfected miR-497 mimic and negative control into NPC cell lines, and confirmed the expression level at the indicated time points (Supplementary Fig. 2B-2D). Compared to the negative control, miR-497 mimic significantly inhibited growth of HK1/EBV, HK1, and CNE1 cells (Fig. 2A, left, middle, right, respectively), suggesting that miR-497 has a tumor-suppressive function.
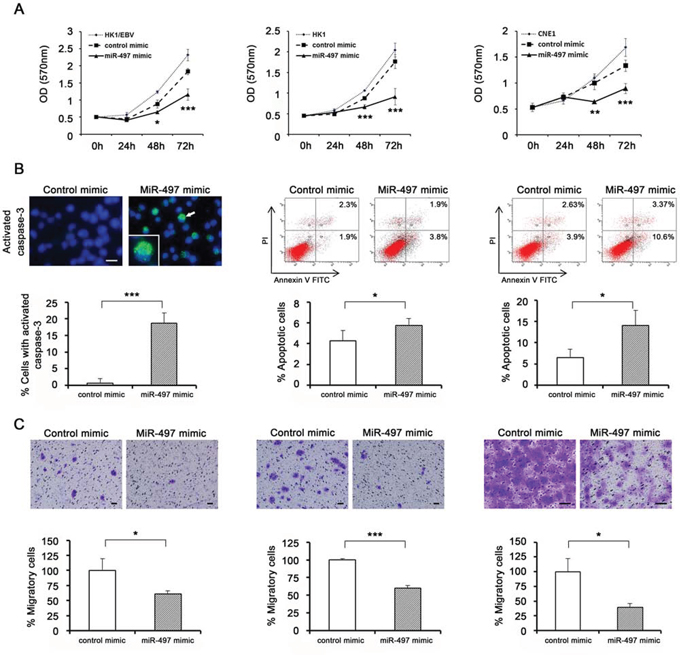
Figure 2: Functional analyses using transfection of exogenous miRNA. A. Cell proliferation was determined by MTT assay every 24 h for 72 h after transfection of HK1/EBV, HK1, and CNE1 cells with miRNA mimic (n = 5). B. Apoptotic cells were detected by immunocytochemical staining (left) and flow cytometry (middle and right). miR-497 mimic induced activation of caspase-3 protein, which exhibited cytoplasmic localization (an arrow and the enlarged). HK1/EBV cells were stained with DAPI and photographed under a fluorescence microscope after transfection (n = 4). HK1 and CNE1 cells were transfected with control or miR-497 mimic, and then stained with annexin V-FITC and PI and subjected to flow cytometry (n = 3). C. Cell migration in NPC cells transfected with miR-497 mimic. HK1/EBV (left), HK1 (middle), and CNE1 (right) cells were transfected with control or miR-497 mimic, and then cultured for 72 h. After transfection, harvested cells were seeded in a migration chamber and cultured for 24 h. Migratory cells were stained, photographed under a microscope, and quantitatively analyzed (n = 3). Data are shown as means ± standard deviation. P-values were calculated using Student’s t-test (*P < 0.05, ***P < 0.001) compared with control mimic. Scale bar represents 50 μm.
Caspase-3, which is activated in apoptotic cells, was observed in the cytoplasm of HK1/EBV cells transfected with miR-497 mimic, but not in cells transfected with control mimic. Furthermore, the percentage of cells with activated caspase-3 was significantly higher in miR-497 mimic–transfected cells (Fig. 2B, left). The degree of early apoptosis was determined based on the percentage of the annexin V-FITC-positive and PI-negative cells, and late apoptosis was determined based on the percentage of the annexin V-FITC-positive and PI-positive cells. The overall apoptosis rate was the sum of the early- and late-apoptotic subpopulations. In HK1 (Fig. 2B, middle) and CNE1 cells (Fig. 2B, right) transfected with miR-497 mimic, the apoptosis rate was significantly higher than in cells transfected with control mimic, suggesting the involvement of miR-497 in inducing apoptosis in NPC cells.
In addition, we carried out cell migration assays using NPC cell lines 72 h after transfection with miR-497 or control mimic. The assay kit contained a polycarbonate membrane insert (pore size, 8 μm) in each well, which served as a barrier to discriminate migratory from non-migratory cells. Migratory cells were observed less frequently among NPC cells transfected with miR-497 mimic than among those transfected with control mimic (Fig. 2C).
MiR-497 inhibited tumor growth in vivo
To examine the role of miR-497 in NPC development, we performed a xenograft study in which miR-497 mimic– or control mimic–transfected HK1 and HONE1 cells were transplanted into the flanks of BALB/c athymic nu/nu mice. Subcutaneous tumor growth of miR-497 mimic–transfected cells was slower than that of control mimic–transfected cells, and tumor volumes were significantly smaller until day 14 (HK1: Fig. 3A inset, HONE1: Fig. 3D). Because tumor growth of HK1 cells was relatively slow, we continued the observation after day 14, but thereafter there was no significant difference in the volumes of HK1 xenografts (Fig. 3A) or tumor weight at sacrifice (day 26: miR-497 mimic, 30.0 ± 19.0 mg vs. control mimic, 52.0 ± 44.1 mg; P = 0.395), as shown in Fig. 3B. By contrast, tumor xenografts of HONE 1 cells grew rapidly, and mice were sacrificed for evaluation of tumor formation 13 days after inoculation (Fig. 3C). The tumor weight of HONE1 xenografts was significantly lower in the miR-497 mimic tumors than in the control mimic tumors (322.8 ± 94.5 mg vs. 457.9 ± 95.4 mg, P = 0.02, Fig. 3E). In addition, we confirmed that miR-497 was expressed at significantly higher levels in the miR-497 mimic tumors at day 13 (Supplementary Fig. 2E). The tumor xenograft experiment indicated that miR-497 plays a role in suppressing NPC tumorigenicity.
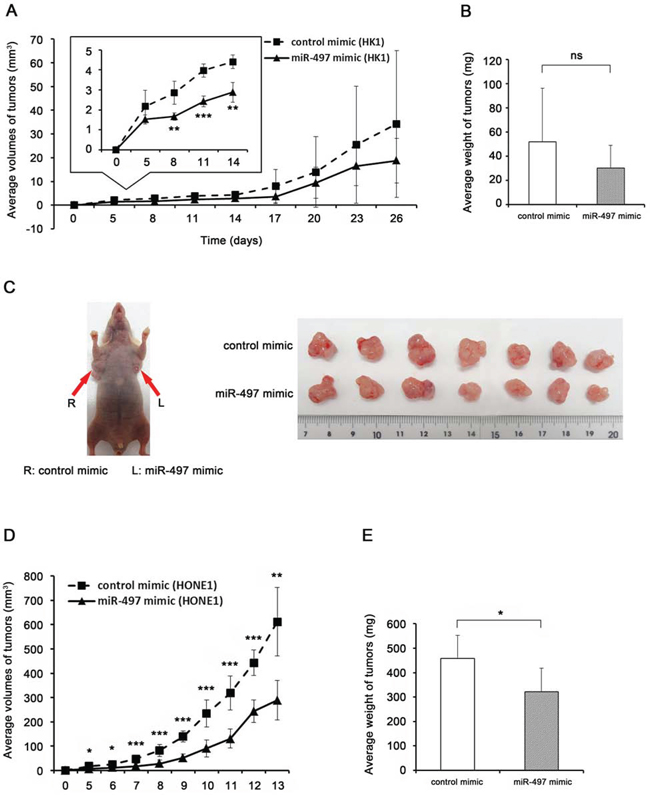
Figure 3: miR-497 inhibits NPC tumor growth in vivo. A, D. Growth curve drawn by measuring tumor volumes at the indicated times (A inset: enlarged view of growth curve). B, E. Weight of xenograft tumors. Data are shown as means ± standard deviation (B: n = 4, E: n = 7). C. Image of subcutaneous xenografts in the mouse flanks (the arrows indicate the presence of tumors in mouse injected with control mimic–transfected cells (R) and miR-497 mimic–transfected cells (L)) and excised tumors. P-values of differences between miR-497 and control tumors were calculated using the Student’s t-test (*P < 0.05, **P < 0.01, ***P < 0.001; ns, no significant difference).
Up-regulation of target genes ANLN and HSPA4L in NPC tissues
To search for target genes of miR-497, we used TargetScan Human (Release 6.2: June 2012, http://www.targetscan.org/vert_61/). Of 1273 conserved predicted target genes, 44 were on the list of genes that were up-regulated (>2-fold, P < 0.05) in NPC vs NNE tissues, as determined by mRNA microarray experiments. Based on a literature survey, we focused our attention on ANLN (anillin, actin-binding protein) and HSPA4L (heat shock 70 kDa protein 4–like) because these two genes are up-regulated in many cancers [14–18].
We measured expression levels of ANLN and HSPA4L in NPC and NNE tissues using quantitative RT-PCR and protein levels by immunohistochemistry (IHC). As shown in Fig. 4A, mRNA levels of ANLN and HSPA4L was significantly higher in NPC tissues than in NNE tissues. IHC analyses revealed up-regulation of both proteins in NPC. By contrast, in NNE tissues, little or no immunoreactivity of ANLN was observed (Fig. 4B, left upper), and HSPA4L-expressing cells were scarce (Fig. 4B, right upper). In primary NPC tissues, ANLN was expressed in the cytoplasm of NPC tumor cells (Fig. 4B, left lower), whereas HSPA4L was strongly expressed in the nucleus and cytoplasm of NPC cells and mucosa adjacent to NPC nests (Fig. 4B, right lower). IHC scores of both proteins were significantly higher in NPC than in NNE (P = 0.003 and P = 0.002, respectively, Fig. 4C).
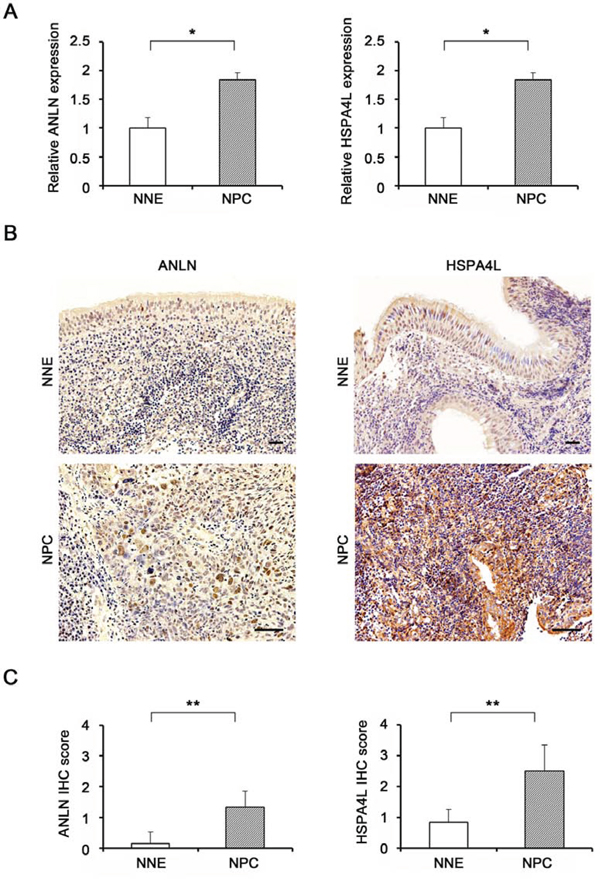
Figure 4: Target gene expression levels in NPC tissues. A. mRNA expression levels of ANLN (left) and HSPA4L (right) in NNE tissues (n = 11) and primary NPC tissues (n = 18), determined by quantitative RT-PCR. Expression levels of target genes (ANLN and HSPA4L) were normalized against the corresponding levels of GAPDH. P-values were calculated using Student’s t-test (*P < 0.05). B. Formalin-fixed and paraffin-embedded biopsies of nasopharyngeal tissues were obtained from patients with chronic nasopharyngitis (NNE) or NPC. Expression of ANLN (left) and HSPA4L (right) was assessed by immunoperoxidase staining (brown). Original magnifications are 100× and 200 ×. Scale bar represents 50 μm. C. Graphs represent average and SD of IHC scores for NNE (n = 6) and NPC tissues (n = 6). P-values of differences between NPC and NNE tissues were calculated using the Mann–Whitney U test (**P < 0.01).
Significant down-regulation of ANLN and HSPA4L in NPC cells by exogenous miR-497
Expression levels of miR-497 were significantly higher in NPC cells treated with miR-497 mimic for 72 h than in cells treated with the control mimic, although the levels of miR-497 gradually decreased after mimic transfection (Supplementary Fig. 2B–2D). Exogenous miR-497 significantly down-regulated the mRNA levels of ANLN (Fig. 5A, left) and HSPA4L (Fig. 5A, right), indicating that miR-497 can regulate the expression of these genes in NPC cells. Additionally, immunocytochemistry (ICC) analyses revealed that protein levels of ANLN (Fig. 5B, left) and HSPA4L (Fig. 5B, right) were significantly decreased by transfection with miR-497 mimic.
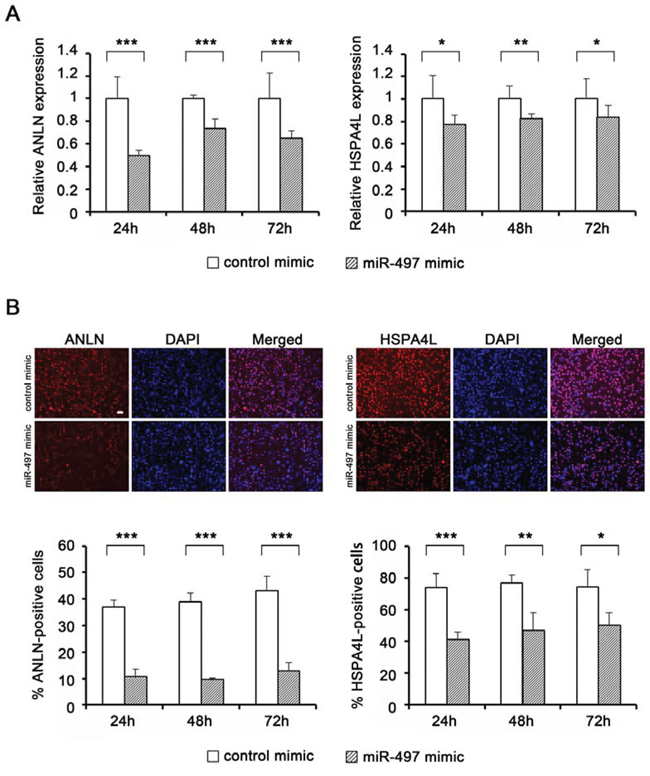
Figure 5: Target gene expression levels in NPC cells following transfection with miR-497 mimic. A. Expression levels of ANLN (left) and HSPA4L (right) in HK1 cells (n = 4) after transfection with miR-497 mimic. Expression levels of target genes (ANLN and HSPA4L) were determined by quantitative RT-PCR and normalized against the corresponding levels of GAPDH. B. Protein expression levels of ANLN (left) and HSPA4L (right) in HK1/EBV cells, determined by ICC. Scale bar represents 50 μm. Numbers of positively staining cells and total cell number (determined by DAPI staining of nuclei) were analyzed using the ImageJ software, and the percentage of positively stained cells was calculated for each sample (n = 4) in three areas. P-values were calculated using the Student’s t-test (*P < 0.05, **P < 0.01, ***P < 0.001).
Reduction of ANLN and HSPA4L potentially contributes to suppression of cell proliferation and migration, and induction of apoptosis, in NPC cells
Quantitative RT-PCR confirmed that expression levels of ANLN and HSPA4L were significantly down-regulated in CNE1 cells after transfection of the corresponding siRNAs (relative quantities: ANLN, 0.51, P < 0.05; HSPA4L, 0.31, P < 0.05, respectively). To investigate the possible oncogenic function of ANLN and HSPA4L, we examined cell proliferation in siRNA-treated CNE1 cells for 96 h. Specific siRNA–transfected cells grew significantly more slowly than control siRNA–transfected cells (Fig. 6A).
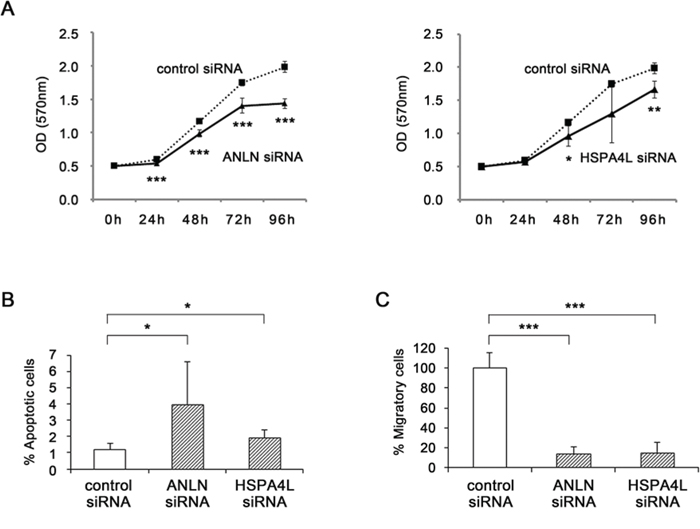
Figure 6: Functional analyses by silencing of ANLN and HSPA4L. A. Cell proliferation was determined by MTT assay every 24 h for 96 h after transfection of CNE1 cells with ANLN siRNA (left) or HSPA4L siRNA (right) (n = 5). B. Apoptotic cells were detected by flow cytometry. CNE1 cells were transfected with negative control siRNA, ANLN siRNA or HSPA4L siRNA, for 72 h, and then stained with annexin V-FITC and PI and subjected to flow cytometry (n = 3). C. Cell migration assay in CNE1 cells transfected with negative control siRNA, ANLN siRNA, or HSPA4L siRNA. At 72 h after transfection, harvested cells were seeded in a migration chamber and cultured for 24 h. Migratory cells were stained, photographed under a microscope, and quantitatively analyzed (n = 3). Data are shown as means ± standard deviation. P-values were calculated using the Student’s t-test (*P < 0.05, **P < 0.01, ***P < 0.001) compared with the control.
The apoptosis rates in ANLN siRNA–transfected cells (4.02 ± 2.59%, P < 0.05) and HSPA4L siRNA–transfected cells (1.93 ± 0.50%, P < 0.05) were significantly higher than those in control siRNA–transfected cells (1.22 ± 0.34%, Fig. 6B).
Migratory cells were observed less frequently in ANLN and HSPA4L siRNA–transfected cells than control siRNA–transfected cells (Fig. 6C, P < 0.001 in both siRNAs). These results indicate that ANLN and HSPA4L induce cell growth, cell migration, and resistance to apoptosis in NPC cells.
DISCUSSION
In this study, we analyzed the expression profiles of miRNAs in NPC using miRNA microarrays, and subsequently validated the findings by quantitative RT-PCR. Three EBV-encoded miR-BARTs and four hsa-miRNAs were significantly up-regulated, whereas six hsa-miRNAs were down-regulated, in NPC relative to NNE. According to a review by Hunt et al. [19], although technical replicates for microarrays typically show good reproducibility, there is a lack of interplatform agreement for expression profile data. Therefore, some of our results were coincident with previously reported microarray-based reports of dysregulation of miRNAs in NPC tissues, but we still obtained a different set of miRNAs. A recent review [20] indicated that several tumor-suppressor microRNAs, including miR-26a and miR-29c, are involved in NPC. In our preliminary study, which relied on previous reports, we measured these miRNAs by quantitative RT-PCR and observed significant down-regulation in NPC tissues relative to NNE tissues. Although miR-26a and miR-29c exhibited significant differences in our microarray analysis, the rank order of these miRNAs placed them outside of our candidate list. EBV is a critical etiological factor in NPC pathogenesis, and we found that three EBV-encoded miR-BARTs were highly expressed in all tissues from NPC patients. A threshold ΔCt value of 10 clearly distinguished between 18 NPC patients and 11 NNE patients. We also detected EBV-Encoded RNA (EBER) in NNE and NPC patients. All EBER-positive NPC cases had ΔCt values less than 10, and all EBER-negative NNE cases had ΔCt values greater than 10. Therefore, the nasopharyngeal tissues of all NPC patients in this study were infected with EBV, indicating that ebv-miR-BARTs, like EBER, could be used as biomarkers of infection in tissue. Despite the significant up-regulation of ebv-miR-BARTs in tumors, no ebv-miR-BARTs were significantly up-regulated in NPC plasma; this result was supported by a recent study that used RNA-Seq technology [21]. The recent surge of reports documenting circulating miRNAs in NPC patients supports their putative role as noninvasive cancer biomarkers. Among the dysregulated human miRNAs detected in tissues, miR-497 was concordantly down-regulated in plasma; therefore, miR-497 is a promising novel biomarker for diagnosis of NPC.
miR-497 is down-regulated in human tumors, such as prostate cancer [22], hepatocellular carcinoma [23], neuroblastoma [24], cervical cancer [25], breast cancer [26], colorectal cancer [27], and gastric cancer [28]. The mechanism responsible for miR-497 down-regulation remains unknown. Allelic loss is one reason for down-regulation of genes, but it occurs rarely in NPC [9]. On the other hand, EBV is an epigenetic regulator of host chromosomes. Because EBV-encoded miRNAs are highly elevated in epithelial carcinomas, they may target cellular genes important for host epigenetic programming, including DNA methylation [29]. Therefore, epigenetic silencing by DNA methylation may be one of the mechanisms underlying down-regulation of miR-497 in EBV-related NPC.
Several lines of evidence suggest that miRNAs play key roles in tumorigenesis, progression, invasion, or metastasis of NPC [30–32]. Although reduced expression of miR-497 was documented in a previous report [33], the biological function of miR-497 has not been characterized. Our functional studies using miR-497 mimic demonstrated that this miRNA efficiently suppresses cell proliferation and migration, and significantly induces apoptosis. Tumor growth in vivo was also suppressed by exogenous miR-497. Down-regulation of miR-497 may contribute to tumor growth and angiogenesis by targeting HDGF (hepatoma-derived growth factor) in non-small cell lung cancer [34]. VEGFA (vascular endothelial growth factor A) has also been predicted as a target gene [33], and we observed VEGFA up-regulation and neoangiogenesis in NPC in a recent study [35]. In addition, miR-497 plays a tumor-suppressive role in human cancer cell lines by targeting BCL2, thereby inducing apoptosis [36]. Zheng et al. [37] showed that IL-1–mediated IL6 expression was significantly repressed by miR-497 via the MAPK/ERK pathway, suggesting that miR-497 may play a suppressive role in inflammation-related cancers such as NPC [38]. Notably, we demonstrated in this study that ANLN and HSPA4L are potential targets of miR-497. We confirmed the up-regulation of ANLN and HSPA4L in NPC primary tumors, and found that exogenous miR-497 indeed caused down-regulation of ANLN and HSPA4L in NPC cells. Consistent with this, RNA interference targeting ANLN and HSPA4L in NPC cells inhibited cell proliferation and migration and induced apoptosis. ANLN, a gene encoding the human homologue of anillin, an actin-binding protein of Drosophila, is essential for the organization of actin cables in the cleavage furrow, promotion of DNA synthesis, and activation of cellular motility. It also plays a key role in cytokinesis [14, 39, 40]. Up-regulation of ANLN in tumor specimens is a marker of poor prognosis in several cancers [14, 15, 41]. Our data are supported by a report that siRNAs against ANLN suppress growth, induce apoptosis, and inhibit migration in lung cancer cells [14]. By contrast, the heat shock protein (Hsp) 70 family facilitates cancer cell survival and growth in various human tumor cells by inhibiting apoptosis and promoting proliferation [42–45]. HSP70 has been suggested to play roles in the progression of malignant tumors [44]. HSPA4L, a member of the Hsp70 family, is highly expressed by leukemia cells and elicits humoral immune responses in leukemia patients [17]. Thus, on the basis of our results as well as recent reports, we suggest that down-regulation of miR-497 in NPC plays a causative role in NPC via up-regulation of ANLN and HSPA4L.
In conclusion, the concordant down-regulation of miR-497 in tissues and plasma make this miRNA potentially very useful as a diagnostic biomarker for NPC. This study demonstrated for the first time that miR-497 is a regulator of ANLN and HSPA4L. Down-regulation of this potent tumor suppressor may result in elevated expression of ANLN and HSPA4L, leading to NPC development and progression. This knowledge will facilitate development of novel targets for NPC therapy.
MATERIALS AND METHODS
NPC primary tumor biopsies and noncancerous nasopharyngeal epithelia (NNE)
This study was performed in accordance with ethical review committee approval notice (2009–07–07) from the First Affiliated Hospital of Guangxi Medical University, China, and ethical approval (No. 1116) from Mie University, Japan. In total, samples were taken from 18 patients (48.2 ± 11.2 years old, 12 males, 6 females) with NPC, and noncancerous nasopharyngeal epithelia (NNE) were obtained via tonsillectomy from 11 patients (46.9 ± 9 years old, 5 males, 6 females) with chronic nasopharyngitis, used as normal controls. All subjects were patients at the Department of Otolaryngology Head and Neck Surgery, First Affiliated Hospital of Guangxi Medical University, Nanning, China, and provided informed consent prior to participation. Diagnoses were made by experienced pathologists according to the World Health Organization (WHO) classification. The pathological diagnosis of all NPC samples was non-keratinizing carcinoma. Biopsy samples were stored in liquid nitrogen. Tissue and plasma samples were collected from the same patients.
Extraction of RNA from tissues and miRNA microarray
Frozen tissues were treated with RNAlater ICE (Ambion) prior to RNA extraction. RNA containing miRNA was extracted using the mirVana™ miRNA Isolation Kit (Ambion, USA). One hundred nanograms of total RNA from seven NPC biopsies and five NNE samples were submitted to the Agilent miRNA microarray analysis service (Hokkaido System Science Co., Ltd., Sapporo, Japan). The array (SurePrint G3 Human miRNA, 8 × 60K, Rel. 16.0, Agilent Technologies, USA) contained more than 1300 probes for mature miRNAs, including EBV-related miRNAs.
Detection of miRNA expression levels by quantitative RT-PCR
Tissue and cell samples were subjected to quantitative quantitative RT-PCR for miRNA. Reverse transcription for quantitative real-time PCR was performed using the miScript II RT kit (QIAGEN, Hilden, Germany); the miScript HiFlex buffer promotes conversion of all RNA species into cDNA, which can then be used in real-time PCR to quantitate mature miRNAs using miScript Primer Assays (QIAGEN). Quantitative real-time PCR was performed using the miScript SYBR Green PCR kit (QIAGEN). miRNA levels in tissues were normalized against the corresponding levels of the RNU6B snRNA. Relative expression levels of NPC relative to NNE were calculated using the ΔΔCt method.
RNA extraction from plasma and measurement of miRNA expression levels by quantitative RT-PCR
For plasma collection, venous blood (5 ml) was collected using EDTA from noncancerous control and NPC patients before biopsy and before any therapeutic procedures, including radiotherapy. Blood samples were centrifuged at 1500 rpm for 15 min at 4°C to collect plasma and to remove residual cellular nucleic acids attached to cell debris. Plasma samples were stored at −80°C before miRNA extraction. The miRNeasy Serum/Plasma Kit (QIAGEN) was used to isolate small RNAs from 200 μl of plasma. A synthetic C. elegans miR-39 miRNA mimic (Syn-cel-miR-39, QIAGEN) and carrier RNA (0.94 μg, MS2 bacteriophage total RNA, Roche Applied Sciences, Indianapolis, IN, USA) were added to each plasma sample before RNA extraction. Isolated RNA was eluted with 15 μl RNase-free water.
The miScript II RT Kit (QIAGEN) was used to synthesize cDNA from 5 μl of the eluted RNA (containing miRNAs) in HiFlex buffer. Quantitative RT-PCR was performed using the miScript SYBR Green PCR kit (QIAGEN) and miScript Primer Assays. miRNA levels were normalized against the average of five reference miRNAs (miR-423-5p, miR-103a-3p, miR-191-5p, miR-425-5p, and miR-93), which were used as internal controls in plasma samples. Syn-cel-miR-39 was used to confirm RNA extraction efficacy. Relative quantities in NPC vs. NNE were calculated using the ΔΔCt method.
The five reference miRNA average mentioned above were ranked as the best miRNA standard by the online tool RefFinder (http://www.leonxie.com/) of the EST database. These five miRNAs exhibited no significant difference in plasma levels between NNE and NPC (Supplementary Fig. 1). In light of reports of up-regulation of miR-93 in NPC tissues [31, 32], we also measured miR-93 levels: miR-93 was up-regulated in NPC tissues (RQ = 2.78, P < 0.01) relative to NNE tissues, but plasma levels of miR-93 did not differ significantly between NPC and NNE patients, and there was no significant correlation between tissues and plasma (r = 0.109), suggesting that plasma miR-93 could be used as one of the normalization references.
Cell culture
NPC cell lines (HK1/EBV, HK1) were a kind gift from Professor Tsao (Hong Kong University) [46–49]. The HK1/EBV cell line was established by stable infection of HK1 cells with recombinant EBV carrying the green fluorescent protein (EGFP) gene. NPC cell lines CNE1 and HONE1 were from Guangxi Medical University. Cells were maintained at 37°C in a 5% CO2 incubator. HK1/EBV and HK1 cells were cultured in RPMI1640 medium (Gibco, USA) supplemented with 10% fetal bovine serum (FBS, Gibco), 100 U/ml penicillin, and 0.1 mg/ml streptomycin. CNE1 and HONE1 cells were maintained in IMDM (Gibco) supplemented with 10% FBS and 0.1 mg/ml kanamycin.
Transfection of miRNA mimic
Before transfection, NPC cell lines were maintained in serum-free medium. Cells were transfected with mirVana miRNA mimics (Ambion), or miRNA mimic negative control #1 (Ambion), at a final concentration of 30 nmol/L using GeneSilencer (Genlantis, San Diego, CA). After 4 h incubation, 1 volume of media containing 20% serum was added. The cells were then incubated at 37°C in a CO2 incubator for the indicated times, and used for subsequent experiments.
Cell proliferation assay
NPC cells were seeded in 96-well plates at a density of 2,000 cells/100 μL/well and incubated at 37°C. Cell proliferation was assessed every 24 h for the indicated duration of time following transfection. Briefly, 10 μL of MTT (3-(4,5-dimethylthiazol-2-yl)-2,5-diphenyl tetrazolium bromide, 5.0 mg/mL; Sigma-Aldrich) was added to each well, and the plates were incubated for 4 h at 37°C. The culture media were removed, 100 μL DMSO was added, and the cells were incubated for 10 min on a shaker. Optical densities were determined at 570 nm on a Bio-Rad model 680 microplate reader, (Bio-Rad Laboratories, Hercules, CA, USA). OD values reflect the relative number of viable cells.
ICC study
For ICC analysis, miRNA mimic–transfected cells were fixed with 1% (v/v) formaldehyde in phosphate-buffered saline (PBS) for 10 min at room temperature and washed three times with PBS. The cells were treated with 1% (v/v) Triton X-100 for 20 min, and then incubated with 5% (w/v) skim milk for 60 min at room temperature. Immunofluorescence was performed by incubation with mouse monoclonal anti-ANLN (1:100, Santa Cruz Biotechnology, Dallas, TX, USA), mouse monoclonal anti-HSPA4L (1:100, Santa Cruz Biotechnology), and rabbit polyclonal anti-caspase-3 (1:100, Santa Cruz Biotechnology) overnight at room temperature. The cells were then incubated with fluorescent secondary antibodies (Alexa Fluor 594–labeled goat anti-mouse IgG or Alexa Fluor 488-labeled goat anti-rabbit IgG; 1:400 each; Molecular Probes) for 2 h. Nuclei were stained with DAPI, and the stained cells were examined under a fluorescence microscope (BX53, Olympus, Tokyo, Japan). The number of positively-staining cells was analyzed using the ImageJ software (ver. 1.48).
Apoptosis analysis by flow cytometry
To measure apoptosis, expression of Annexin V-FITC and exclusion of propidium iodide (PI) (TACS Annexin V-FITC, Trevigen, Inc., Gaithersburg, MD) were detected by double-label flow cytometry. Seventy-two hours after transfection, cells were collected, washed once with PBS, and washed again with 400 μL binding buffer. Samples were incubated with 100 μl Annexin V-FITC reagent in the dark for 15 min at room temperature, and then the volume was adjusted to 500 μl with binding buffer. Fluorescence was measured on a flow cytometer (BD Biosciences, FACSCanto II, San Jose, CA, USA) within 1 h for maximal signal.
Cell migration assay
Cell migration assays were performed using the CytoSelect Cell Migration Assay Kit (8 μm pore size of membrane filter; Colorimetric Format; Cell BioLabs, Inc., San Diego, CA, USA). Briefly, 72 h after transfection, NPC cell suspension (0.15 × 10⁶ transfected cells/well) in serum-free medium was placed in the upper chamber, and media containing 10% FBS was placed in the lower well of the migration plate. After incubation for 24 h and removal of non-migratory cells, cells that migrated through the filter were stained and photographed under a microscope (100 × and 200 × magnification) for each filter in three areas. Migratory cells were counted, and the average number of migratory cells in the control condition was assigned as 100%.
In vivo tumor growth assay
Five-week-old male BALB/c athymic nu/nu mice (Japan SLC, Inc., Hamamatsu, Japan, weight range: 16–19 g) used for these experiments were maintained at the Institute of Laboratory Animals at Mie University. All animal experiments were performed according to the Mie University guidelines for laboratory animals (approval No. 26–19). Animals were housed in ventilated caging conditions under a 12-h dark/light cycle at constant humidity and temperature. Animals were permitted free access to sterile water and standard laboratory chow. Subcutaneous xenografts were established by inoculating 2 × 10⁶ miR-497 mimic–transfected cells into the left flank, or an equal number of control mimic–transfected cells into the right flank. The mice were observed for tumor formation, and tumor volume was measured with a caliper (model 530–312; range 0–150 mm; Mitutoyo, Kawasaki, Japan) and calculated using the formula: V=L × W × H × π/6, where L, W, and H represent tumor diameters in three mutually perpendicular planes. After the mice were sacrificed by cervical dislocation, the tumors were recovered and the wet weights of each tumor were determined.
Detection of gene expression using mRNA microarray and quantitative RT-PCR
Fifty nanograms of RNA from seven NPC biopsies and five NNE samples were subjected to Agilent SurePrint G3 Human GE microarray analysis (Hokkaido System Science Co., Ltd.). The array (SurePrint G3 Human GE 8 × 60K, 1 color) contained probes for more than 20,000 genes for gene expression analysis. Probes with significant signal in samples were used for data analyses (22,922 probes).
SYBR Green RT-qPCR assays were used to assess mRNA expression in tissue and cell samples. The miScript II RT Kit (QIAGEN) was used to synthesize cDNA in HiFlex buffer. Quantitative PCR was performed using the miScript SYBR Green PCR kit and QuantiTect Primer Assays (QIAGEN). mRNA levels were normalized against the corresponding levels of GAPDH mRNA, and relative quantities (RQ) of NPC vs. NNE were calculated using the ΔΔCt method.
IHC study
For IHC analysis, standard immunoperoxidase methods were used to examine the distribution of ANLN and HSPA4L in NPC tissues and normal controls. After deparaffinization and rehydration, antigen was retrieved in 5% urea buffer by microwave heating for 5 min, and then incubated in 1% H2O2 for 30 min to block endogenous peroxidase activity. Sections of 3-μm thickness were incubated overnight at room temperature with the following antibodies: mouse monoclonal anti-ANLN (1:100, Santa Cruz Biotechnology) and mouse monoclonal anti-HSPA4L (1:100, Santa Cruz Biotechnology). For mouse antibodies, the sections were incubated with biotinylated anti-mouse IgG for 3 h, and then incubated with avidin–biotin complex (Vectastain ABC kit, Vector Laboratories, Burlingame, CA, USA) for 2 h. Sections were then incubated with 3,3′-diaminobenzidine (DAB substrate kit; Vector Laboratories). Nuclei were counterstained with hematoxylin.
IHC grading based on intensity and frequency of staining was performed by two independent investigators without knowledge of the patients’ clinicopathological features. Staining intensity was scored as negative (0), weak (+1), moderate (+2), or strong (+3). Frequency of positive cells in specific areas was scored as negative (0), less than 25% (+1), 25–50% (+2), 51–75% (+3), or more than 75% (+4). IHC grading was assigned an IHC score as follows: −, negative expression (0); +, weak expression (1 − 3), ++, moderate expression (4 − 6); +++, high expression (7 − 9) or ++++, very high expression (10 − 12).
Candidate target gene siRNA transfection
Small interfering RNA (siRNA) for candidate target genes ANLN (SDO-1006-1005899, GENE_ID54443) and HSPA4L (SDO-1006-1071379, GENE_ID22824), as well as negative control siRNA (SN-1001), were synthesized by BIONEER (Daejeon, South Korea). The transfection was performed using GeneSilencer. Briefly, CNE1 cells were seeded at 1 × 10⁵/well in 6-well plates 1 day prior to transfection with 1000 ng of siRNA. The cells were collected after 24 h, and the expression levels of target genes were confirmed by real-time PCR in CNE1 comparing specific siRNA-treated and negative control siRNA–treated cells.
Statistical analysis
Statistical analyses were performed using the SPSS19 software package. Data are presented as means ± standard deviation. Student’s t-test was used to compare differences in ΔCt values between two groups. Statistical differences of IHC grading and score were determined by the chi-square test and Mann–Whitney U test, respectively. A P-value less than 0.05 was considered to be statistically significant.
ACKNOWLEDGMENTS AND FUNDING
This work was partly supported by Grants-in-Aid for Scientific Research from the Ministry of Education, Culture, Sports, Science, and Technology of Japan (Grant Nos. 22406016, 25305020, and 25293149); the Program for New Century Excellent Talents in University (No. NCET-12-0654) and the Guangxi Natural Science Foundation (No. 2013GXNSFGA019002).
CONFLICTS OF INTEREST
The authors declare no conflict of interest.
Abbreviations
miRNA, microRNA; NPC, nasopharyngeal carcinoma; NNE, noncancerous nasopharyngeal epithelia; EBV, Epstein-Barr virus; BARTs, BamHI A Rightward Transcripts; siRNA, small interfering RNA; ANLN, anillin, actin-binding protein; HSPA4L, heat shock 70 kDa protein 4–like; IHC, immunohistochemistry; ICC, immunocytochemistry.
REFERENCES
1. Zeng Y. Principles of micro-RNA production and maturation. Oncogene. 2006; 25:6156–6162.
2. Filipowicz W, Bhattacharyya SN, Sonenberg N. Mechanisms of post-transcriptional regulation by microRNAs: are the answers in sight? Nat Rev Genet. 2008; 9:102–114.
3. Ambros V. The functions of animal microRNAs. Nature. 2004; 431:350–355.
4. Houbaviy HB, Murray MF, Sharp PA. Embryonic stem cell-specific MicroRNAs. Dev Cell. 2003; 5:351–358.
5. Farh KK, Grimson A, Jan C, Lewis BP, Johnston WK, Lim LP, Burge CB, Bartel DP. The widespread impact of mammalian MicroRNAs on mRNA repression and evolution. Science. 2005; 310:1817–1821.
6. Calin GA, Croce CM. MicroRNA signatures in human cancers. Nat Rev Cancer. 2006; 6:857–866.
7. Kent OA, Mendell JT. A small piece in the cancer puzzle: microRNAs as tumor suppressors and oncogenes. Oncogene. 2006; 25:6188–6196.
8. Kamran SC, Riaz N, Lee N. Nasopharyngeal Carcinoma. Surg Oncol Clin N Am. 2015; 24:547–561.
9. Tao Q, Chan AT. Nasopharyngeal carcinoma: molecular pathogenesis and therapeutic developments. Expert Rev Mol Med. 2007; 9:1–24.
10. Petersson F. Nasopharyngeal carcinoma: a review. Semin Diagn Pathol. 2015; 32:54–73.
11. Zhang Z, Sun D, Van do N, Tang A, Hu L, Huang G. Inactivation of RASSF2A by promoter methylation correlates with lymph node metastasis in nasopharyngeal carcinoma. Int J Cancer. 2007; 120:32–38.
12. Wang S, Xiao X, Zhou X, Huang T, Du C, Yu N, Mo Y, Lin L, Zhang J, Ma N, Murata M, Huang G, Zhang Z. TFPI-2 is a putative tumor suppressor gene frequently inactivated by promoter hypermethylation in nasopharyngeal carcinoma. BMC Cancer. 2010; 10:617.
13. Mo Y, Midorikawa K, Zhang Z, Zhou X, Ma N, Huang G, Hiraku Y, Oikawa S, Murata M. Promoter hypermethylation of Ras-related GTPase gene RRAD inactivates a tumor suppressor function in nasopharyngeal carcinoma. Cancer Lett. 2012; 323:147–154.
14. Suzuki C, Daigo Y, Ishikawa N, Kato T, Hayama S, Ito T, Tsuchiya E, Nakamura Y. ANLN plays a critical role in human lung carcinogenesis through the activation of RHOA and by involvement in the phosphoinositide 3-kinase/AKT pathway. Cancer Res. 2005; 65:11314–11325.
15. PC OL, Penny SA, Dolan RT, Kelly CM, Madden SF, Rexhepaj E, Brennan DJ, McCann AH, Ponten F, Uhlen M, Zagozdzon R, Duffy MJ, Kell MR, Jirstrom K, Gallagher WM. Systematic antibody generation and validation via tissue microarray technology leading to identification of a novel protein prognostic panel in breast cancer. BMC Cancer. 2013; 13:175.
16. Hall PA, Todd CB, Hyland PL, McDade SS, Grabsch H, Dattani M, Hillan KJ, Russell SE. The septin-binding protein anillin is overexpressed in diverse human tumors. Clin Cancer Res. 2005; 11:6780–6786.
17. Takahashi H, Furukawa T, Yano T, Sato N, Takizawa J, Kurasaki T, Abe T, Narita M, Masuko M, Koyama S, Toba K, Takahashi M, Aizawa Y. Identification of an overexpressed gene, HSPA4L, the product of which can provoke prevalent humoral immune responses in leukemia patients. Exp Hematol. 2007; 35:1091–1099.
18. Ciocca DR, Calderwood SK. Heat shock proteins in cancer: diagnostic, prognostic, predictive, and treatment implications. Cell Stress Chaperones. 2005; 10:86–103.
19. Hunt EA, Broyles D, Head T, Deo SK. MicroRNA Detection: Current Technology and Research Strategies. Annu Rev Anal Chem. 2015; 8:217–237.
20. Tan G, Tang X, Tang F. The role of microRNAs in nasopharyngeal carcinoma. Tumour Biol. 2015; 36:69–79.
21. Plieskatt JL, Rinaldi G, Feng Y, Levine PH, Easley S, Martinez E, Hashmi S, Sadeghi N, Brindley PJ, Bethony JM, Mulvenna JP. Methods and matrices: approaches to identifying miRNAs for nasopharyngeal carcinoma. J Transl Med. 2014; 12:3.
22. Wang L, Li B, Li L, Wang T. MicroRNA-497 suppresses proliferation and induces apoptosis in prostate cancer cells. Asian Pac J Cancer Prev. 2013; 14:3499–3502.
23. Furuta M, Kozaki K, Tanimoto K, Tanaka S, Arii S, Shimamura T, Niida A, Miyano S, Inazawa J. The tumor-suppressive miR-497–195 cluster targets multiple cell-cycle regulators in hepatocellular carcinoma. PLoS One. 2013; 8:e60155.
24. Creevey L, Ryan J, Harvey H, Bray IM, Meehan M, Khan AR, Stallings RL. MicroRNA-497 increases apoptosis in MYCN amplified neuroblastoma cells by targeting the key cell cycle regulator WEE1. Mol Cancer. 2013; 12:23.
25. Luo M, Shen D, Zhou X, Chen X, Wang W. MicroRNA-497 is a potential prognostic marker in human cervical cancer and functions as a tumor suppressor by targeting the insulin-like growth factor 1 receptor. Surgery. 2013; 153:836–847.
26. Shen L, Li J, Xu L, Ma J, Li H, Xiao X, Zhao J, Fang L. miR-497 induces apoptosis of breast cancer cells by targeting Bcl-w. Exp Ther Med. 2012; 3:475–480.
27. Guo ST, Jiang CC, Wang GP, Li YP, Wang CY, Guo XY, Yang RH, Feng Y, Wang FH, Tseng HY, Thorne RF, Jin L, Zhang XD. MicroRNA-497 targets insulin-like growth factor 1 receptor and has a tumour suppressive role in human colorectal cancer. Oncogene. 2013; 32:1910–1920.
28. Li W, Jin X, Deng X, Zhang G, Zhang B, Ma L. The putative tumor suppressor microRNA-497 modulates gastric cancer cell proliferation and invasion by repressing eIF4E. Biochem Biophys Res Commun. 2014; 449:235–240.
29. Tempera I, Lieberman PM. Epigenetic regulation of EBV persistence and oncogenesis. Semin Cancer Biol. 2014; 26:22–29.
30. Qu C, Liang Z, Huang J, Zhao R, Su C, Wang S, Wang X, Zhang R, Lee MH, Yang H. MiR-205 determines the radioresistance of human nasopharyngeal carcinoma by directly targeting PTEN. Cell Cycle. 2012; 11:785–796.
31. Xu YF, Mao YP, Li YQ, Ren XY, He QM, Tang XR, Sun Y, Liu N, Ma J. MicroRNA-93 promotes cell growth and invasion in nasopharyngeal carcinoma by targeting disabled homolog-2. Cancer Lett. 2015; 363:146–155.
32. Tang JF, Yu ZH, Liu T, Lin ZY, Wang YH, Yang LW, He HJ, Cao J, Huang HL, Liu G. Five miRNAs as novel diagnostic biomarker candidates for primary nasopharyngeal carcinoma. Asian Pac J Cancer Prev. 2014; 15:7575–7581.
33. Chen HC, Chen GH, Chen YH, Liao WL, Liu CY, Chang KP, Chang YS, Chen SJ. MicroRNA deregulation and pathway alterations in nasopharyngeal carcinoma. Br J Cancer. 2009; 100:1002–1011.
34. Zhao WY, Wang Y, An ZJ, Shi CG, Zhu GA, Wang B, Lu MY, Pan CK, Chen P. Downregulation of miR-497 promotes tumor growth and angiogenesis by targeting HDGF in non-small cell lung cancer. Biochem Biophys Res Commun. 2013; 435:466–471.
35. Wang S, Ma N, Kawanishi S, Hiraku Y, Oikawa S, Xie Y, Zhang Z, Huang G, Murata M. Relationships of alpha-SMA-positive fibroblasts and SDF-1-positive tumor cells with neoangiogenesis in nasopharyngeal carcinoma. Biomed Res Int. 2014; 2014:507353.
36. Zhu W, Zhu D, Lu S, Wang T, Wang J, Jiang B, Shu Y, Liu P. miR-497 modulates multidrug resistance of human cancer cell lines by targeting BCL2. Med Oncol. 2012; 29:384–391.
37. Zheng D, Radziszewska A, Woo P. MicroRNA 497 modulates interleukin 1 signalling via the MAPK/ERK pathway. FEBS Lett. 2012; 586:4165–4172.
38. Ma N, Kawanishi M, Hiraku Y, Murata M, Huang GW, Huang Y, Luo DZ, Mo WG, Fukui Y, Kawanishi S. Reactive nitrogen species-dependent DNA damage in EBV-associated nasopharyngeal carcinoma: the relation to STAT3 activation and EGFR expression. Int J Cancer. 2008; 122:2517–2525.
39. Oegema K, Savoian MS, Mitchison TJ, Field CM. Functional analysis of a human homologue of the Drosophila actin binding protein anillin suggests a role in cytokinesis. J Cell Biol. 2000; 150:539–552.
40. Silverman-Gavrila RV, Hales KG, Wilde A. Anillin-mediated targeting of peanut to pseudocleavage furrows is regulated by the GTPase Ran. Mol Biol Cell. 2008; 19:3735–3744.
41. Olakowski M, Tyszkiewicz T, Jarzab M, Krol R, Oczko-Wojciechowska M, Kowalska M, Kowal M, Gala GM, Kajor M, Lange D, Chmielik E, Gubala E, Lampe P, Jarzab B. NBL1 and anillin (ANLN) genes over-expression in pancreatic carcinoma. Folia Histochem Cytobiol. 2009; 47:249–255.
42. Garrido C, Brunet M, Didelot C, Zermati Y, Schmitt E, Kroemer G. Heat shock proteins 27 and 70: anti-apoptotic proteins with tumorigenic properties. Cell Cycle. 2006; 5:2592–2601.
43. Aghdassi A, Phillips P, Dudeja V, Dhaulakhandi D, Sharif R, Dawra R, Lerch MM, Saluja A. Heat shock protein 70 increases tumorigenicity and inhibits apoptosis in pancreatic adenocarcinoma. Cancer Res. 2007; 67:616–625.
44. Yoshidomi K, Murakami A, Yakabe K, Sueoka K, Nawata S, Sugino N. Heat shock protein 70 is involved in malignant behaviors and chemosensitivities to cisplatin in cervical squamous cell carcinoma cells. J Obstet Gynaecol Res. 2014; 40:1188–1196.
45. Zhong MA, Zhang H, Qi XY, Lu AG, You TG, Gao W, Guo XL, Zhou ZQ, Yang Y, Wang CJ. ShRNA-mediated gene silencing of heat shock protein 70 inhibits human colon cancer growth. Mol Med Rep. 2011; 4:805–810.
46. Lo AK, Lo KW, Tsao SW, Wong HL, Hui JW, To KF, Hayward DS, Chui YL, Lau YL, Takada K, Huang DP. Epstein-Barr virus infection alters cellular signal cascades in human nasopharyngeal epithelial cells. Neoplasia. 2006; 8:173–180.
47. Tsang CM, Zhang G, Seto E, Takada K, Deng W, Yip YL, Man C, Hau PM, Chen H, Cao Y, Lo KW, Middeldorp JM, Cheung AL, Tsao SW. Epstein-Barr virus infection in immortalized nasopharyngeal epithelial cells: regulation of infection and phenotypic characterization. Int J Cancer. 2010; 127:1570–1583.
48. Huang DP, Ho JH, Poon YF, Chew EC, Saw D, Lui M, Li CL, Mak LS, Lai SH, Lau WH. Establishment of a cell line (NPC/HK1) from a differentiated squamous carcinoma of the nasopharynx. Int J Cancer. 1980; 26:127–132.
49. Li HM, Man C, Jin Y, Deng W, Yip YL, Feng HC, Cheung YC, Lo KW, Meltzer PS, Wu ZG, Kwong YL, Yuen AP, Tsao SW. Molecular and cytogenetic changes involved in the immortalization of nasopharyngeal epithelial cells by telomerase. Int J Cancer. 2006; 119:1567–1576.