
INTRODUCTION
Pancreatic cancer (PC) is the fourth leading cause of cancer-related death globally [1]. Many patients are diagnosed at the advanced stages, where there is extensive local tumor invasion and early systemic dissemination, missing the best opportunity for curative surgery. Therefore, it is a highly lethal disease with very poor prognosis and a low 5-year survival rate (<6%) [2]. With emphasis on the dismal prognosis and survival, principally because effective biomarkers and therapeutic targets are still not identified. Despite the great efforts on the research of molecular alterations involved in PC [3–6], due to the sophistication and heterogeneity of this disease [7], the situation for PC is still deplorable. Thus, in-depth research of the genetic alterations and underlying molecular mechanism of PC is still an urgent issue.
Protein-coding genes in the human genome have been well-studied in the last few decades. However, while at least 90% of the human genome is actively transcribed [8], the protein-coding genes account for only 1.5% of the genome [9]. There has been an explosion of research into the possible functional roles of the remaining 98% of the human genome that does not encode proteins, namely the non-coding RNAs (ncRNAs). These so-called ncRNAs are arbitrarily separated into long ncRNAs (lncRNAs) and short ncRNAs including microRNAs (miRNAs) on the basis of their size [10]. LncRNAs are commonly described as RNA molecules > 200 nucleotides in length. Recent studies have postulated that lncRNAs are of crucial functional importance for cell fate determination and disease occurrence [11, 12]. Growing evidence is supporting the involvement of lncRNAs in tumorigenesis and tumor progression [13–16]. They may modulate cancer initiation and progression by affecting several biological pathways [17, 18]. As they are implicated as tumor suppressors and oncogenes, some lncRNAs are promising biomarkers and diagnostic and treatment targets. For example, metastasis-associated lung adenocarcinoma transcript 1 (MALAT-1) appears to be a potential diagnostic and prognostic marker of non–small cell lung cancer [13, 19]. Another study described MALAT-1–derived fragments as a novel plasma-based biomarker for diagnosing prostate cancer [20]. Differential display code 3 (DD3/PCA3), a prostate-specific lncRNA, acted as a biomarker that could be detected in the urine of patients with prostate cancer [21, 22]. However, only a few studies have investigated the relationship between lncRNAs and PC [23–26]. The expression and function of most lncRNAs in PC and their clinical significance remain unknown.
In the present study, we explored the lncRNA expression profile in PC using Arraystar Human LncRNA Microarray which targeting 7419 lncRNA and validated our results in cancer tissues and their paired adjacent non-tumorous tissues. Next, we analyzed the relationship between the aberrantly expressed lncRNAs and the clinicopathological factors of patients with PC. To find effective biomarkers, we detected the expression levels of two lncRNA fragments in blood from the patients with PC. Our results provide candidate diagnostic and prognostic biomarkers for PC.
RESULTS
LncRNA expression profile in PC tissues relative to non-tumorous tissues
We conducted lncRNA microarray analysis which was mentioned previous [27] on eight PC tissues and four chronic pancreatitis tissues utilizing a microarray targeting 7419 lncRNAs (Arraystar Human LncRNA Microarray V3; Agilent Technology, Santa Clara, CA). As pancreatitis is a known risk factor for pancreatic cancer [28, 29], we chose chronic pancreatitis (CP) tissues as a control to avoid the interference of inflammation. Analysis of the normalized lncRNA expression levels by Student’s t test revealed significantly different lncRNA expression patterns between PC tissues and chronic pancreatitis tissues (Figure 1A). To identify the lncRNAs that were potential biomarkers, we further extracted 33 lncRNAs with fold change > 3 (Table 1); seven and 26 were upregulated and downregulated, respectively, in the tumor tissues. The upregulated lncRNAs with the greatest fold change, in descending order, were XLOC_006390, HOTTIP-005, and RP11-567G11.1 and were selected for validation. (Table 1, Figure 1B).
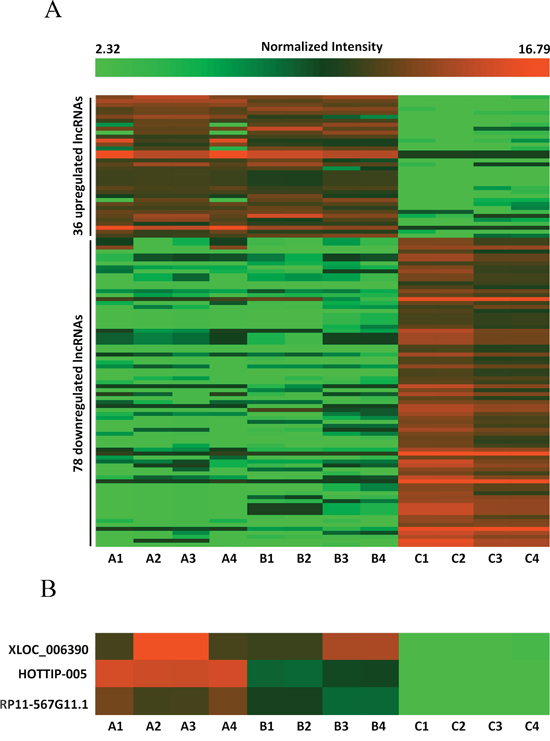
Figure 1: Differences in lncRNA expression profiles between PC and chronic pancreatitis tissues. A. Heat map representing hierarchical clustering of distinct lncRNA expression profiling in PC tissues and chronic pancreatitis tissues (fold change > 2.5). Red color scale, higher expression; green color scale, lower expression. B. High-resolution heat map showing that XLOC_006390, HOTTIP-005, and RP11-567G11.1 were the most upregulated lncRNAs in the PC tissues. A1–4: Diabetes mellitus–associated PC; B1–4: PC without diabetes mellitus; C1–4: chronic pancreatitis.
Table 1: LncRNAs which were > 3-fold differentially expressed in PC tissues as compared with chronic pancreatitis tissues
Gene Symbol |
Chromosome |
RNA length |
Regulation |
Fold change |
P value |
|---|---|---|---|---|---|
XLOC_006390 |
chr7 |
4899 |
up |
4.24 |
5.29E-07 |
HOTTIP-005 |
chr7 |
2285 |
up |
4.13 |
1.65E-05 |
RP11-567G11.1 |
chr3 |
246 |
up |
3.78 |
1.47E-07 |
XLOC_012784 |
chr18 |
2402 |
up |
3.71 |
9.24E-07 |
LINC00460 |
chr13 |
935 |
up |
3.25 |
7.88E-11 |
CTD-2547H18.1 |
chr11 |
568 |
up |
3.15 |
0.00905 |
RP3-395M20.9 |
chr1 |
626 |
up |
3.00 |
1.08E-07 |
TMED11P |
chr4 |
533 |
down |
5.45 |
2.46E-09 |
TMED11P |
chr4 |
204 |
down |
4.34 |
7.17E-07 |
RP5-894D12.3 |
chr6 |
346 |
down |
4.26 |
8.92E-09 |
HMlincRNA767 |
chr5 |
18267 |
down |
4.25 |
6.12E-09 |
RP11-331F4.4 |
chr16 |
697 |
down |
3.93 |
1.93E-10 |
RP4-809F18.1 |
chr12 |
1310 |
down |
3.89 |
3.70E-15 |
LINC00426 |
chr13 |
276 |
down |
3.83 |
1.00E-10 |
RP11-753D20.4 |
chr14 |
2352 |
down |
3.71 |
4.15E-07 |
LOC389023 |
chr2 |
744 |
down |
3.67 |
6.68E-07 |
AC011306.2 |
chr2 |
900 |
down |
3.64 |
9.35E-10 |
RP11-404P21.3 |
chr14 |
738 |
down |
3.48 |
6.57E-09 |
BC038546 |
chr8 |
907 |
down |
3.42 |
0.0001 |
RP11-680B3.2 |
chr3 |
1414 |
down |
3.36 |
6.49E-08 |
RP11-331F4.4 |
chr16 |
527 |
down |
3.32 |
3.13E-13 |
COL6A4P1 |
chr3 |
1251 |
down |
3.31 |
7.75E-07 |
RP11-76I14.1 |
chr2 |
1378 |
down |
3.25 |
2.09E-07 |
AC114877.3 |
chr3 |
582 |
down |
3.20 |
3.88E-08 |
RP5-894D12.3 |
chr6 |
318 |
down |
3.17 |
7.44E-07 |
XLOC_002309 |
chr2 |
780 |
down |
3.15 |
3.37E-06 |
XLOC_005355 |
chr6 |
585 |
down |
3.07 |
5.15E-09 |
CELP |
chr9 |
1216 |
down |
3.05 |
5.93E-12 |
XLOC_005737 |
chr6 |
1374 |
down |
3.04 |
1.05E-08 |
XLOC_011288 |
chr15 |
240 |
down |
3.03 |
2.48E-07 |
AC007349.4 |
chr7 |
587 |
down |
3.03 |
6.20E-06 |
chr12:53675775-53689275 |
chr12 |
13500 |
down |
3.01 |
1.32E-06 |
LINC00316 |
chr21 |
455 |
down |
3.01 |
2.02E-08 |
HOTTIP-005 was validated as the most increased splice variant of HOTTIP in PC tissues
To date, five splice variants of HOTTIP have been reported: HOTTIP-001, HOTTIP-002, HOTTIP-003, HOTTIP-005, and HOTTIP-006 (http://asia.ensembl.org) (Figure 2A). The lncRNA microarray analysis showed that HOTTIP-005 was significantly increased, as detected by the HOTTIP-005–specific probe. To validate the finding that HOTTIP-005 was the most increased HOTTIP slice variant in PC tissues, we designed specific quantitative real-time PCR (qRT-PCR) primers for HOTTIP-001, HOTTIP-002, and HOTTIP-005, respectively. As the HOTTIP-003 and HOTTIP-006 sequences completely or closely match that of HOTTIP-005, we designed a primer that was simultaneously specific to HOTTIP-003, HOTTIP-005, and HOTTIP-006, i.e., HOTTIP-003,005,006–specific (Figure 2A). We performed the qRT-PCR using each primer pair in PC tissues and the adjacent non-tumorous tissues (n = 10). β-actin was used as the normalization control. Relative expression analysis showed that HOTTIP-005 was the most increased splice variant in the PC tissues, followed by HOTTIP-001, while the total expression of HOTTIP-002, HOTTIP-003, and HOTTIP-006 accounted for a very small proportion of the increased splice variants (Figure 2B). We confirmed that the HOTTIP-001, HOTTIP-002, HOTTIP-005, and HOTTIP-003,005,006 amplicons were specific by sequencing the qRT-PCR products (Supplementary Figure S1).
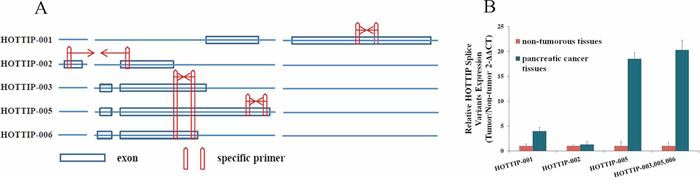
Figure 2: Identification of HOTTIP splice variant expression levels. A. Five HOTTIP splice variants and the representative diagrams of their sequences; specific qRT-PCR primers were designed for HOTTIP-001, HOTTIP-002, and HOTTIP-005. The HOTTIP-003 and HOTTIP-006 sequences completely or closely matched that of HOTTIP-005, and we designed a primer that was simultaneously specific for HOTTIP-003, HOTTIP-005, and HOTTIP-006. B. Relative expression level of HOTTIP-001, HOTTIP-002, HOTTIP-003, HOTTIP-005, and HOTTIP-006 in PC tissues compared to adjacent non-tumorous tissues (n = 10). HOTTIP-005 was the most upregulated splice variant in PC tissues, followed by HOTTIP-001.β-actin was used as the normalization control.
HOTTIP-005, XLOC_006390, and RP11-567G11.1 expression in normal and PC cell lines
We examined HOTTIP-005, XLOC_006390, and RP11-567G11.1 expression in a normal cell line (HPDE6) and six PC cell lines (PANC-1, BxPC-3, Capan2, MIAPaCa-2, SW1990, AsPC-1) using qRT-PCR. Compared with the HPDE6 cells, all PC cell lines had higher HOTTIP-005, XLOC_006390, and RP11-567G11.1 expression; HOTTIP-005, XLOC_006390, and RP11-567G11.1 expression was highest in the AsPC-1, SW1990, and PANC-1 cells, respectively (Figure 3A).
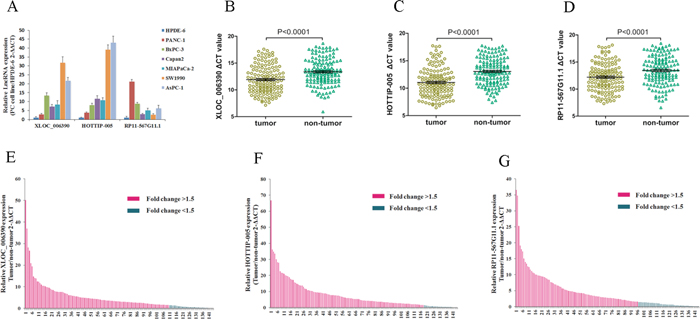
Figure 3: XLOC_006390, HOTTIP-005, and RP11-567G11.1 expression were increased in PC cell lines and tissues. A. qRT-PCR evaluation of XLOC_006390, HOTTIP-005, and RP11-567G11.1 expression in PC cell lines as compared with the HPDE6 cell line. B. XLOC_006390, C. HOTTIP-005, and D. RP11-567G11.1 expression levels in PC tissues were all significantly higher than that in the non-tumorous tissues (n = 144, P < 0.0001). Smaller ΔCT value indicates higher expression. β-actin was used as the normalization control. E. XLOC_006390, F. HOTTIP-005, and G. RP11-567G11.1 relative gene expression was determined using the ΔCT method; data are presented as 2 − ΔΔCT. Fold change > 1.5 was deemed upregulation. XLOC_006390, HOTTIP-005, and RP11-567G11.1 were upregulated in 76.4% (110/144), 81.9% (118/144), and 66.7% (96/144) of PC tissue samples, respectively.
HOTTIP-005, XLOC_006390, and RP11-567G11.1 expression was increased in PC tissues
As an initial step, we sought to identify lncRNAs that were overexpressed in PC. As XLOC_006390, HOTTIP-005, and RP11-567G11.1 were the three most upregulated lncRNAs in PC tissues, we detected their expression levels in 144 cancer tissues and the paired adjacent non-tumorous tissues using qRT-PCR. The XLOC_006390, HOTTIP-005, and RP11-567G11.1 expression levels in the cancer tissues were all significantly higher than that in the non-tumorous tissues (Figure 3B–3D). The qRT-PCR sequencing of the products revealed that the HOTTIP-005, XLOC_006390, and RP11-567G11.1 sequences were consistent with that in the database (Supplementary Figure S2).
Correlation between PC clinical characteristics and HOTTIP-005, XLOC_006390, and RP11-567G11.1 expression
Fold change > 1.5 was deemed high expression; we found that HOTTIP-005, XLOC_006390, and RP11-567G11.1 were increased in 81.9% (118/144), 76.4% (110/144), and 66.7% (96/144) of PC tissues, respectively (Figure 3E–3G). Next, we determined whether HOTTIP-005, XLOC_006390, and RP11-567G11.1 expression was associated with the clinicopathological features of PC. Table 2 shows that HOTTIP-005 overexpression was associated with degree of pathological differentiation, lymphatic metastasis, and early recurrence. No statistical correlation with age, sex, carbohydrate antigen (CA) 19-9 level, T stage, or neural invasion was observed. XLOC_006390 expression levels were associated with neural invasion, while RP11-567G11.1 expression was associated with lymphatic metastasis and T stage. The other clinical characteristics showed no statistical relationship with XLOC_006390 and RP11-567G11.1 expression.
Table 2: Correlation of lncRNA expression and clinicopathological factors of patients with PC
Characteristics |
No. of patients |
HOTTIP-005 |
XLOC_006390 |
RP11-567G11.1 |
|||||||
|---|---|---|---|---|---|---|---|---|---|---|---|
low |
high |
P value |
low |
high |
P value |
low |
high |
P value |
|||
Total |
144 |
26 |
118 |
34 |
110 |
48 |
96 |
||||
Age (years) |
<60 |
70 |
12 |
58 |
0.782 |
16 |
54 |
0.836 |
23 |
47 |
0.906 |
≥60 |
74 |
14 |
60 |
18 |
56 |
25 |
49 |
||||
Gender |
Male |
102 |
18 |
84 |
0.843 |
21 |
81 |
0.183 |
32 |
70 |
0.437 |
Female |
42 |
8 |
34 |
13 |
29 |
16 |
26 |
||||
CA19-9 (U/ml) |
≤34 |
30 |
5 |
25 |
0.824 |
10 |
20 |
0.159 |
11 |
19 |
0.663 |
>34 |
114 |
21 |
93 |
24 |
90 |
37 |
77 |
||||
Differentiation |
Well |
21 |
10 |
11 |
0.001 |
8 |
13 |
0.188 |
11 |
10 |
0.132 |
Moderate |
68 |
9 |
59 |
16 |
52 |
20 |
48 |
||||
Poor |
55 |
7 |
48 |
10 |
45 |
17 |
38 |
||||
T stage |
T1 |
19 |
6 |
13 |
0.246 |
7 |
12 |
0.344 |
12 |
7 |
0.012 |
T2 |
52 |
9 |
43 |
11 |
41 |
16 |
36 |
||||
T3 |
73 |
11 |
62 |
16 |
57 |
20 |
53 |
||||
N stage |
N0 |
59 |
16 |
43 |
0.018 |
15 |
44 |
0.670 |
26 |
33 |
0.023 |
N1 |
85 |
10 |
75 |
19 |
66 |
22 |
63 |
||||
Neural invasion |
Negative |
69 |
14 |
55 |
0.504 |
23 |
46 |
0.008 |
20 |
49 |
0.288 |
Positive |
75 |
12 |
63 |
11 |
64 |
28 |
47 |
||||
Early recurrence |
No |
62 |
17 |
45 |
0.011 |
14 |
48 |
0.800 |
18 |
44 |
0.341 |
Yes |
82 |
9 |
73 |
20 |
62 |
30 |
52 |
||||
Bold values are statistically significant (p < 0.05).
Association between prognosis and HOTTIP-005, XLOC_006390, and RP11-567G11.1 expression
Univariate analysis of overall survival revealed that T stage (P = 0.038), Lymph node metastasis (P = 0.011), Early recurrence (P = 0.009), HOTTIP-005 expression (P < 0.001) and RP11-567G11.1 expression (P < 0.001) were prognostic indicators (Table 3). Multivariate analysis indicated that Lymph node metastasis (P = 0.009), Early recurrence (P = 0.007), HOTTIP-005 expression (P < 0.001) and RP11-567G11.1 expression (P = 0.003) were independent prognostic indicators for overall survival of patients with PC (Table 3).
Table 3: Univariate and multivariate Cox regression of prognostic factors for overall survival in pancreatic cancer
Parameter |
Univariate analysis |
Multivariate analysis |
||||
|---|---|---|---|---|---|---|
HR |
95% CI |
P |
HR |
95% CI |
P |
|
Age (<60 vs. ≥60) |
0.975 |
0.597–1.867 |
0.793 |
|||
Gender (Female vs. male) |
1. 527 |
0.785–1.986 |
0.492 |
|||
CA19-9 (U/ml) (≤34 vs. > 34) |
0.661 |
0.389–1.024 |
0.157 |
|||
Differentiation (Well vs. moderate vs. poor) |
0.978 |
0.953–1.003 |
0.085 |
|||
T stage (T1 vs. T2 vs. T3) |
1.606 |
1.184–2.192 |
0.038 |
1.389 |
1.236–3.546 |
0.072 |
N stage (N0 vs. N1) |
1.698 |
1.130–2.552 |
0.011 |
1.992 |
1.262–3.142 |
0.009 |
Neural invasion (Negative vs. Positive) |
2.451 |
1. 459–4. 098 |
0.063 |
1.613 |
0. 726–2. 527 |
0.162 |
Early recurrence (No vs. Yes) |
2. 391 |
1.431–4.159 |
0.009 |
2.128 |
1.233–3.673 |
0.007 |
HOTTIP-005 expression (low vs. high) |
3.881 |
2.202–6.840 |
<0.001 |
2.589 |
1.385–4.839 |
<0.001 |
XLOC_006390 expression (Low vs. high) |
1.464 |
0.935–2.292 |
0.096 |
0.930 |
0.582–1.486 |
0.762 |
RP11-567G11.1 expression (Low vs. high) |
3.279 |
2.148–5.004 |
<0.001 |
2.371 |
1.516–3.708 |
0.003 |
HR hazard ratio; 95% CI 95% confidence interval
Bold values are statistically significant (P < 0.05)
Kaplan–Meier survival analysis and log-rank testing showed that patients with low HOTTIP-005 expression had significantly increased overall survival as compared with patients with high HOTTIP-005 expression (n = 26 and 118, P < 0.0001). The same observation was made for RP11-567G11.1 expression (n = 34 and 110, P < 0.0001) (Figure 4A, 4B). While the overall survival rate was not associated with XLOC_006390 expression (n = 48 and 96, P = 0.051) (Figure 4C). The median survival time of high and low expression subgroup of HOTTIP-005, RP11-567G11.1, and XLOC_006390 is 14 and 45 months, 13 and 30 months, and 15 and 17 months respectively. These data indicate that increased HOTTIP-005 and RP11-567G11.1 expression are poor prognostic factors for patients with PC.
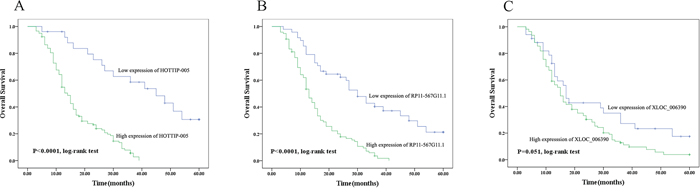
Figure 4: Prognostic significance of HOTTIP-005, XLOC_006390, and RP11-567G11.1 expression. Overall survival was compared between the groups with high and low expression of A. HOTTIP-005 (P < 0.0001, n = 118 and 26), B. RP11-567G11.1 (P < 0.0001, n = 110 and 34), and C. XLOC_006390 (P = 0.051, n = 96 and 48). The median survival time of high and low expression subgroup of HOTTIP-005, RP11-567G11.1, and XLOC_006390 is 14 and 45 months, 13 and 30 months, and 15 and 17 months respectively. Kaplan–Meier survival estimates and log-rank testing determined that increased HOTTIP-005 and RP11-567G11.1 expression predicts poor prognosis in PC.
Determining whether plasma/serum lncRNAs can serve as biomarkers
General characterization of plasma/serum lncRNA fragments
As the expression of HOTTIP-005 was the highest in PC tissues, and the RP11-567G11.1 sequence length was only 246 bp, rendering both lncRNAs easily detectable, we detected the HOTTIP-005 and RP11-567G11.1 expression levels in the plasma/serum from patients with PC to determine whether they could serve as effective and minimally invasive biomarkers. As there is no exact description of the general characterization of lncRNAs in plasma, we designed 10 and three primer pairs for HOTTIP-005 and RP11-567G11.1, respectively, to ensure that the amplicons would account for almost the entire transcript (1, Figure 5C, 5D); primer pairs 7 and 10 were HOTTIP-005–specific. Detection of the HOTTIP-005 and RP11-567G11.1 fragments in 10 PC plasma/serum samples revealed that the expression levels differed significantly among the fragments, but that the expression level of each fragment was relatively stable in each sample (Figure 5A, 5B).
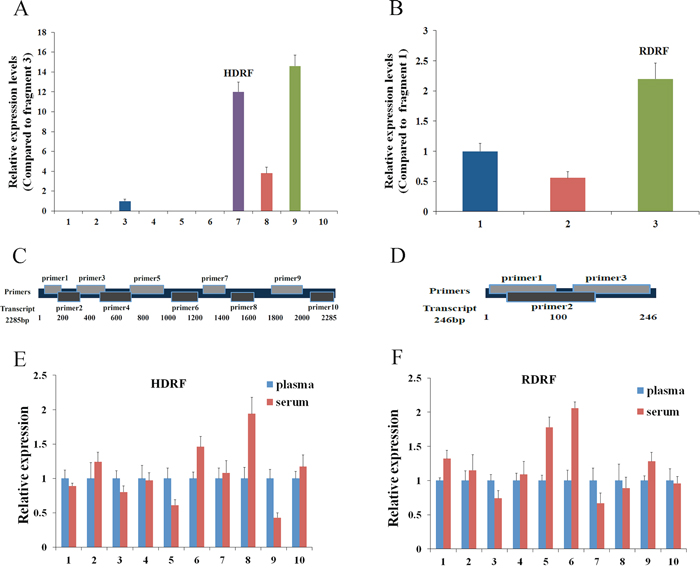
Figure 5: General characterization of plasma/serum lncRNA fragments. A. qRT-PCR assessment of HOTTIP-005 and B. RP11-567G11.1 fragment expression in 10 PC plasma samples. Amplicon 9 of HOTTIP-005 and amplicon 3 of RP11-567G11.1 were the most highly expressed fragments. C. HOTTIP-005 and D. RP11-567G11.1 primer design schematics. Comparison of E. HDRF and F. RDRF levels in plasma and serum. We used qRT-PCR to assess their expression levels in 10 independent samples. GAPDH was used as the normalization control.
Although the expression level of fragment 9 was the highest, we selected fragment 7, which was HOTTIP-005–specific, for further study. We also selected the RP11-567G11.1 fragment with the highest plasma expression level for further study. The fragments were designated HOTTIP-005–derived RNA fragment (HDRF) and RP11-567G11.1–derived RNA fragment (RDRF). In addition, sequencing the qRT-PCR products, which were termed HDRF and RDRF, proved that the amplicons were the intended fragments derived from HOTTIP-005 and RP11-567G11.1 (Supplementary Figure S3). Additionally, the targeted lncRNA fragments were stable in both plasma (EDTA as anticoagulant) and serum (Figure 5E, 5F). This result suggests that plasma and serum are both suitable for investigating lncRNA fragments as blood-based biomarkers.
We next investigated the stability of plasma HDRF and RDRF. The plasma from 5 patients with PC was exposed to harsh conditions, including storage at room temperature for 4, 8, and 24 h, incubation at −80°C, and eight repetitive freeze–thaw cycles. Overall, the treatments did not apparently affect the HDRF and RDRF, which could be stably detected from all samples (Figure 6). Therefore, our study suggests that plasma lncRNA fragments are stable and detectable, which provides a foundation for their evaluation as useful and minimally invasive cancer biomarkers.
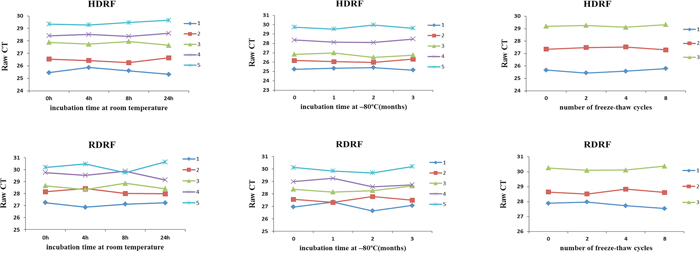
Figure 6: Stability of human plasma lncRNA fragments. HDRF (top) and RDRF (bottom) plasma levels remained stable following prolonged exposure to room temperature or −80°C, and multiple freeze–thawing.
Validation of the source of plasma HDRF and RDRF
First, we performed xenograft experiments to compare the plasma HDRF and RDRF expression levels of PC xenografts with control mice, where blood was collected at four weeks after injection. The qRT-PCR results demonstrated that the plasma HDRF and RDRF expression levels were significantly increased when PC developed (Figure 7A).
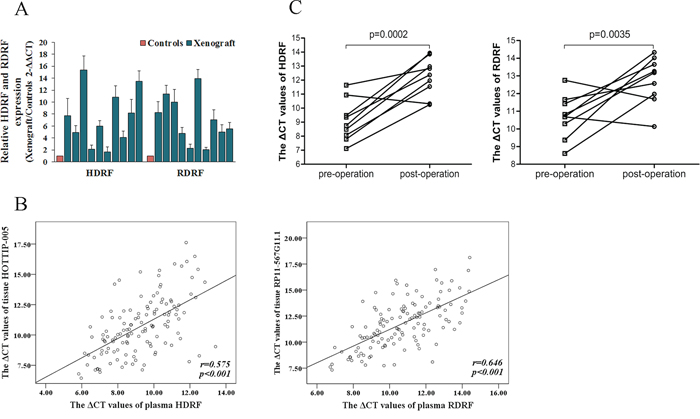
Figure 7: Source of human plasma lncRNA fragments. A. HDRF and RDRF detected in xenograft plasma (n = 10), all at distinctly higher levels than that of the controls (n = 10). B. Spearman’s rank correlation scatter plot of HOTTIP-005 and RP11-567G11.1 levels in PC tissues and plasma. Data were presented as ΔCt values. Expression levels of HOTTIP-005 and RP11-567G11.1 in PC tissues were significantly correlated with HDRF and RDRF levels in plasma. C. HDRF and RDRF expression levels in patients with PC before surgery and seven days after surgery (n = 9). HDRF and RDRF levels were all significantly decreased after surgery.
Second, we analyzed the correlation between HOTTIP-005 and RP11-567G11.1 expression level in PC tissues and HDRF and RDRF expression level in plasma. As shown in Figure 7B, a significant correlation was observed for HOTTIP-005 and HDRF (r = 0.575, P < 0.001), RP11-567G11.1 and RDRF (r = 0.646, P < 0.001), respectively.
Third, to further validate the high expression levels of the PC-derived HDRF and RDRF, we assessed the HDRF and RDRF expression levels in patients with PC before surgery and seven days after surgery (n = 9), and found that the plasma HDRF and RDRF levels were significantly decreased after surgery (Figure 7C). These findings all suggest that the high levels of HDRF and RDRF expression are derived from PC.
HDRF and RDRF as plasma-based biomarkers for diagnosing PC
To explore the potential role of HDRF and RDRF as plasma-based biomarkers for diagnosing PC, the HDRF and RDRF expression levels in plasma samples from 127 patients with PC and 122 healthy controls were measured using qRT-PCR. Compared to the controls, the HDRF and RDRF expression levels were significantly elevated in the patients (p < 0.0001) (Figure 8A). And the HDRF and RDRF levels were increased by an average of 9.59 and 6.78 fold-changes. Next, we constructed a receiver operating characteristic (ROC) curve by grouping all PC and normal samples into one class to examine the diagnostic performance of HDRF and RDRF. The areas under the ROC curves (AUC) were 0.857, 0.770, and 0.862 for HDRF, RDRF, and the combination of HDRF and RDRF, respectively (Figure 8B). The combined use of HDRF and RDRF slightly increased the diagnostic value. Further analysis of the diagnostic performance of HDRF and RDRF revealed that, at a cut-off of 11.4 and 11.925 (comparative threshold cycle [ΔCT] value), respectively, the sensitivity was 89% and 75.6% and specificity was 68.3% and 66.7%, respectively, for discriminating PC from non-PC. Our results indicate that HDRF and RDRF levels are promising indicators for distinguishing patients with PC from people without PC.
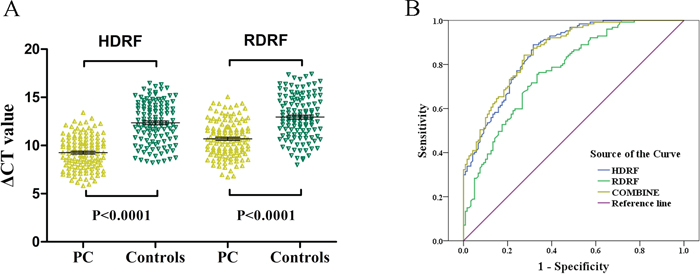
Figure 8: Validation of HDRF and RDRF as plasma-based biomarkers for detecting PC. A. Scatter plot showing the HDRF and RDRF ΔCT values as measured by qRT-PCR in 127 PC and 122 control plasma samples. Smaller ΔCT value indicates higher expression. GAPDH was used as the normalization control. B. ROC curves showing the diagnostic performance of HDRF and RDRF.
DISCUSSION
LncRNA expression profile of PC and its clinical significance
Several studies on lncRNA expression disorders in many cancer types have suggested that their abnormal expression might be a major cause of oncogenesis and that such cancers can be distinguished according to their altered lncRNA expression signatures [30, 31]. Microarray assay presents the possibility of efficient discovery of aberrantly expressed lncRNAs in different cancers. Recent reports have demonstrated that lncRNAs participate in PC development and progression by promoting cell growth, migration, invasion, and epithelial–mesenchymal transition [23, 25], indicating that they may play a critical role in the tumorigenesis of PC.
In this study, we describe an lncRNA expression profile associated with PC. We found that, among the significantly differentially expressed lncRNAs, HOTTIP-005, XLOC_006390, and RP11-567G11.1 were the most upregulated. A few studies have discovered the relationship between aberrant HOTTIP expression and hepatocellular carcinoma [16, 32, 33]. Recently, our research team and Cheng Y et al have reported that HOTTIP shows oncogenic-like activity in PC by enhances pancreatic cancer cell proliferation, survival and migration. But these two studies differ in the role of regulating HOXA13 [27, 34]. Nevertheless, XLOC_006390 and RP11-567G11.1 have not been identified in any cancers.
Intensive efforts have been expended to identify molecular predictive factors for survival in patients with cancer [35–37]. Our data show that HOTTIP-005, XLOC_006390, and RP11-567G11.1 are related to different clinicopathological features of PC and that HOTTIP-005 and RP11-567G11.1 overexpression are significantly correlated with lymph node metastasis and overall survival. Lymph node metastasis is an adverse pathological feature for overall survival in PC [38, 39]. Our results present the possibility that expression level of HOTTIP-005 and RP11-567G11.1 in tissues may serve as molecular prognostic biomarkers for selecting high-risk patients for further intensive treatment. Since the high lethality of PC, if we could find a biomarker that can potentially help in the early detection of this disease, the clinical significance will be greater. Therefore, we detected the level of HOTTIP-005 and RP11-567G11.1 fragments in plasma and the result will be discussed later.
We also found that XLOC_006390 overexpression was significantly correlated with neural invasion, a histopathological characteristic and an important prognostic factor of PC [40]. However, the mechanisms contributing to the perineural invasion and spread of cancer cells along the nerves remain poorly understood. This finding may indicate an approach for further research.
At present, serum CA19-9 is the only validated tumor marker for PC in widespread clinical use. But our statistical analysis showed that the overexpression of HOTTIP-005, XLOC_006390 and RP11-567G11.1 are all not correlated with it. For this result, we detailed analysis of the following reasons: First, CA19-9 and these lncRNAs are derived from different pathways, and they do not share the same mechanism of synthesis and secretion [41]. Second, the patients we enrolled were all at early stages that could undergo surgery, so these patients were not representative of patients with PC at all kind of stages. Furthermore, of patients with PC at early stages, the proportion that with elevated CA19-9 serum levels is very small [42, 43]. In order to research the relationship between CA19-9 levels and expression of these lncRNAs, maybe we should enroll patients with PC at different stages and perform Spearman’s rank correlation.
HOTTIP splice variant expression patterns in PC
Most lncRNAs have splice variants, but there are few studies on the expression pattern of these splice variants in different cancers. Consequently, the specificity and function of these expression patterns remain unknown. Shahryari et al. demonstrated that, in esophageal squamous cell carcinoma, two novel splice variants of SOX2OT: SOX2OT-S1 and SOX2OT-S2, are co-upregulated with SOX2 and OCT4, and suggested that SOX2OT splice variants partly participate in tumor initiation and/or progression [44].
The expression pattern of HOTTIP splice variants has never been detected in cancer tissue. Ours is the first attempt to identify them in PC, and we found that HOTTIP-005 and HOTTIP-001 are the first and second most upregulated splice variants in PC, respectively. However, whether the expression pattern is PC-specific remains unclear, as does its potential involvement in PC initiation and progression, and further work is needed to elucidate these areas.
The value of HOTTIP-005 and RP11-567G11.1 as plasma-based biomarkers for PC detection
Identifying proper biomarkers is a major aim in cancer research. The ideal biomarker should have the key characteristics of early detection, be minimally invasive, and have high specificity, sufficient sensitivity, and robustness. Several studies have investigated microRNAs in body fluids as potential biomarkers for the diagnosis or recurrence of PC. However, there is a lack of consistent results between these studies [45–47]. Recently, many studies have addressed the possible use of lncRNAs as biomarkers. However, most of them used tissue samples. And the diagnostic utility of circulating lncRNAs in PC has never been explored. As the lncRNA sequence length is very long, it is unlikely that lncRNAs exist in primary form in body fluids. Hence, we postulate that plasma lncRNAs probably exist in fragment form. Thereafter, our results, which are consistent with that of Ren et al. [20], validated this assumption.
To perform normal biological function, HOTTIP-005 and RP11-567G11.1 expression can be detected in normal tissues or cells, so it should be no surprise that the lncRNA-derived fragments HDRF and RDRF can also be detected in plasma of healthy subjects. However, the high levels of HDRF and RDRF were confirmed to derive from PC. In addition, we confirmed that HDRF and RDRF are stable. These features all present the possibility that HDRF and RDRF are diagnostic biomarkers of PC. Thus, the ROC analysis showed that as biomarkers, HDRF and RDRF both have relatively high sensitivity and specificity, especially HDRF. As the patients we enrolled were all at early stage of PC, it may explain the sensitivity and specificity of HDRF and RDRF was not so sufficiently high. To date, there is no specific biomarker for diagnosing PC, let alone early diagnosis; CA 19-9 is used as biomarker in the clinic generally. However CA 19-9 level testing has no utility as a screening tool in asymptomatic patients. Even among patients with symptoms suspicious for pancreatic cancer, elevated CA 19-9 is a poor predictor of pancreatic cancer with a predictive value of 0.5–0.9% [42]. This study aimed to improve this situation, detecting HDRF and RDRF or combining them with CA 19-9 may increase the efficiency of PC diagnosis. However, large-scale prospective studies are needed to further validate our findings.
MATERIALS AND METHODS
Ethics statement
Investigation has been conducted in accordance with the ethical standards and according to the Declaration of Helsinki and according to national and international guidelines and has been approved by the authors’ institutional review board. Prior to sample collection, we obtained informed consent from the patients and the healthy controls, and approval from the institutional ethics committees of Sun Yat-Sen Memorial Hospital.
Patients and sample collection
144 cases of PC specimens (tumor and paired adjacent non-tumorous tissues) and four cases of CP specimens were obtained from patients undergoing surgical resection at the Sun Yat-Sen Memorial Hospital of Sun Yat-sen University from July 2006 to June 2014. All samples were immediately preserved in liquid nitrogen after removal. The histopathological diagnoses of all patients were clear and definite. No patient had received any form of anti-cancer treatment before surgery. The clinical follow-up time ranged 3–60 months. Overall survival was defined as the interval from the date of diagnosis to PC-related death. The clinical characteristics of all patients are listed in Table 2.
Whole blood samples were collected from the abovementioned patients and from 130 healthy controls at the Sun Yat-Sen Memorial Hospital examination center. For serum collection, the blood samples were allowed to coagulate for about 30 min to 2 h at room temperature. EDTA was used as an anticoagulant for the plasma collection, and samples were processed within 1 h of blood collection. All samples were centrifuged at 2000 × g for 10 min at 4°C in a refrigerated centrifuge. The supernatant (plasma/serum) was transferred to a fresh tube, leaving behind a 0.5-cm layer of supernatant to avoid disturbing the pellet.
RNA isolation
Total RNA was extracted from fresh cultured PC cell lines or tissue samples using TRIzol (Invitrogen, Carlsbad, CA) according to the manufacturer’s instructions. Serum/plasma RNA extraction was performed using TRIzol LS (Invitrogen). Briefly, 300 μl serum/plasma was mixed with 900 μl TRIzol LS. After vortex-mixing for 30 sec and standing for 5 min, 200 μl chloroform was added. The TRIzol–chloroform mixture was vortex-mixed for 15 sec, and the supernatant was discarded after centrifuging at 12,000 × g for 15 min at 4°C. The mixture was centrifuged again following the addition of absolute ethyl alcohol to clean the precipitate. Lastly, 10 μl diethylpyrocarbonate-treated water was added to the dry precipitate to entirely dissolve the total RNA. The total RNA extracted from 1 ml plasma/serum is approximately < 500 ng. Samples yielding > 500 ng total RNA were excluded to avoid genomic DNA contamination. Of the plasma/serum from the 144 patients and 130 controls, the total RNA of an eventual 127 patients and 122 controls were used for the study.
LncRNA microarray analysis
We conducted lncRNA microarray analysis which was mentioned previous [27] on eight PC tissues (including four cases of diabetes mellitus–associated PC) and four chronic pancreatitis tissues utilizing a microarray targeting 7419 lncRNAs (Arraystar Human LncRNA Microarray V3; Agilent Technology, Santa Clara, CA). The Agilent microarray analysis protocol was used for sample labeling and array hybridization with minor modification. The raw data were analyzed utilizing Agilent Feature Extraction software. The robust multiarray average algorithm was used to adjust the background signals. Normalized data were obtained using the quantile method of intra-microarray normalization and the median method of baseline inter-microarray transformation between the microarrays. Differentially expressed genes with a raw expression level of > 400 in more than 4 out of the 12 samples used for profiling were extracted and ordered by p-value. The microarray platform and data were submitted to the Gene Expression Omnibus (GEO) public database at the National Center for Biotechnology Information (accession number: GSE61166, http://www.ncbi.nlm.nih.gov/geo/query/acc.cgi?acc=GSE61166).
qRT-PCR
Total RNA was converted to complementary DNA by reverse-transcription using oligodT primers and SuperScript II reverse transcriptase (Invitrogen). For qRT-PCR, three replicates per sample were amplified and analyzed using a Roche Light-Cycler (Basel, Switzerland). Reactions were carried out in a 20-μl volume using SYBR Green Reaction Mix (Qiagen Science, GER) with 0.5 mM primer. To detect the lncRNA expression levels in the tissues and PC cell lines, β-actin was used as the normalization control. There are no established endogenous plasma mRNA control values for normalizing plasma or serum lncRNA fragments. Therefore, to quantify plasma/serum lncRNA fragments, we first measured glyceraldehyde-3-phosphate dehydrogenase (GAPDH) and β-actin expression in the plasma/serum from 30 patients with PC and 30 healthy controls: GAPDH and β-actin were stably expressed in all plasma/serum samples (Supplementary Figure S4). However, plasma/serum GAPDH expression was higher than that of β-actin. Consequently, GAPDH was identified as a stable reference and used to normalize the plasma/serum lncRNA fragments. The relative gene expression levels were determined using the comparative threshold cycle (2 − ΔΔCT) method. All results are expressed as the means ± standard deviation of each independent experiment. The gene-specific sequence information of the qRT-PCR primers are listed in Supplementary Table S1.
Cell culture
The human PC cell lines PANC-1, BxPC-3, Capan2, MIAPaCa-2, SW1990, and AsPC-1 were purchased from American Type Culture Collection (Manassas, VA) and grown in complete growth medium, as recommended by the manufacturer, and with 10% fetal bovine serum and 1% penicillin/streptomycin. HPDE6 cells (immortalized human pancreatic ductal epithelial cells) were obtained from Dr. SN Zhang (Sun Yat-Sen University, Guangdong, China). All cells were cultured in a humidified 5% CO2 incubator at 37°C.
Xenograft experiments
All experiments involving animals were conducted according to the institutional guidelines of Guangdong Province and were approved by the Use Committee for Animal Care. SW1990 cells (3 × 10⁶, 200 μl) were injected subcutaneously into the dorsal flank of BALB/c nude mice (4–6 weeks old). The control mice received mock injections of 200 μl 50% basement membrane matrix in Hank’s balanced salt solution. Each of the two groups contained 10 mice. After four weeks, the mice were sacrificed and their blood was collected in EDTA-anticoagulant tubes by cardiac puncture.
Statistical analysis
The comparison of lncRNA expression levels between the groups was analyzed using Student’s t test. The correlation between lncRNA and clinicopathological characteristics was analyzed using the Pearson chi-square test. Overall survival was assessed using the Kaplan–Meier method; differences in survival rates were assessed with log-rank testing. A ROC curve was established to evaluate the diagnostic value of HDRF and RDRF. The AUC was used to assess the predictive power. All tests were two-sided, and p < 0.05 was considered statistically significant. All statistical analyses were performed using SPSS 18.0 and GraphPad Prism 5 software.
CONCLUSIONS
Our results suggest that HOTTIP-005 and RP11-567G11.1 are associated with the prognosis of PC, that HOTTIP-005 and RP11-567G11.1 fragments can be detected in human plasma in remarkably stable form, and that these fragments may have the potential to be used as biomarkers to distinguish PC from non-PC. Nevertheless, further large-scale and prospective studies are needed to confirm our findings.
ACKNOWLEDGMENTS AND FUNDING
This work was supported by Grant [2013]163 from Key Laboratory of Malignant Tumor Molecular Mechanism and Translational Medicine of Guangzhou Bureau of Science and Information Technology; Grant KLB09001 from the Key Laboratory of Malignant Tumor Gene Regulation and Target Therapy of Guangdong Higher Education Institutes.
CONFLICTS OF INTEREST
The authors declare that they have no financial conflict of interest.
GRANT SUPPORT
This work was supported by China Postdoctoral Science Foundation (2014M562242 to Y. X. Wang) and Natural Science Foundation of Guangdong Province, China (2015A030310489 to Y. X. Wang).
REFERENCES
1. Wolfgang CL, Herman JM, Laheru DA, Klein AP, Erdek MA, Fishman EK, Hruban RH. Recent progress in pancreatic cancer. CA: a cancer journal for clinicians. 2013; 63:318–348.
2. Siegel R, Ma J, Zou Z, Jemal A. Cancer statistics, 2014. CA: a cancer journal for clinicians. 2014; 64:9–29.
3. Jones S, Zhang X, Parsons DW, Lin JC, Leary RJ, Angenendt P, Mankoo P, Carter H, Kamiyama H, Jimeno A, Hong SM, Fu B, Lin MT, Calhoun ES, Kamiyama M, Walter K, et al. Core signaling pathways in human pancreatic cancers revealed by global genomic analyses. Science. 2008; 321:1801–1806.
4. Biankin AV, Waddell N, Kassahn KS, Gingras MC, Muthuswamy LB, Johns AL, Miller DK, Wilson PJ, Patch AM, Wu J, Chang DK, Cowley MJ, Gardiner BB, Song S, Harliwong I, Idrisoglu S, et al. Pancreatic cancer genomes reveal aberrations in axon guidance pathway genes. Nature. 2012; 491:399–405.
5. Waddell N, Pajic M, Patch AM, Chang DK, Kassahn KS, Bailey P, Johns AL, Miller D, Nones K, Quek K, Quinn MC, Robertson AJ, Fadlullah MZ, Bruxner TJ, Christ AN, Harliwong I, et al. Whole genomes redefine the mutational landscape of pancreatic cancer. Nature. 2015; 518:495–501.
6. Liang WS, Craig DW, Carpten J, Borad MJ, Demeure MJ, Weiss GJ, Izatt T, Sinari S, Christoforides A, Aldrich J, Kurdoglu A, Barrett M, Phillips L, Benson H, Tembe W, Braggio E, et al. Genome-wide characterization of pancreatic adenocarcinoma patients using next generation sequencing. PloS one. 2012; 7:e43192.
7. Yachida S, Jones S, Bozic I, Antal T, Leary R, Fu B, Kamiyama M, Hruban RH, Eshleman JR, Nowak MA, Velculescu VE, Kinzler KW, Vogelstein B, Iacobuzio-Donahue CA. Distant metastasis occurs late during the genetic evolution of pancreatic cancer. Nature. 2010; 467:1114–1117.
8. Birney E, Stamatoyannopoulos JA, Dutta A, Guigo R, Gingeras TR, Margulies EH, Weng Z, Snyder M, Dermitzakis ET, Thurman RE, Kuehn MS, Taylor CM, Neph S, Koch CM, Asthana S, Malhotra A, et al. Identification and analysis of functional elements in 1% of the human genome by the ENCODE pilot project. Nature. 2007; 447:799–816.
9. Lander ES, Linton LM, Birren B, Nusbaum C, Zody MC, Baldwin J, Devon K, Dewar K, Doyle M, FitzHugh W, Funke R, Gage D, Harris K, Heaford A, Howland J, Kann L, et al. Initial sequencing and analysis of the human genome. Nature. 2001; 409:860–921.
10. St Laurent G, Wahlestedt C, Kapranov P. The Landscape of long noncoding RNA classification. Trends in genetics : TIG. 2015; 31:239–251.
11. Mercer TR, Dinger ME, Mattick JS. Long non-coding RNAs: insights into functions. Nature reviews Genetics. 2009; 10:155–159.
12. Ponting CP, Oliver PL, Reik W. Evolution and functions of long noncoding RNAs. Cell. 2009; 136:629–641.
13. Ji P, Diederichs S, Wang W, Boing S, Metzger R, Schneider PM, Tidow N, Brandt B, Buerger H, Bulk E, Thomas M, Berdel WE, Serve H, Muller-Tidow C. MALAT-1, a novel noncoding RNA, and thymosin beta4 predict metastasis and survival in early-stage non-small cell lung cancer. Oncogene. 2003; 22:8031–8041.
14. Reis EM, Nakaya HI, Louro R, Canavez FC, Flatschart AV, Almeida GT, Egidio CM, Paquola AC, Machado AA, Festa F, Yamamoto D, Alvarenga R, da Silva CC, Brito GC, Simon SD, Moreira-Filho CA, et al. Antisense intronic non-coding RNA levels correlate to the degree of tumor differentiation in prostate cancer. Oncogene. 2004; 23:6684–6692.
15. Matouk IJ, DeGroot N, Mezan S, Ayesh S, Abu-lail R, Hochberg A, Galun E. The H19 non-coding RNA is essential for human tumor growth. PloS one. 2007; 2:e845.
16. Quagliata L, Matter MS, Piscuoglio S, Arabi L, Ruiz C, Procino A, Kovac M, Moretti F, Makowska Z, Boldanova T, Andersen JB, Hammerle M, Tornillo L, Heim MH, Diederichs S, Cillo C, et al. Long noncoding RNA HOTTIP/HOXA13 expression is associated with disease progression and predicts outcome in hepatocellular carcinoma patients. Hepatology. 2014; 59:911–923.
17. Kogo R, Shimamura T, Mimori K, Kawahara K, Imoto S, Sudo T, Tanaka F, Shibata K, Suzuki A, Komune S, Miyano S, Mori M. Long noncoding RNA HOTAIR regulates polycomb-dependent chromatin modification and is associated with poor prognosis in colorectal cancers. Cancer research. 2011; 71:6320–6326.
18. Poliseno L, Salmena L, Zhang J, Carver B, Haveman WJ, Pandolfi PP. A coding-independent function of gene and pseudogene mRNAs regulates tumour biology. Nature. 2010; 465:1033–1038.
19. Schmidt LH, Spieker T, Koschmieder S, Schaffers S, Humberg J, Jungen D, Bulk E, Hascher A, Wittmer D, Marra A, Hillejan L, Wiebe K, Berdel WE, Wiewrodt R, Muller-Tidow C. The long noncoding MALAT-1 RNA indicates a poor prognosis in non-small cell lung cancer and induces migration and tumor growth. Journal of thoracic oncology : official publication of the International Association for the Study of Lung Cancer. 2011; 6:1984–1992.
20. Ren S, Wang F, Shen J, Sun Y, Xu W, Lu J, Wei M, Xu C, Wu C, Zhang Z, Gao X, Liu Z, Hou J, Huang J. Long non-coding RNA metastasis associated in lung adenocarcinoma transcript 1 derived miniRNA as a novel plasma-based biomarker for diagnosing prostate cancer. Eur J Cancer. 2013; 49:2949–2959.
21. Shen M, Chen W, Yu K, Chen Z, Zhou W, Lin X, Weng Z, Li C, Wu X, Tao Z. The diagnostic value of PCA3 gene-based analysis of urine sediments after digital rectal examination for prostate cancer in a Chinese population. Experimental and molecular pathology. 2011; 90:97–100.
22. Hessels D, Klein Gunnewiek JM, van Oort I, Karthaus HF, van Leenders GJ, van Balken B, Kiemeney LA, Witjes JA, Schalken JA. DD3(PCA3)-based molecular urine analysis for the diagnosis of prostate cancer. European urology. 2003; 44:8–15. discussion 15–16.
23. Sun YW, Chen YF, Li J, Huo YM, Liu DJ, Hua R, Zhang JF, Liu W, Yang JY, Fu XL, Yan T, Hong J, Cao H. A novel long non-coding RNA ENST00000480739 suppresses tumour cell invasion by regulating OS-9 and HIF-1alpha in pancreatic ductal adenocarcinoma. British journal of cancer. 2014; 111:2131–2141.
24. Ma C, Nong K, Zhu H, Wang W, Huang X, Yuan Z, Ai K. H19 promotes pancreatic cancer metastasis by derepressing let-7′s suppression on its target HMGA2-mediated, EMT. Tumour biology : the journal of the International Society for Oncodevelopmental Biology and Medicine. 2014; 35:9163–9169.
25. Kim K, Jutooru I, Chadalapaka G, Johnson G, Frank J, Burghardt R, Kim S, Safe S. HOTAIR is a negative prognostic factor and exhibits pro-oncogenic activity in pancreatic cancer. Oncogene. 2013; 32:1616–1625.
26. Tahira AC, Kubrusly MS, Faria MF, Dazzani B, Fonseca RS, Maracaja-Coutinho V, Verjovski-Almeida S, Machado MC, Reis EM. Long noncoding intronic RNAs are differentially expressed in primary and metastatic pancreatic cancer. Molecular cancer. 2011; 10:141.
27. Li Z, Zhao X, Zhou Y, Liu Y, Zhou Q, Ye H, Wang Y, Zeng J, Song Y, Gao W, Zheng S, Zhuang B, Chen H, Li W, Li H, Fu Z, et al. The long non-coding RNA HOTTIP promotes progression and gemcitabine resistance by regulating HOXA13 in pancreatic cancer. Journal of translational medicine. 2015; 13:84.
28. Duell EJ, Lucenteforte E, Olson SH, Bracci PM, Li D, Risch HA, Silverman DT, Ji BT, Gallinger S, Holly EA, Fontham EH, Maisonneuve P, Bueno-de-Mesquita HB, Ghadirian P, Kurtz RC, Ludwig E, et al. Pancreatitis and pancreatic cancer risk: a pooled analysis in the International Pancreatic Cancer Case-Control Consortium (PanC4). Annals of oncology : official journal of the European Society for Medical Oncology / ESMO. 2012; 23:2964–2970.
29. Ekbom A, McLaughlin JK, Karlsson BM, Nyren O, Gridley G, Adami HO, Fraumeni JF Jr. Pancreatitis and pancreatic cancer: a population-based study. Journal of the National Cancer Institute. 1994; 86:625–627.
30. Esteller M. Non-coding RNAs in human disease. Nature reviews Genetics. 2011; 12:861–874.
31. Perez DS, Hoage TR, Pritchett JR, Ducharme-Smith AL, Halling ML, Ganapathiraju SC, Streng PS, Smith DI. Long, abundantly expressed non-coding transcripts are altered in cancer. Human molecular genetics. 2008; 17:642–655.
32. Tsang FH, Au SL, Wei L, Fan DN, Lee JM, Wong CC, Ng IO, Wong CM. Long non-coding RNA HOTTIP is frequently up-regulated in hepatocellular carcinoma and is targeted by tumour suppressive miR-125b. Liver international : official journal of the International Association for the Study of the Liver. 2014.
33. Mohamadkhani A. Long Noncoding RNAs in Interaction With RNA Binding Proteins in Hepatocellular Carcinoma. Hepatitis monthly. 2014; 14:e18794.
34. Cheng Y, Jutooru I, Chadalapaka G, Corton JC, Safe S. The long non-coding RNA HOTTIP enhances pancreatic cancer cell proliferation, survival and migration. Oncotarget. 2015; 6:10840–10852.
35. Lujambio A, Calin GA, Villanueva A, Ropero S, Sanchez-Cespedes M, Blanco D, Montuenga LM, Rossi S, Nicoloso MS, Faller WJ, Gallagher WM, Eccles SA, Croce CM, Esteller M. A microRNA DNA methylation signature for human cancer metastasis. Proceedings of the National Academy of Sciences of the United States of America. 2008; 105:13556–13561.
36. Gupta RA, Shah N, Wang KC, Kim J, Horlings HM, Wong DJ, Tsai MC, Hung T, Argani P, Rinn JL, Wang Y, Brzoska P, Kong B, Li R, West RB, van de Vijver MJ, et al. Long non-coding RNA HOTAIR reprograms chromatin state to promote cancer metastasis. Nature. 2010; 464:1071–1076.
37. Kleer CG, Cao Q, Varambally S, Shen R, Ota I, Tomlins SA, Ghosh D, Sewalt RG, Otte AP, Hayes DF, Sabel MS, Livant D, Weiss SJ, Rubin MA, Chinnaiyan AM. EZH2 is a marker of aggressive breast cancer and promotes neoplastic transformation of breast epithelial cells. Proceedings of the National Academy of Sciences of the United States of America. 2003; 100:11606–11611.
38. Yamamoto T, Yagi S, Kinoshita H, Sakamoto Y, Okada K, Uryuhara K, Morimoto T, Kaihara S, Hosotani R. Long-term survival after resection of pancreatic cancer: A single-center retrospective analysis. World journal of gastroenterology : WJG. 2015; 21:262–268.
39. Sho M, Murakami Y, Motoi F, Satoi S, Matsumoto I, Kawai M, Honda G, Uemura K, Yanagimoto H, Kurata M, Fukumoto T, Akahori T, Kinoshita S, Nagai M, Nishiwada S, Unno M, et al. Postoperative prognosis of pancreatic cancer with para-aortic lymph node metastasis: a multicenter study on 822 patients. Journal of gastroenterology. 2014.
40. Hirai I, Kimura W, Ozawa K, Kudo S, Suto K, Kuzu H, Fuse A. Perineural invasion in pancreatic cancer. Pancreas. 2002; 24:15–25.
41. Kannagi R. Carbohydrate antigen sialyl Lewis a—its pathophysiological significance and induction mechanism in cancer progression. Chang Gung medical journal. 2007; 30:189–209.
42. Kim JE, Lee KT, Lee JK, Paik SW, Rhee JC, Choi KW. Clinical usefulness of carbohydrate antigen -9 as a screening test for pancreatic cancer in an asymptomatic population. Journal of gastroenterology and hepatology. 2004; 19:182–186.
43. Chang CY, Huang SP, Chiu HM, Lee YC, Chen MF, Lin JT. Low efficacy of serum levels of CA 19-9 in prediction of malignant diseases in asymptomatic population in Taiwan. Hepato-gastroenterology. 2006; 53:1–4.
44. Shahryari A, Rafiee MR, Fouani Y, Oliae NA, Samaei NM, Shafiee M, Semnani S, Vasei M, Mowla SJ. Two novel splice variants of SOX2OT, SOX2OT-S1, and SOX2OT-S2 are coupregulated with SOX2 and OCT4 in esophageal squamous cell carcinoma. Stem Cells. 2014; 32:126–134.
45. Carlsen AL, Joergensen MT, Knudsen S, de Muckadell OB, Heegaard NH. Cell-free plasma microRNA in pancreatic ductal adenocarcinoma and disease controls. Pancreas. 2013; 42:1107–1113.
46. Morimura R, Komatsu S, Ichikawa D, Takeshita H, Tsujiura M, Nagata H, Konishi H, Shiozaki A, Ikoma H, Okamoto K, Ochiai T, Taniguchi H, Otsuji E. Novel diagnostic value of circulating miR-18a in plasma of patients with pancreatic cancer. British journal of cancer. 2011; 105:1733–1740.
47. Schultz NA, Dehlendorff C, Jensen BV, Bjerregaard JK, Nielsen KR, Bojesen SE, Calatayud D, Nielsen SE, Yilmaz M, Hollander NH, Andersen KK, Johansen JS. MicroRNA biomarkers in whole blood for detection of pancreatic cancer. Jama. 2014; 311:392–404.