
INTRODUCTION
Functioning at a branch point of metabolism, the thiamin diphosphate (ThDP)-dependent pyruvate dehydrogenase is an important target for metabolic regulation. Synthetic analogs of 2-oxo acids with a phosphonate or phosphinate group substituting for the leaving carboxyl group (P-analogs, Fig. 1), are potent inhibitors of (ThDP)-dependent dehydrogenases [1]. The high inhibitory power and selectivity of the P-analogs of 2-oxo acids to their cognate ThDP-dependent dehydrogenases are due to the formation of tightly bound transition state analog complexes after adduction of the P-analogs to the active site ThDP. Given the highly specific structure of enzymatic transition states, which differ also in the mechanistically similar ThDP-dependent 2-oxo acid dehydrogenases and decarboxylases, the binding of P-analogs is able to discriminate even close family members. The P-analogs of 2-oxoglutarate or pyruvate have also been shown to have orders of magnitude lower affinities to non-cognate dehydrogenases or non-ThDP-dependent enzymes (reviewed in [1]). Hence, selective inhibition of pyruvate dehydrogenase (PDH) in vivo may be achieved using P-analogs of pyruvate. Nevertheless, the potential of the P-analogs of pyruvate for directed metabolic regulation has not been systematically evaluated (reviewed in [1]).
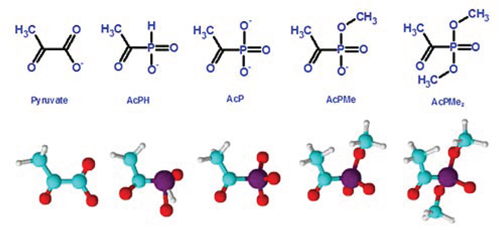
Figure 1: Structures of pyruvate and its synthetic analogs with the phosphinate or phosphonate group substituting for the leaving carboxyl group. The anions existing at physiological pH are shown. AcPH, acetyl phosphinate; AcP, acetyl phosphonate; AcPMe, methyl ester of acetyl phosphonate; AcPMe2, dimethyl ester of acetyl phosphonate.
Here, we use the P-analogs to resolve the controversy regarding the functional state of PDH in cancer cells. According to multiple reports, the PDH complex (PDHC) and its regulation by phosphorylation are important for oncotransformation [1–5]. However, it is unclear whether cancer cell proliferation requires PDH function or is, in contrast, associated with PDH inactivation. A non-functional phosphorylated PDH is a generally inferred hallmark of transformation [2, 3]. Indeed, increased expression of PDH kinases, which inactivate PDH by phosphorylation, has been reported in cancer cells, and is supposed to underlie mitochondrial dysfunction and the Warburg effect [2, 3]. In good accordance with this view, inhibition of PDH kinases by dichloroacetate [6] or other inhibitors [7] activated mitochondrial function and decreased proliferation of cancer cells. However, in other cases, activation of PDH kinases, leading to increased phosphorylation and inactivation of PDH, also impaired proliferation of cancer cells [5, 8]. Finally, highly active PDH was observed in some tumors [9, 10].
To resolve the question of the role of PDH function in cancer metabolism, the direct and selective inhibition of PDH by P-analogs of pyruvate provides advantages over the indirect action of PDH kinase effectors. Asides from the possibility that the PDH kinase effectors may also bind to other kinases, PDH kinase itself may have targets other than PDH, especially in cancer cells. Besides, interference with regulation of biological systems often shows non-monotonous dependence [11]; therefore the action of kinase effectors or of changed kinase expression may depend on the original level of expression of PDH kinases and phosphatases. All these factors may differ in metabolically heterogeneous cancer cells compared to non-transformed ones, leading to unsafe conclusions regarding the functional state of PDH in cancer, discussed above.
In this work, we characterized the action of P-analogs of pyruvate (Fig. 1) on mammalian systems: partially isolated enzymes (in vitro), mitochondria, and cell lines in culture (in situ). Comparative analysis showed that the phosphinate analog had a higher potential to inhibit mammalian PDH, either isolated or inside mitochondria, than the phosphonate analog. Although the negative charge of the P-analogs is essential for PDH inhibition, the membrane permeability of the uncharged precursor strongly increased the inhibitory power in cultured cells. The impact of the inhibitors on metabolism and viability of different cell lines was studied using metabolic profiling and cellular ATP assays. The action of P-analogs of pyruvate revealed that PDH function is essential for viability of different cell lines, including those of human embryonic kidney (HEK293) and highly malignant glioblastomas. The results expose the P-analogs of pyruvate as promising tools to reveal the metabolic impact of the PDH reaction in different cells and/or metabolic settings. The identification of cell-specific vulnerability to perturbation in the PDH metabolic checkpoint should provide important information for appropriate tailoring of antiproliferative treatments taking into account the metabolic heterogeneity of cancer cells.
RESULTS
Study of the synthetic pyruvate analogs in vitro
The inhibition of isolated PDHC from rat heart by different concentrations of acetyl phosphinate (AcPH) or the mono- (AcPMe) or di- (AcPMe2) methyl esters of acetyl phosphonate (Fig. 1) is shown in Fig. 2A. The rate of the overall PDHC reaction was measured after a short (1 min) preincubation of the enzyme with these P-analogs of pyruvate. The concentration of pyruvate (2 mM) was saturating, as indicated by published values of KmPyr = 0.02–0.14 mM for heart PDHC under a variety of conditions [12–14]. AcPH strongly inhibited PDHC in the 10−7–10−6 M concentration range (IC50~0.2 μM). Despite possessing the same charge (−1), AcPMe was substantially less inhibitory (IC50~0.6 mM under identical conditions), and AcPMe2, which is uncharged, had little effect (Fig. 2A). Increasing the preincubation time with AcPH led to a further decrease in activity (Fig. 2B). Although preincubation as such did not affect PDHC, after 5 min preincubation with 0.15 μM AcPH more than 80% of the PDHC activity disappeared, as assayed at 2 mM pyruvate. This further decreased IC50 (to less than 0.1 μM, not shown). The time-dependent inactivation was much more pronounced with AcPH compared to AcPMe and AcPMe2. That is, under otherwise identical conditions, after 5 min of PDHC preincubation in the potassium phosphate buffer, pH 7.6, the assay at 2 mM pyruvate revealed more than 90% activity loss in the presence of 0.5 μM AcPH, whereas 50 μM AcPMe and AcPMe2 decreased activity by only approximately 30% and 10%, respectively (data not shown).
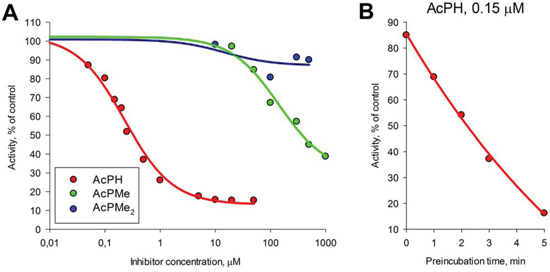
Figure 2: Inhibitory action of AcPH, AcPMe and AcPMe2 on isolated PDHC. The reaction was started with 2 mM pyruvate after PDHC from rat heart had been preincubated at 37°C in 50 mM MOPS buffer (pH 7.6) containing 1 mM MgCl2, 1 mM CaCl2, 1 mM ThDP, 0.05 mM CoA, 2.5 mM NAD+, 1 mM DTT and indicated inhibitor concentrations. A. Concentration dependences of PDHC activity on the indicated inhibitors after 1 min preincubation. Non-linear regression to a hyperbolic function was made using SigmaPlot 12.0. B. Time-dependent inhibition of the overall PDHC activity by AcPH. PDHC was preincubated as described above with 0.15 μM AcPH, followed by the reaction start with 2 mM pyruvate at the indicated times. Velocities were measured from the linear part of the product accumulation curves during 0.5–3.5 min of the reaction. Inhibition is presented as % of control activity in the absence of AcPH. Non-linear regression to an exponential decay function was made using SigmaPlot 12.0.
The inactivation by AcPH in the preincubation medium was not reversed by pyruvate during the subsequent assay. This is seen from the lack of a detectable lag-period in the product accumulation curves after pyruvate addition to AcPH-inactivated PDHC (Fig. 3A). Linearity of the product accumulation curves in the presence of AcPH or AcPMe (Fig. 3A, 3B) also indicates that no additional inactivation occurred with either of the P-analogs after pyruvate was added to the inhibitor-containing medium. Thus, pyruvate protects PDHC from further inactivation by AcPH in the reaction medium (no decrease in the reaction rate during the assay in Fig. 3A), but cannot restore the activity already lost during the preincubation with AcPH (no lag-period in Fig. 3A). As a result, only negligible activity was assayed after preincubation with AcPH, independent of the pyruvate concentration in the reaction medium (Fig. 3C). In contrast, competition with pyruvate was seen after preincubation with AcPMe (Fig. 3D), confirming that the inhibition is largely reversible in this case. Thus, when the irreversible process does not dominate the decrease in PDH activity in the presence of the P-analogs, their competition with pyruvate at the active site is seen. However, under the experimental set-up when competition kinetics is compromised by an irreversible loss of PDHC activity, as occurs upon preincubation with AcPH, a 10-fold difference in the pyruvate concentration does not significantly affect the final level of inhibition (Fig. 3C).
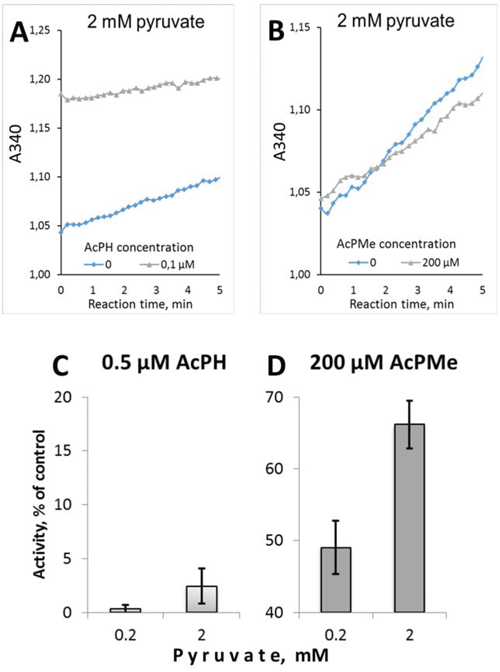
Figure 3: Irreversibility of PDHC inhibition upon preincubation with AcPH and AcPMe. Assays were performed at 37°C in 30 mM potassium phosphate (pH 7.0) containing 3 mM NAD+, 0.05 mM CoA, 2 mM DTT, 0.4 mM ThDP, 2 mM MgCl2 and indicated concentrations of pyruvate and inhibitors. A, B. Representative product accumulation curves in the presence or absence of the pyruvate P-analogs. Reactions were started by addition of 2 mM pyruvate after PDHC was preincubated for 5 min at 37°C in pyruvate-free assay medium without (grey triangles) or with (blue diamonds) the inhibitors indicated on the figures. C, D. Dependence of inhibition by AcPH or AcPMe on pyruvate added after 5 min preincubation with the inhibitors.
No significant tissue-specific differences in the action of AcPH or AcPMe were revealed when PDHC from liver or heart were tested, in good accordance with the mechanism of action of the inhibitors, dependent on the universal catalytic mechanism of the 2-oxo acid dehydrogenases. We also tested the P-analogs of pyruvate on the other members of the protein family, the 2-oxoglutarate dehydrogenase and branched-chain 2-oxo acid dehydrogenase complexes (OGDHC and BCODHC), which were isolated from liver. Preincubation of the OGDHC or BCODHC with 0.05 mM AcPH, which inhibited PDHC more than 80% at saturating pyruvate (Fig. 2A), did not significantly inhibit the OGDHC or BCODHC. Even at half-saturation with 2-oxoglutarate, i.e. at 0.2 mM 2-oxoglutarate, which is comparable to the enzyme KmOG = 0.1–0.2 mM [15–17], OGDHC was not inhibited by 0.05 mM AcPH, and increasing AcPH to 0.2 mM inhibited OGDHC by only 20%. At 0.5 mM 3-methyl-2-oxovalerate (Km ~ 0.02 mM [18]), BCODHC was inhibited by approximately 20% at 0.05–0.2 mM AcPH. These results are consistent with a high degree of AcPH specificity in inhibiting the cognate PDHC. AcPMe did not inhibit OGDHC or BCODHC under the same conditions.
Action of the synthetic pyruvate analogs in alamethicin-permeabilized mitochondria
To better understand the action of AcPH and AcPMe in complex biological systems, where, in particular, no preincubation of PDHC with analogs is possible due to the permanent presence of pyruvate, the PDHC activity was assayed in alamethicin-permeabilized mitochondria. In this set of experiments, inhibitors and substrate were presented simultaneously, and the initial rates were recorded, to allow analysis of the PDHC interaction with inhibitors when irreversible inactivation was not promoted (Fig. 4). Pyruvate (0.05–1 mM) was titrated at different concentrations of AcPH (0.001–0.5 μM) or AcPMe (10–50 μM) (Fig. 4A, 4B). The reciprocal plots showed that both inhibitors are competitive with pyruvate, since they increased KmPyr without changing maximal velocity (Fig. 4C, 4E). Inhibition constants (Ki) were calculated by plotting Kmapp/Vmaxapp at several values of AcPH and AcPMe against inhibitor concentration. The kinetic parameters obtained in Fig. 4 are summarized in Table 1. As expected from the data obtained with the partially isolated PDHC, AcPH was more potent than AcPMe, Ki values were 0.1 μM and 40 μM, respectively (Fig. 4D, 4F). In accordance with the in vitro data, the P-analogs of pyruvate also failed to inhibit activity of the OGDHC in isolated permeabilized mitochondria (data not shown).
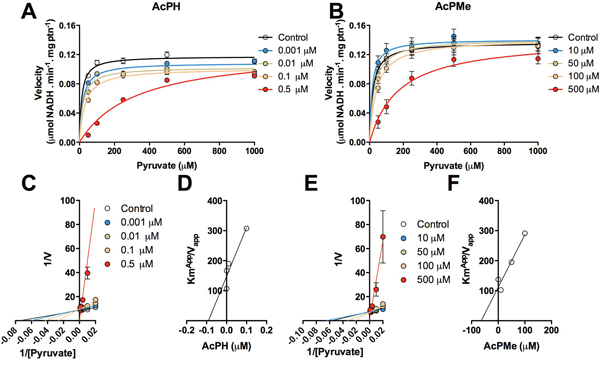
Figure 4: Kinetics of inhibition of PDHC by AcPH and AcPMe in alamethicin-permeabilized mitochondria from rat skeletal muscle. The reaction was started by addition of mitochondria. Michaelis-Menten plots show the dependence of PDHC activity on pyruvate (50, 100, 250, 500, 1000 μM) at different concentrations of AcPH (A) and AcPMe (B) Each inhibitor was loaded into separate 96 well plates. Endogenous calibration curves to measure the NADH reduction in each of the plates were used. Variation in the control Vmax values between different plates, preparations and/or permeabilization of mitochondria was insignificant (within 10%). Double-reciprocal plots of the data presented in (A) and (B) reveal competition between pyruvate and AcPH (C) or AcPMe (E). for binding to PDHC. Secondary inhibition plots were built to determine Ki for AcPH (D) and AcPMe (F).
Table 1: Kinetic analysis of inhibition by AcPH and AcPMe of intramitochondrial PDHC without preincubation with the analogs
AcPH |
AcPMe |
||
|---|---|---|---|
Vmax(μmol NADH/(min × mg protein)) |
Ki (μM) |
Vmax(μmol NADH/(min × mg protein)) |
Ki(μM) |
0.1 |
0.1 |
0.13 |
40 |
Inhibitor concentration (μM) |
Kmapp (μM) |
Inhibitor concentration (μM) |
Kmapp (μM) |
0 |
12.5 |
0 |
18.7 |
0.001 |
18.1 |
10 |
14.4 |
0.01 |
19.4 |
50 |
27.5 |
0.1 |
31.0 |
100 |
41.1 |
0.5 |
324.2 |
500 |
173.4 |
Vmax and Km data were obtained by non-linear regression of the experimental dependences presented in Figures 4A, 4B, to the Michaelis-Menten equation using Prism 5.0 software (Graphpad). Ki is the x-axis intercept when plotting apparent Km (Kmapp) obtained at different inhibitor concentrations divided by Vapp against AcPH and AcPMe concentrations (Figure 4F).
Action of synthetic pyruvate analogs in cell cultures
The influence of the P-analogs of pyruvate on the viability of cultured cells, measured by the luciferase assay of cellular ATP levels, is shown in Fig. 5. The parameters for the ATP decreases after a fixed (5 h) preincubation time with different concentrations of P-analogs are presented in Table 2. At lower concentrations of the inhibitors, a slight increase in ATP levels or a delay in the ATP response were observed. Although these deviations were rarely statistically significant, the correlation coefficients of non-linear regression analysis (R2, Table 2) improved when the increase or lag phase were omitted from the regression. In these cases, the extrapolated y0 values of regression curves could deviate from 100% (Fig. 5), with the increases in y0 up to 150% (Table 2) supporting a complex kinetics of the initial response of cellular ATP levels to the PDH inhibitors. Remarkably, the difference between the inhibitory power of AcPH and AcPMe upon cellular incubation with the P-analogs (Fig. 5, Table 2) was minor compared to that observed in vitro (Fig. 2, 3) and in permeabilized mitochondria (Fig. 4, Table 1). Moreover, all cells were strongly impaired by the uncharged AcPMe2 (Fig. 5, Table 2), which was inactive on the isolated enzyme (Fig. 2A). Thus, cellular permeability of the charged P-analogs AcPH and AcPMe could limit their intracellular inhibition of PDHC, while uncharged membrane-permeable AcPMe2, which could be de-esterified by intracellular enzymes, is highly effective in cell culture.
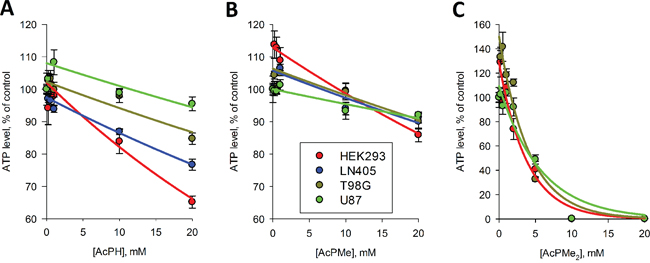
Figure 5: Influence of AcPH (A) AcPMe (B) and AcPMe2 (C) on total ATP levels of different cell cultures. Cells were incubated with the indicated inhibitors for 5 h in HBSS. The color code and cell lines tested are shown on the graphs in order of decreased cellular sensitivity to the inhibitors. Non-linear regression to an exponential equation was made by SigmaPlot 12.0, with the regression parameters presented in Table 2. When observed, an increase in ATP levels in response to low concentrations of the inhibitors was excluded from the non-linear regression, which was justified by better correlation coefficients R2.
Table 2: Parameters of the regression of experimental ATP decrease in cells incubated with AcPMe, AcPH and AcPMe2 to the exponential equation
Inhibitors |
AcPMe |
AcPH |
AcPMe2 |
||||||
|---|---|---|---|---|---|---|---|---|---|
Cells |
y0 |
k |
R2 |
y0 |
k |
R2 |
y0 |
k |
R2 |
HEK293 |
113 |
0.013 |
0.984 |
102 |
0.022 |
0.990 |
128 |
0.261 |
0.985 |
LN405 |
106 |
0.008 |
0.876 |
97 |
0.012 |
0.966 |
- |
- |
- |
T98G |
106 |
0.008 |
0.985 |
103 |
0.008 |
0.880 |
150 |
0.244 |
0.957 |
U87 |
100 |
0.005 |
0.882 |
108 |
0.007 |
0.926 |
109 |
0.175 |
0.937 |
The approximated curves and conditions are given in Figure 5.
It is also obvious from Fig. 5A, 5B and regression constants in Table 2 that the PDHC inhibitors AcPH and AcPMe affected ATP levels more strongly in HEK293 cell cultures than in glioblastoma cell lines. As seen from values of k in Table 2, the difference was especially obvious when HEK293 and U87 cell lines were compared, and persisted also when the membrane-permeable AcPMe2 was applied. The cell-specific sensitivity to the P-analogs of pyruvate exposes the varied metabolic impact of PDHC inhibition on viability of different cell lines.
Action of AcPH on the cell metabolome
In the metabolomics study, we aimed to detect the primary action of PDHC inhibition on the cellular metabolome. Therefore, we exposed cells to a low concentration of AcPH, which was chosen as the best structural analog of pyruvate (Fig. 1), inhibiting PDH at 10−7 M concentrations (Figs. 2, 3) and directly, i.e. not requiring intracellular activation. These features of AcPH were advantageous for reproducible metabolomics analysis of the primary changes, because interpretation of the action of a stronger inhibitor of cellular viability AcPMe2 would be complicated by the time- and concentration-dependent intracellular formation of multiple inhibitory species (AcPMe and fully de-esterified acetyl phosphonate (AcP), Fig. 1) from the precursor. As seen from Fig. 6A, the incubation with 0.5 mM AcPH for 5.5 h significantly changed many cellular metabolites in all glioblastoma cell lines, despite no detectable changes in an ATP-based viability assay (Fig. 5A). Obviously, the viability decrease results from multiple primary and secondary metabolic changes, while the metabolomics changes reflect initial perturbation due to PDHC inhibition. As expected, pyruvate and amino acids that are degraded through pyruvate, i.e. Ala, Gly, Ser, Thr, were strongly accumulated, whereas the TCA cycle intermediate citrate for which the PDHC product acetyl-CoA is a precursor, and the citrate transformation product 2-oxoglutarate were strongly decreased. The lower level of 2-oxoglutarate was coupled to a strong decrease in glutamate. The levels of fumarate and malate were significantly decreased, while aspartate was significantly increased in all cell lines studied. Several other amino acids, organic acids, sugars, sugar alcohols, AMP and nicotinamide changed in response to AcPH (Fig. 6A). However, unlike the predictable consequences of PDHC inhibition, these changes seem to be more dependent on cell-specific metabolism. To compare the metabolic profiles of the non-treated cell lines, the levels of metabolites in the two cell lines (T98G and LN405) were related to those in the third one (U87) used as a reference. The resulting heat map presented in Fig. 6B exposes the cell-specific differences in the steady-state levels of the detected metabolites. For instance, lower levels (blue scale) of fructose, isomaltose, mannitol and erythritol are observed in the non-treated LN405 cells, compared to the non-treated U87 and T98G cells (Fig. 6B). In the cells treated with AcPH, these metabolites strongly decrease in U87 and T98G cell lines, but are not responsive to the treatment in LN405 cell line (Fig. 6A). Thus, original differences in cellular metabolism cause cell-specific responses to AcPH. As a result, comparative metabolomics indicates that all cell lines show similar response to AcPH of pyruvate and its metabolic partners linked through the TCA cycle (metabolites in the upper part of Fig. 6A). However, extension of these perturbations to other pathways, such as those defining the levels of sugars and nucleotides (metabolites in the lower part of Fig. 6A), occurs according to the cell-specific metabolism, expressed in different metabolic profiles of the non-treated cells (Fig. 6B).
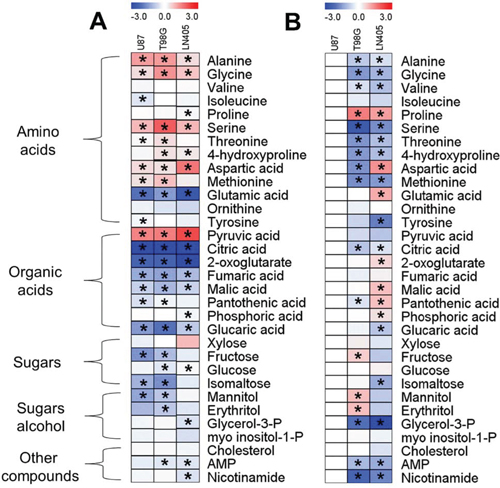
Figure 6: Comparative metabolic profiling of glioblastoma cell lines treated with 0.5 mM AcPH for 5.5 h (a) and under control conditions (B). A. Fold changes in the metabolite levels of AcPH-treated T98G, U87 or LN405 cell lines, compared to untreated controls. B. Metabolic difference between untreated cell lines is presented as the fold changes in metabolite levels of the T98G or LN405 lines, compared to the U87 line.
Analysis of transcriptomics data
For three out of four cell lines tested with the PDHC inhibitors in our experiments, the global Affymetrix gene expression levels are available from the Gene Expression Omnibus (GEO) database. It was therefore interesting to compare cellular sensitivity to the PDHC inhibitors with the expression of relevant genes. Signal intensities of annotated genes of interest, extracted from the database, are presented in Table 3. Apart from the well-known genes for the PDHC components (PDHA1, PDHB, DLAT, PDHX, DLD) and its phosphorylation system (pyruvate dehydrogenase kinases PDK1–3 and phosphatases PDP1–2) shown in Table 3, we included in the analysis a testis-specific isoform of PDHA, PDHA2, a regulatory subunit of the pyruvate dehydrogenase phosphatase, PDPR, and PDK4. However, none of the cell cultures expressed significant levels of mRNAs for PDHA2, PDPR and PDK4, owing to which they were not included in Table 3. Compared to the HEK293 cell line, glioblastoma cell lines U87 and T98G are characterized by significantly lower expression of the genes for the protein components and phosphorylation system of PDHC (Table 3). Nevertheless, the ratio of the first (PDHA1+PDHB) and second (DLAT) components of PDHC is similar in HEK293 and T98G lines, favoring the catalytic competence of PDHC in both lines. In contrast, a detectable signal of mRNA for the second complex component DLAT was repeatedly absent in different analyses of the U87 line (Table 3), suggesting that the overall PDHC reaction, which requires all the complex components, is impaired in U87 cells.
Table 3: Transcriptomics data on the components of PDHC and selected monocarboxylate transporters in the cell lines used in this study
Category |
Cell line \ mRNA |
HEK293 (11) |
T98G (7) |
U87 (11) |
|||
|---|---|---|---|---|---|---|---|
median ± SEM |
median ± SEM |
ttest (with HEK293) |
median ± SEM |
ttest (with HEK293) |
ttest (with T98G) |
||
PDHC catalytic and assembly components |
PDHA1 |
0.472 ± 0.050 |
0.050 ± 0.041 |
0.0003 |
0.051 ± 0.032 |
0.0001 |
0.4780 |
PDHB |
0.148 ± 0.014 |
0.024 ± 0.013 |
0.0000 |
0.043 ± 0.018 |
0.0001 |
0.0823 |
|
DLAT |
0.157 ± 0.032 |
0.014 ± 0.011 |
0.0055 |
0.000 ± 0.001 |
0.0001 |
0.0002 |
|
DLD |
0.241 ± 0.024 |
0.148 ± 0.054 |
0.0035 |
0.067 ± 0.021 |
0.0000 |
0.0000 |
|
PDHX |
0.131 ± 0.011 |
0.059 ± 0.024 |
0.0003 |
0.023 ± 0.007 |
0.0000 |
0.0006 |
|
PDHC regulatory components |
PDK1 |
0.009 ± 0.010 |
0.008 ± 0.004 |
0.0984 |
0.002 ± 0.004 |
0.1030 |
0.3568 |
PDK2 |
0.024 ± 0.006 |
0.004 ± 0.003 |
0.0236 |
0.000 ± 0.001 |
0.0013 |
0.0734 |
|
PDK3 |
0.015 ± 0.003 |
0.000 ± 0.001 |
0.0043 |
0.001 ± 0.000 |
0.0005 |
0.4215 |
|
PDP1 |
0.019 ± 0.005 |
0.036 ± 0.011 |
0.2346 |
0.008 ± 0.005 |
0.0796 |
0.0849 |
|
PDP2 |
0.014 ± 0.002 |
0.000 ± 0.000 |
0.0004 |
0.001 ± 0.000 |
0.0000 |
0.1580 |
|
Pyruvate and/or lactate carriers |
SLC16A1 |
0.384 ± 0.028 |
0.042 ± 0.035 |
0.0000 |
0.020 ± 0.011 |
0.0000 |
0.0375 |
SLC16A7 |
0.012 ± 0.003 |
0.012 ± 0.009 |
0.1714 |
0.001 ± 0.001 |
0.0086 |
0.0156 |
|
SLC16A8 |
0.000 ± 0.000 |
0.087 ± 0.043 |
0.0001 |
0.166 ± 0.045 |
0.0001 |
0.2213 |
|
SLC16A3 |
0.000 ± 0.000 |
0.000 ± 0.000 |
0.0331 |
0.001 ± 0.000 |
0.0032 |
0.3387 |
|
MPC1 |
0.174 ± 0.018 |
0.039 ± 0.016 |
0.0000 |
0.051 ± 0.018 |
0.0001 |
0.2724 |
|
MPC2 |
0.164 ± 0.025 |
0.067 ± 0.037 |
0.0198 |
0.209 ± 0.053 |
0.3819 |
0.0327 |
|
The relative expression levels of mRNAs of the annotated genes of interest were extracted from global transcriptomics data deposited in the GEO database. The numbers of experiments used for the calculations of median and SEM values are shown in parentheses.
Because AcPH and AcPMe (Fig. 1) are structural analogs of pyruvate carrying the same charge (-1), they may use and/or block the pyruvate carriers. Besides, cellular resistance to PDHC inhibition may be affected by the ability to extrude lactate which accumulates along with pyruvate due to lactate dehydrogenase-catalyzed reduction of pyruvate. Relative expression of the genes for relevant monocarboxylate transporters and parameters of their substrate specificity according to [19] are presented in Tables 3 and 4, respectively. The expression data (Table 3) show that signals of mRNA for SLC16A1 (MCT1), coding for the major cellular monocarboxylate transporter, and the two subunits of the hetero-oligomeric pyruvate transporter of the inner mitochondrial membrane, MPC1 and MPC2, are proportional to those of the rate-limiting component of PDHC, (PDHA1+PDHB). The protein product of the SLC16A7 (MCT2) gene is a minor carrier which is, however, very specific for pyruvate, preferring it over lactate (Table 4). Expression of SLC16A7 is similar in HEK293 and T98G but much lower in U87 cells (Table 3). Expression of highly-specific lactate transporters SLC16A8 (MCT3) and SLC16A3 (MCT4), which prefer lactate over pyruvate (Table 4), is pronounced in glioblastoma cell lines T98G and U87, but not detectable in HEK293 cells (Table 3).
Table 4: Substrate specificity of some SLC16 family members
Gene (Alt. name) |
Kmpyruvate (mM) |
Kmlactate (mM) |
Km2-hydroxybutyrate (mM) |
Kmacetoacetate (mM) |
|---|---|---|---|---|
SLC16A1 (MCT1) |
0.7 |
4.5 |
2.6 |
5.5 |
SLC16A7 (MCT2) |
0.08 |
0.74 |
ND |
0.8 |
SLC16A8 (MCT3) |
ND |
6 |
ND |
ND |
SLC16A3 (MCT4) |
153 |
28 |
56 |
216 |
Km values for pyruvate, L-lactate, D,L-2-hydroxybutyrate and acetoacetate are given from [19]. ND – no detectable transport was observed.
DISCUSSION
Mechanism of P-analog inhibition of mammalian PDHC
Inhibition of PDHC by P-analogs of pyruvate has been studied using bacterial and plant enzymes [20–24]. In the present work, using mammalian PDHC from different tissues, we reveal that certain features of the mechanism of action and structure-function relationship of the inhibitors are common for pyruvate dehydrogenases from all clades. First, the analogs compete with pyruvate binding at the active site (Fig. 4), and the phosphinate analog (AcPH) is orders of magnitude more potent than the phosphonate analog with the same charge -1 (AcPMe) (Fig. 2A, Fig. 4 and Table 1). The difference may be due to lower steric hindrance for the ThDP reaction with the carbonyl group near the phosphinate residue compared to the phosphonate, and a higher effective positive charge on the phosphorus in phosphinates than phosphonates [1]. Second, the non-charged dimethylated phosphonate analog, AcPMe2, inhibits poorly in vitro (Fig. 2A). Thus, to mimic pyruvate binding to PDHC, analogs need a negative charge. However, similar to the phosphonate analogs of 2-oxoglutarate [25, 26], the non-charged AcPMe2 is active in cells (Fig. 5C). Obviously, intracellular activation of this precursor by esterases forms the charged inhibitory species AcPMe (charge -1) and AcP (charge -2) (Fig. 1).
Dependence of the maximal inhibitory effect of the most potent inhibitor, AcPH, on its preincubation with PDHC (Fig. 2B) is the third feature of P-analog inhibition, common for mammalian, plant and bacterial systems. Studies on bacterial PDHC showed that during preincubation the first inhibitory complex between AcPH and PDH undergoes a transformation, resulting in a slowly dissociating, yet fully reversible, binding of the inhibitor to PDH [20, 24]. In contrast, the slow dissociation of AcPH does not occur in mammalian PDH, since there is no slow reactivation in reaction medium, indicating that excess pyruvate fails to restore the activity lost during preincubation with AcPH (Figs. 2B, 3C). Only when pyruvate is present during phosphonate binding is PDHC protected from inactivation by AcPH (Fig. 3A), and only then is AcPH inhibition of PDHC satisfactorily described by reversible competition with pyruvate at the active site of PDH (Fig. 4, Table 1). Thus, irreversible inactivation upon preincubation with AcPH (Fig. 2A, 3A, 3C), also noted for commercial PDHC from bovine heart [22], distinguishes mammalian PDHC from the bacterial enzyme [20, 24]. Due to the irreversible inactivation, mammalian PDHC is much more sensitive to AcPH (nearly complete inhibition after 5 min at 10−7 M, Figs. 2B, 3C) than the bacterial enzyme (only 50% inhibition after 10 min at 10−7 M [20]). Species-specific irreversible effects of the phosphonate analogs of other 2-oxo acids include dilution-resistant inhibition of plant OGDHC by phosphonate analogs of 2-oxoglutarate [27, 28] and irreversible inactivation of benzoylformate decarboxylase by a phosphonate analog of benzoylformate, where the C-P bond of the bound phosphonate breaks, phosphorylating the active site serine [29]. An analogous mechanism of AcPH-dependent phosphorylation of the active site of PDH may irreversibly inactivate mammalian PDHC, where a serine residue near the pyruvate-binding site is phosphorylated by PDH kinase 1, inactivating PDH. The phosphorylation and pyruvate binding are mutually exclusive [30–33], as are the AcPH-induced inactivation and pyruvate binding (see above). Unlike mammalian PDH, the bacterial enzyme has no phosphorylatable serine residue near the pyruvate binding site and is not inactivated by regulatory phosphorylation. The data may explain the irreversible action of AcPH on mammalian (Figs. 2B, 3A, 3C), but not bacterial [20] PDHC, favoring the AcPH-dependent phosphorylation of the mammalian PDH active site.
Earlier in vitro tests of interactions of the pyruvate P-analogs with other pyruvate-transforming enzymes indicated that binding of P-analogs to aminotransferases and lactate dehydrogenase is weak and unlikely to contribute to the action of the analogs at in vivo concentrations of pyruvate [1]. Nevertheless, the small size of AcPH and AcPMe could allow their accommodation in the active sites of 2-oxo acid dehydrogenases other than PDH, such as 2-oxoglutarate dehydrogenase and branched-chain 2-oxo acid dehydrogenase, which form tight inhibitory complexes with the P-analogs of their specific substrates. However, we showed that, compared to the PDHC inhibition, OGDHC or BCODHC were inhibited insignificantly (≤ 20%) even at orders of magnitude higher concentrations of the P-analogs of pyruvate. Thus, our data strongly support selective binding of the P-analogs of pyruvate to PDHC in vivo.
Comparison of inhibition by P-analogs in vitro and in situ
Whereas the IC50 of AcPH and AcPMe was about 3000-fold different with partially isolated PDHC even after a short (1 min) preincubation with inhibitors (Fig. 2A), in the pyruvate-containing milieu in situ the difference decreased to 400-fold for intramitochondrial PDHC (Ki, Table 1) and 1.5-fold for intracellular PDHC (k, Table 2). The relative effectiveness of AcPMe2 was also different in vitro and in situ. Able to penetrate the cell membrane without a carrier, uncharged AcPMe2 was the strongest inhibitor of cellular viability (Table 2, Fig. 5), although it did not inhibit PDH in vitro (Fig. 2A). Similar to other esterified pro-drugs, AcPMe2 obviously gives rise to the active charged species after intracellular transformation by esterases. Thus, in addition to the pyruvate-induced protection from the irreversible inactivation of PDHC by AcPH, the similar potency of AcPH and AcPMe in cells is obviously due to limited intracellular delivery of these negatively charged inhibitors. Our analysis of expression of the carriers that transport pyruvate into the cell and the mitochondrial matrix (Tables 3, 4) revealed correlations with the sensitivities to the P-analogs of pyruvate. As seen from Table 3, the major transporters of pyruvate into cells (SLC16A1) and mitochondria (MPC1+MPC2) are expressed proportionally to the PDH subunits (PDHA1+PDHB), suggesting expression to be a measure of the physiologically linked processes of pyruvate influx and degradation. Lower expression of SLC16A7 in U87 versus HEK293 and T98G (Table 3) agrees with a lower sensitivity of U87 to AcPH and AcPMe, compared to HEK293 and T98G (Fig. 5, Table 2). In view of lactate accumulation upon PDHC inhibition, the ability of cancer cells to extrude lactate faster through higher expression of SLC16A8, aided by SLC16A3 in U87 cells (Table 3), may also contribute to the higher resistance to the P-analogs of the glioblastoma vs HEK293 cell lines (Fig. 5, Table 2). Note that our metabolic profiling did not consistently detect lactate in glioblastoma cell lines. The undetectable level of this metabolite, including in cells treated with AcPH, where pyruvate and alanine are accumulated (Fig. 6A), suggests rapid lactate extrusion. As a result, the presence of pyruvate protecting from irreversible inactivation by AcPH, the uptake of the P-analogs and lactate export may contribute to the different relative sensitivities of isolated (Fig. 2A) and cellular (Fig. 5) PDHC to AcPH, AcPMe and AcPMe2.
AcPH and AcPMe as tools to understand metabolic transformation in cancer
The functional state of PDHC in cancer is a matter of controversy. On one hand, PDHC is supposed to be down-regulated in cancer due to phosphorylation [2]. This is supported by several findings. For instance, the trans-activation of the gene for PDH kinase isoform 1 (PDK1) by HIF-1 is induced in hypoxia [34]; the phosphorylation-induced activation of PDK1 by oncogenic mitochondrial Tyr kinases is under the control of tumor regulators Myc and HIF-1 [35], and an inhibitor of PDH kinase, dichloroacetate, negatively affects tumor growth, which correlates with PDH activation [6, 36, 37]. However, as mentioned in the Introduction, in other studies, proliferation of cancer cells was impaired concomitant with activation of PDH kinases [5, 8].
Our analysis of expression of PDHC components (Table 3) revealed that highly malignant glioblastoma cells (U87 and T98G) had lower expression of PDHC than immortalized, but benign HEK293 cells, which is in accordance with a lower impact of PDHC inhibitors on cellular viability in U87 and T98G vs HEK293 cells (Fig. 5, Table 2). Remarkably, however, except for DLAT in U87 cells, all other catalytic and regulatory components of PDHC as well as pyruvate transporters are expressed at similar ratios in HEK293 and glioblastoma cells (Table 3). The expression suggests a functional significance of PDHC, which agrees with the effects of the PDH inhibitors on the viability indicator ATP and metabolic profiles of the glioblastoma cells (Figs. 5, 6). Undetectable expression in U87 cells of the core component of PDHC, DLAT (Table 3), suggests impairment in the overall PDHC reaction in these cells, because DLAT is required for the complex assembly and DLAT-mediated catalysis [38, 39]. Decreased function of PDHC in U87 cells agrees with a lower decrease in U87 viability upon PDHC inhibition (Fig. 5), compared to T98G and HEK293 cells expressing the full set of the PDHC enzymatic components. However, AcPH significantly changes the metabolic profile even in U87 cells (Fig. 6A), and the membrane-permeable AcPMe2 strongly decreases the U87 viability (Fig. 5C). These findings suggest that some of the PDHC-catalyzed reactions that do not require DLAT and usually are considered as non-physiological side reactions may be important for U87 viability. An example of such a reaction is formation of acetoin, which is catalyzed by PDH, and greatly increases in some tumors [9, 10]. Thus, varied cellular sensitivity to inhibitors of PDHC (Fig. 5) correlates with different cellular expression of PDHC components (Table 3). The metabolic heterogeneity of glioblastoma cells in regard to oxidative decarboxylation of pyruvate is supported by varied transcript levels of the PDHC components and related transporters (Table 3) and different metabolic profiles of these cells (Fig. 6B). For example, significantly lower levels of most of the TCA cycle-degraded amino acids and citrate in T98G cells compared to U87 cells suggest different regulation of the PDHC junction to the TCA cycle in these cells, extended to the differences in metabolism of sugars (fructose, mannitol, erythritol) and other metabolites (AMP, nicotinamide).
The data obtained in this (Figs. 5, 6A) and other [40] studies indicate that cell viability, as measured by ATP levels, decreased at much higher concentrations of the inhibitors (Fig. 5) and/or longer inhibition time [40] than needed to induce significant metabolic perturbation (Fig. 6A, [40]). Moreover, metabolic responses of cells to lower concentrations of damaging factors are not adequately reflected by decreases in ATP levels, as such factors may increase ATP levels. When cytotoxic necrotizing factor 1 acted on intestinal cells, ATP increased concomitant with elevation of oxidative phosphorylation [41]. Upon cellular exposure to metabolic inhibitors, a decrease in cellular ATP levels was preceded by a significant increase when OGDHC was inhibited in cultured neurons [40] and in our experiments on PDHC inhibition (Fig. 5, Table 2), which showed simultaneous decreases in AMP levels by metabolic profiling (Fig. 6A). Along with the high (approximately 90%) level of adenine nucleotide phosphorylation in the resting state [42, 43], the observed increases in ATP (Fig. 5), decreases in AMP (Fig. 6A) and disturbed nucleic acid maintenance [40] in the metabolically challenged cells suggest that the ATP increases in the perturbed cells reflect changes in the adenine nucleotide pool size. If changes in cellular ATP levels are indicators of general destabilization of metabolism due to drug-induced metabolic changes, ATP levels may not only decrease, but also increase (Fig. 5) during initial damage.
Our data on the response of different cell lines to PDH inhibitors (Figs. 5, 6) clearly show that PDH is not disabled, but important for the viability of glioblastoma cells. Genetic background of the cell-specific metabolism is an important factor potentially contributing to the different cellular sensitivity to PDH inhibitors.
MATERIALS AND METHODS
Synthesis of pyruvate analogs
Sodium acetylphosphinate was synthesized according to [21]. Phosphinic acid (50 wt.% in H2O) (6.6 ml, 50 mmol) was evaporated at 1 mm Hg at ambient temperature to remove water. Triethyl orthoacetate (18.84 g, 21.3 ml, 116 mmol) was added dropwise under argon. Dry HCl was passed through the solution under vigorous stirring until it became cloudy. The reaction mixture was stirred overnight at ambient temperature under argon, followed by evaporation at 1 mm Hg to remove volatiles. NaOH (3 g, 75 mmol) in 40 ml degassed water was added dropwise at 0°C under argon. The resulting solution was refluxed under argon for 2 h. After cooling, the pH was adjusted to 8.0 with concentrated HCl, and the solution was evaporated to dryness. The residue was triturated with 70 ml of boiling absolute ethanol. After filtration ethanol was evaporated to dryness and the residue was recrystallized from absolute ethanol. The resulting sodium (1,1-diethoxyethyl) phosphinate contained 6 mol% NaH2PO2 as impurity based on NMR 1H and 31P spectra: NMR 1H (400 MHz, D2O), δ, ppm: 7.06 (d, J 518.0 Hz, 2H,). NMR 31P (161.9 MHz, D2O), δ, ppm: 7.1. The yield of sodium (1,1-diethoxyethyl)phosphinate was 22%, m.p. 182–185°C. NMR 1H (400 MHz, D2O), δ, ppm: 6.89 (d, J 515.9 Hz, 1H, HP), 3.74 (q, J 7.1 Hz, 4H, OCH2CH3), 1.41 (d, J 11.0 Hz, 3H, CCH3), 1.22 (t, J 7.1 Hz, 6H, OCH2CH3); NMR 13C (100.6 MHz, D2O), δ, ppm: 100.8 (d, J 144.1 Hz, CCH3), 57.9 (d, J 6.8 Hz, OCH2CH3), 17.4 (d, J 11.0 Hz, CCH3), 14.6 (OCH2CH3); NMR 31P (161.9 MHz, D2O), δ, ppm: 21.5.
Sodium (1,1-diethoxyethyl)phosphinate (1 g, 4.9 mmol) was dissolved in a mixture of 9.5 ml glacial acetic acid and 0.5 ml water. The solution was stirred at ambient temperature for 24 h. The solvent was evaporated to dryness; the residue was triturated with 30 ml of acetone and filtered off to give sodium acetylphosphinate as a white solid. At this step, the yield was 96%, with the final compound containing 6 mol% NaH2PO2 as impurity (based on NMR 1H and 31P spectra). NMR spectra showed that a solution of sodium acetylphosphinate in D2O contains up to 30% sodium (1,1-dihydroxyethyl)phosphinate (hydrated form): NMR 1H (400 MHz, D2O), δ, ppm: 6.73 (d, J 510.2 Hz, 1H, HP), 1.48 (d, J 10.4 Hz, 3H, CCH3); NMR 13C (100.6 MHz, D2O), δ, ppm: 93.7 (d, J 140.0 Hz, CCH3), 21.6 (d, J 13.5 Hz, CCH3); NMR 31P (161.9 MHz, D2O), δ, ppm: 25.4. NMR spectra of the same sample in DMSO-d6 demonstrate no hydrated form. The following characteristic peaks of sodium acetylphosphinate were observed: NMR 1H (400 MHz, D2O), δ, ppm: 6.84 (d, J 546.5 Hz, 1H, HP), 2.46 (d, J 4.3 Hz, 3H, C(O)CH3); NMR 13C (100.6 MHz, D2O), δ, ppm: 223.6 (d, J 108.8 Hz, C(O)CH3), 27.2 (d, J 46.4 Hz, C(O)CH3); NMR 31P (161.9 MHz, D2O), δ, ppm: 12.6. NMR 1H (400 MHz, DMSO-d6), δ, ppm: 6.54 (d, J 495.2 Hz, 1H, HP), 2.10 (d, J 2.8 Hz, 3H, C(O)CH3); NMR 31P (161.9 MHz, DMSO-d6), δ, ppm: 10.6.
O,O’-Dimethyl acetylphosphonate was obtained according to [44]. A mixture of dimethyl phosphite (3.3 g, 2.75 ml, 30 mmol) and ethyl vinyl ether (3.24 g, 4.3 ml, 45 mmol) was added dropwise to acetyl chloride (4.71 g, 4.27 ml, 60 mmol) stirred at 0°C. The mixture was stirred at ambient temperature for 48 h. Products were purified by vacuum distillation. Yield: 3.3 g (72%), b.p. 47–48°C/0.9 mm. NMR 1H (400 MHz, CDCl3), δ, ppm: 3.84 (d, J 10.8 Hz, 6H, (CH3O)2P(O)), 2.46 (d, J 5.3 Hz, 3H, C(O)CH3); NMR 31P (161.9 MHz, CDCl3), δ, ppm: −1.0.
O-Methyl sodium acetylphosphonate was prepared according to [45]. To a stirred solution of O,O’-dimethyl acetylphosphonate (1.52 g, 10 mmol) in dry acetone (10 ml) a solution of sodium iodide (11 mmol, 1.65 g) in dry acetone (5 ml) was added dropwise. The reaction mixture was stirred for 18 h at ambient temperature. The precipitate was filtered off, washed with dry acetone (2 ml) and dried in vacuo. Yield: 1.5 g (94%), m.p. 190–191°C. NMR 1H (400 MHz, DMSO-d6), δ, ppm: 3.34 (d, J 10.0 Hz, 3H, (CH3O)P(O)), 2.15 (d, J 3.5 Hz, 3H, C(O)CH3); NMR 13C (100.6 MHz, D2O), δ, ppm: 220.1 (d, J 163.6 Hz, C(O)CH3), 52.9 (d, J 5.9 Hz, (CH3O)P(O)), 30.3 (d, J 49.7 Hz, C(O)CH3); NMR 31P (161.9 MHz, DMSO-d6), δ, ppm: −0.5.
Enzyme purification
PDHC was partially purified from heart or liver of Wistar rats by modifications of published procedures [46–48]. The tissues were stored frozen at −70°C. Except where indicated, purification was at 4°C, and the pH of the buffers was adjusted at room temperature. The buffers were then cooled to 4°C.
PDHC from heart was isolated using ~8 g of tissue, cut in pieces with scissors and homogenized in 1.5 volumes of isolation buffer A, comprising 0.03 M HEPES, 1 mM EDTA, 0.15 M KCl, 3 mM dithiothreitol (DTT), 1 mM phenylmethanesulfonyl fluoride (PMSF), 1 mM AEBSF, 0.8 μM aprotinin, 50 μM bestatin, 20 μM leupeptin and 10 μM pepstatin pH 7.4. An IKA homogenizer at maximum velocity was used to disperse the tissue, followed by several strokes in a Potter-Elvehjem homogenizer. The homogenate was diluted 2 times with isolation buffer A containing 1% (v/v) Triton X-100 then centrifuged for 20 min at 10,000 g. The pellet was suspended in 5 volumes of isolation buffer A, and the homogenate was centrifuged as above. Combined supernatants were filtered through four layers of cheesecloth, and 35% (w/v) polyethylenglycol (PEG)-6000 solution was added to a final concentration of 1% (w/v). After stirring for 30 min, the suspension was centrifuged for 40 min at 10,000 g. PEG was increased in the supernatant to 4.5% (w/v), and the suspension centrifuged as above. The pellet was dissolved in 1.5 volumes of isolation buffer B, comprising 0.03 M HEPES, 0.1 mM EDTA, 0.1% (v/v) Triton X-100, 0.1 M KCl, 3 mM DTT, 10 mM MgSO4, 1 mM AEBSF, 0,8 μM aprotinin, 50 μM bestatin, 20 μM leupeptin and 10 μM pepstatin, pH 7.4, and incubated at 37°C for 20 min. Incubation with magnesium ions allows full activation of PDHC and BCODHC through dephosphorylation. After cooling, the suspension was brought to 3% (w/v) in PEG-6000 and stirred for 30 min, followed by a 40 min centrifugation at 10,000 g. The pellet was resuspended in one volume of isolation buffer C, comprising 0.03 M potassium phosphate buffer, 0.1 mM EDTA, 10% (v/v) glycerol, 0.15 M KCl, 3 mM DTT, 1 mM AEBSF, 0.8 μM aprotinin, 50 μM bestatin, 20 μM leupeptin and 10 μM pepstatin, pH 7.5. PDHC was stored at −20°C for 2 months without significant loss of activity.
OGDHC and BCODHC were also partially purified from rat livers stored frozen at −70°C, by a modification of a published method [48]. Frozen tissue (~40 g) was cut in pieces with scissors and homogenized in one volume of isolation buffer D, comprising 0.05 M MOPS, 2.7 mM EDTA, 1 mM benzamidinium chloride and 1 mM PMSF, pH 7.0, in a Potter-Elvehjem homogenizer. The homogenate was diluted with one volume of isolation buffer D containing 6% (v/v) Triton X-100, and pH was adjusted to 6.8. The homogenate was centrifuged for 20 min at 10,000 g. The pellet was resuspended in one volume of isolation buffer D and centrifuged as above. Combined supernatants were filtered through four layers of cheesecloth and adjusted to pH 6.45 with 10% (v/v) acetic acid followed by addition of 0.12 volumes of 35% (w/v) PEG-6000. After stirring for 30 min, the suspension was centrifuged for 20 min at 18,500 g. The pellet was dissolved in 100 ml isolation buffer D and adjusted to pH 6.8 with 5 M NaOH at 20°C. Insoluble material was removed by centrifugation at 18,500 g for 30 min at 20°C. The supernatant was filtered from fat and left at 4°C overnight. Next morning the supernatant was adjusted to pH 7.0 and 1 M MgCl2 was added to a final concentration of 13 mM. The supernatant was incubated on a water bath at 30°C for 5 min. After cooling, cytochalasin D was added to 1 μg/ml. The ionic strength was increased by addition of 1 M potassium dihydrogen phosphate, pH 6.3, to 50 mM. The pH was adjusted to 6.45 with 10% (v/v) acetic acid followed by addition of 0.12 volumes of 35% (w/v) PEG-6000. After stirring for 30 min, the suspension was centrifuged for 30 min at 18,500 g. The resulting pellet was suspended in a minimal volume of isolation buffer E comprising 0.05 M MOPS, 2.7 mM EDTA, 1 mM benzamidinium chloride, 1 mM phenylmethanesulfonyl fluoride (PMSF), 1 mM leupeptin, 20 μM AEBSF and 1% (v/v) Triton X-100, pH 7.0. The suspension was adjusted to pH 6.8 with 5M NaOH at 20°C. Insoluble material was removed by centrifugation at 18,500 g for 40 min and supernatant containing PDHC, OGDHC and BCODHC was stored at −20°C for 3 months without significant loss of OGDHC activity.
Overall reactions of partially purified PDHC, OGDHC and BCODHC were tested spectrophotometrically at 340 nm by NADH production as specified in the figure legends.
Mitochondrial isolation and permeabilization
5–10 week old female Wistar rats were from Charles River Laboratories fed chow ad libitum and with free access to water. Mitochondria were isolated from hind limb skeletal muscle at 4°C in Chappell-Perry buffer (CP1; 50 mM Tris, 100 mM KCl and 2 mM EGTA, pH 7.4 at 4°C) by standard procedures [49] and kept on ice until used. Protein was measured by the biuret method. The animal protocol was approved by the Buck Institute Animal Care and Use Committee in accordance with IACUC standards. Mitochondria were permeabilized according to [50]. Briefly, intact mitochondria (35 mg mitochondrial protein/ml) were diluted 20-fold in 10 mM HEPES, 0.25 M sucrose, 0.2 mM EDTA, 2.5 mM MgCl2, 40 μg/ml alamethicin, and 1 mg/ml fatty acid-free bovine serum albumin, pH 7.4 at 25°C, and incubated for 5 min at room temperature. The suspension was diluted 2.5-fold in the same buffer lacking MgCl2, alamethicin and albumin, then centrifuged at 30,000 g for 15 min. The permeabilized mitochondria were resuspended in ice-cold 10 mM HEPES, 0.25 M sucrose and 0.2 mM EGTA, pH 7.4 at 4°C, and stored on ice until use. Protein was redetermined using the same method.
Mitochondrial PDHC and OGDHC activity
NADH fluorescence was measured according to [51] in a 96-well Pherastar microplate reader at λexcitation = 340 nm, λemission = 460 nm. Permeabilized mitochondria (0.1 mg mitochondrial protein/ml) were suspended at 37°C in 180 μl of 3 mM HEPES, 120 mM KCl, 1 mM EGTA, 5 mM KH2PO4, 2 mM MgCl2, 0.3% (w/v) fatty acid-free bovine serum albumin, pH 7.4 at 37°C, containing 0.3 mM ThDP, 0.9 mM CaCl2, 4 μM rotenone, 0.2 mM NAD+ and 0.14 mM CoASH. Total Ca2+ values were calculated using the software MaxChelator [52] to give 10 μM targeted free Ca2+. Reaction was started by pipetting the suspension described above into a plate previously loaded with different concentrations of pyruvate and pyruvate analogs shown in Fig. 4. OGDHC-dependent NADH production was measured titrating different concentrations of 2-oxoglutarate (0.05, 0.1, 0.2, 0.5 1 mM) over the same concentration of AcPH and AcPMe as in the PDH reaction (Fig. 4). Data on inhibition by AcPH and AcPMe were obtained using two separate mitochondrial preparations, with each activity point corresponding to a mean ± SEM of 3–6 technical replicates. There was a lag of ~ 0.5–1 min between loading the plate and starting the run. After that, the rate over the first minute was used to calculate the rate of NADH reduction. In control wells (without inhibitors) all NAD+ was reduced to NADH after 15–20 min, and the difference between initial and final fluorescence was used to calibrate the scale.
Cellular studies
HEK293 and human glioblastoma cell lines LN405, T98G, U87 were obtained from the American Type Culture collection (LGC Standards GmbH; Wesel, Germany). Cells at a density of 2.5 × 10⁴ cells/ml, 200 μl per well, were seeded on microplates (Greiner, μClear, black clear bottom) in DMEM (4.5 g/L glucose, 10% FCS, 2 mM Glutamax, containing antibiotics). Medium was exchanged 24 h later for 100 μl per well of Hanks’ solution (HBSS) (1 g/L glucose, 0.37 M NaCl, 5.4 mM KCl, 0.25 mM Na2HPO4, 0.44 mM KH2PO4, 1.3 mM CaCl2, 1.0 mM MgSO4, 4.2 mM NaHCO3). P-analogs of pyruvate were added at different concentrations (0.2, 0.5, 1.0, 10 and 20 mM). 5 h later ATP levels were determined using the CellTiterGlo assay system (Promega, Heidelberg, Germany) according to manufacturer’s recommendations as described previously [40]. Concentration dependence data were obtained by averaging luminescence from six wells, and % of the ATP levels in the treated vs control cells were used to characterize the effects of the analogs on cellular viability.
Transcriptomics data analysis
To estimate the relative expression of different PDHC components, cellular monocarboxylate carriers (SLC16 family) and mitochondrial pyruvate carrier in relevant cells, we extracted the data on expression of proteins of interest from global mRNA expression experiments in the NCBI GEO database [53]. The expression in HEK293 cell line was from series GSE50547 (experiments GSM1221013, GSM1221014 and GSM1221015), GSE1822 (experiments GSM31805 and GSM31806), GSE1364 (experiments GSM22069, GSM22070 and GSM22071) and GSE1455 (experiments GSM24493, GSM24494 and GSM24495), in T98G cell line – from series GSE8537 (experiment GSM211868), GSE1692 (experiments GSM29233, GSM29234 and GSM29235) and GSE4218 (experiments GSM96274, GSM96275 and GSM96276) and in U87 cell line – from series GSE35169 (experiments GSM862922, GSM862923 and GSM862924, GSE9200 (experiment GSM231724), GSE1923 (experiments GSM34592, GSM34593 and GSM34594) and GSE53014 (experiments GSM1280363, GSM1280365, GSM1280374 and GSM1280376).
Fluorescence signals, which are background-corrected, scaled (normalized) and statistically analyzed by different algorithms (MAS 5.0, RMA or Limma), were extracted from the GEO database. Most of the data (series GSE50547, GSE1822, GSE8537, GSE1692, GSE35169, GSE9200 and GSE1923) were processed using the modern Affymetrix algorithm Microarray Suite version 5.0 (MAS 5.0). MAS 5.0 defines the signal for gene i as the anti-log of the robust average (Tukey’s biweight) of Eq 1:
(1)
where PMij is the signal intensity values in the “perfect match” cells. CTij is defined as a quantity equal to “mismatch” (MM) values when MMij < PMij, but adjusted to be less then MM when PMij » PMij.
The Robust Multi-array Average (RMA) algorithm was used in older Affymetrix platforms. It does not use the “mismatch” values and summarizes the “perfect match” values using the median polish function. This method of data processing was used in series GSE1364, GSE1455 and GSE4218. Linear Models for Microarray Data (Limma) was used for processing the data from Agilent platforms (series GSE53014).
To compare different experiments, the processed fluorescence signals for the complete annotated genes of interest were extracted from GEO and normalized to the averaged mRNA levels of GAPDH, ACTB and STAT1 in the same experiment. The median and SEM of these normalized values from n reported experiments were estimated.
Metabolic profiling
Cells were grown on Petri dishes for 24 h. After changing the cellular growth medium to glucose-supplemented HBSS, 0.5 mM AcPH was added and cells were incubated for 5.5 h. Metabolic profiling was performed essentially as in [40]. Briefly, metabolites were extracted in 2 ml ice-cold methanol containing 0.05 mM ribitol as internal standard for the relative quantification of metabolite abundance [54]. After centrifugation, the supernatant was collected and stored frozen before the analyses. The pellet was used for protein quantification as in [55]. Samples were derivatized as in [54]. GC-MS metabolite determinations were normalized to ribitol level and protein content (μg). For the heat map visualisation normalized values were Log(2)-transformed and the heat map was created using MultiExperiment Viewer (MeV®) software [56].
ACKNOWLEDGMENTS AND FUNDING
VIB greatly acknowledges support from Russian Science Foundation (grant N 14–15-00133). DMD acknowledges the National Council for Scientific and Technological Development (CNPq), Brazil. RLSG was supported by the Brazilian Government through the Coordenação de Aperfeiçoamento de Pessoal de Nível Superior (CAPES) e Conselho de Nacional de Desenvolvimento Científico e Tecnológico programa Ciências Sem Fronteiras (CNPq-CSF) and The Glenn Foundation.
CONFLICTS OF INTEREST
The authors declare no conflict of interest.
REFERENCES
1. Bunik VI, Tylicki A, Lukashev NV. Thiamin diphosphate-dependent enzymes: from enzymology to metabolic regulation, drug design and disease models. The FEBS journal. 2013; 280:6412–6442.
2. Cairns RA, Harris IS, Mak TW. Regulation of cancer cell metabolism. Nature reviews Cancer. 2011; 11:85–95.
3. Jha MK, Suk K. Pyruvate dehydrogenase kinase as a potential therapeutic target for malignant gliomas. Brain tumor research and treatment. 2013; 1:57–63.
4. Bingham PM, Stuart SD, Zachar Z. Lipoic acid and lipoic acid analogs in cancer metabolism and chemotherapy. Expert review of clinical pharmacology. 2014; 7:837–846.
5. Letzien U, Oppermann H, Meixensberger J, Gaunitz F. The antineoplastic effect of carnosine is accompanied by induction of PDK4 and can be mimicked by L-histidine. Amino acids. 2014; 46:1009–1019.
6. Michelakis ED, Webster L, Mackey JR. Dichloroacetate (DCA) as a potential metabolic-targeting therapy for cancer. British journal of cancer. 2008; 99:989–994.
7. Moore JD, Staniszewska A, Shaw T, D’Alessandro J, Davis B, Surgenor A, Baker L, Matassova N, Murray J, Macias A, Brough P, Wood M, Mahon PC. VER-246608, a novel pan-isoform ATP competitive inhibitor of pyruvate dehydrogenase kinase, disrupts Warburg metabolism and induces context-dependent cytostasis in cancer cells. Oncotarget. 2014; 5:12862–12876.
8. Zachar Z, Marecek J, Maturo C, Gupta S, Stuart SD, Howell K, Schauble A, Lem J, Piramzadian A, Karnik S, Lee K, Rodriguez R, Shorr R, Bingham PM. Non-redox-active lipoate derivates disrupt cancer cell mitochondrial metabolism and are potent anticancer agents in vivo. Journal of molecular medicine. 2011; 89:1137–1148.
9. Baggetto LG, Lehninger AL. Formation and utilization of acetoin, an unusual product of pyruvate metabolism by Ehrlich and AS30-D tumor mitochondria. The Journal of biological chemistry. 1987; 262:9535–9541.
10. Baggetto LG, Lehninger AL. Isolated tumoral pyruvate dehydrogenase can synthesize acetoin which inhibits pyruvate oxidation as well as other aldehydes. Biochemical and biophysical research communications. 1987; 145:153–159.
11. Veal EA, Day AM, Morgan BA. Hydrogen peroxide sensing and signaling. Molecular cell. 2007; 26:1–14.
12. Hamada M, Hiraoka T, Koike K, Ogasahara K, Kanzaki T. Properties and subunit structure of pig heart pyruvate dehydrogenase. Journal of biochemistry. 1976; 79:1273–1285.
13. Kiselevsky YV, Ostrovtsova SA, Strumilo SA. Kinetic characterization of the pyruvate and oxoglutarate dehydrogenase complexes from human heart. Acta biochimica Polonica. 1990; 37:135–139.
14. Roche TE, Cate RL. Purification of porcine liver pyruvate dehydrogenase complex and characterization of its catalytic and regulatory properties. Archives of biochemistry and biophysics. 1977; 183:664–677.
15. Gupta SC, Dekker EE. Evidence for the identity and some comparative properties of alpha-ketoglutarate and 2-keto-4-hydroxyglutarate dehydrogenase activity. The Journal of biological chemistry. 1980; 255:1107–1112.
16. McMinn CL, Ottaway JH. Studies on the mechanism and kinetics of the 2-oxoglutarate dehydrogenase system from pig heart. The Biochemical journal. 1977; 161:569–581.
17. Strumilo SA, Taranda NI, Senkevich SB, Vinogradov VV. 2-oxoglutarate dehydrogenase complex from bovine-adrenal-cortex mitochondria. Purification and partial characterization. Acta biologica et medica Germanica. 1981; 40:257–264.
18. Parker PJ, Randle PJ. Partial purification and properties of branched-chain 2-oxo acid dehydrogenase of ox liver. The Biochemical journal. 1978; 171:751–757.
19. Halestrap AP. The monocarboxylate transporter family—Structure and functional characterization. IUBMB life. 2012; 64:1–9.
20. Schonbrunn-Hanebeck E, Laber B, Amrhein N. Slow-binding inhibition of the Escherichia coli pyruvate dehydrogenase multienzyme complex by acetylphosphinate. Biochemistry. 1990; 29:4880–4885.
21. Baillie AC, Wright K, Wright BJ, Earnshaw CG. Inhibitors of pyruvate dehydrogenase as herbicides. Pesticide Biochemistry and Physiology. 1988; 30:103–112.
22. Laber B, Amrhein N. Metabolism of 1-aminoethylphosphinate generates acetylphosphinate, a potent inhibitor of pyruvate dehydrogenase. The Biochemical journal. 1987; 248:351–358.
23. Kluger R, Pike DC. Active site generated analogues of reactive intermediates in enzymic reactions. Potent inhibition of pyruvate dehydrogenase by a phosphonate analogue of pyruvate1. Journal of the American Chemical Society. 1977; 99:4504–4506.
24. Kluger R, Pike DC. Chemical synthesis of a proposed enzyme-generated “reactive intermediate analogue” derived from thiamin diphosphate. Self-activation of pyruvate dehydrogenase by conversion of the analogue to its components. Journal of the American Chemical Society. 1979; 101:6425–6428.
25. Bunik VI, Denton TT, Xu H, Thompson CM, Cooper AJ, Gibson GE. Phosphonate analogues of alpha-ketoglutarate inhibit the activity of the alpha-ketoglutarate dehydrogenase complex isolated from brain and in cultured cells. Biochemistry. 2005; 44:10552–10561.
26. Zundorf G, Kahlert S, Bunik VI, Reiser G. alpha-Ketoglutarate dehydrogenase contributes to production of reactive oxygen species in glutamate-stimulated hippocampal neurons in situ. Neuroscience. 2009; 158:610–616.
27. Araujo WL, Nunes-Nesi A, Trenkamp S, Bunik VI, Fernie AR. Inhibition of 2-oxoglutarate dehydrogenase in potato tuber suggests the enzyme is limiting for respiration and confirms its importance in nitrogen assimilation. Plant Physiol. 2008; 148:1782–1796.
28. Araujo WL, Tohge T, Nunes-Nesi A, Daloso DM, Nimick M, Krahnert I, Bunik VI, Moorhead GB, Fernie AR. Phosphonate analogs of 2-oxoglutarate perturb metabolism and gene expression in illuminated Arabidopsis leaves. Frontiers in plant science. 2012; 3:114.
29. Bera AK, Polovnikova LS, Roestamadji J, Widlanski TS, Kenyon GL, McLeish MJ, Hasson MS. Mechanism-based inactivation of benzoylformate decarboxylase, a thiamin diphosphate-dependent enzyme. Journal of the American Chemical Society. 2007; 129:4120–4121.
30. Korotchkina LG, Khailova LS, Severin SE. The effect of phosphorylation on pyruvate dehydrogenase. FEBS letters. 1995; 364:185–188.
31. Patel MS, Korotchkina LG. Regulation of mammalian pyruvate dehydrogenase complex by phosphorylation: complexity of multiple phosphorylation sites and kinases. Experimental & molecular medicine. 2001; 33:191–197.
32. Patel MS, Korotchkina LG. Regulation of the pyruvate dehydrogenase complex. Biochemical Society transactions. 2006; 34:217–222.
33. Seifert F, Ciszak E, Korotchkina L, Golbik R, Spinka M, Dominiak P, Sidhu S, Brauer J, Patel MS, Tittmann K. Phosphorylation of serine 264 impedes active site accessibility in the E1 component of the human pyruvate dehydrogenase multienzyme complex. Biochemistry. 2007; 46:6277–6287.
34. Kim JW, Tchernyshyov I, Semenza GL, Dang CV. HIF-1-mediated expression of pyruvate dehydrogenase kinase: a metabolic switch required for cellular adaptation to hypoxia. Cell metabolism. 2006; 3:177–185.
35. Hitosugi T, Fan J, Chung TW, Lythgoe K, Wang X, Xie J, Ge Q, Gu TL, Polakiewicz RD, Roesel JL, Chen GZ, Boggon TJ, Lonial S, Fu H, Khuri FR, Kang S, et al. Tyrosine phosphorylation of mitochondrial pyruvate dehydrogenase kinase 1 is important for cancer metabolism. Molecular cell. 2011; 44:864–877.
36. Bonnet S, Archer SL, Allalunis-Turner J, Haromy A, Beaulieu C, Thompson R, Lee CT, Lopaschuk GD, Puttagunta L, Bonnet S, Harry G, Hashimoto K, Porter CJ, Andrade MA, Thebaud B, Michelakis ED. A mitochondria-K+ channel axis is suppressed in cancer and its normalization promotes apoptosis and inhibits cancer growth. Cancer cell. 2007; 11:37–51.
37. Hanberry BS, Berger R, Zastre JA. High-dose vitamin B1 reduces proliferation in cancer cell lines analogous to dichloroacetate. Cancer chemotherapy and pharmacology. 2014; 73:585–594.
38. Vijayakrishnan S, Callow P, Nutley MA, McGow DP, Gilbert D, Kropholler P, Cooper A, Byron O, Lindsay JG. Variation in the organization and subunit composition of the mammalian pyruvate dehydrogenase complex E2/E3BP core assembly. The Biochemical journal. 2011; 437:565–574.
39. Vijayakrishnan S, Kelly SM, Gilbert RJ, Callow P, Bhella D, Forsyth T, Lindsay JG, Byron O. Solution structure and characterisation of the human pyruvate dehydrogenase complex core assembly. Journal of molecular biology. 2010; 399:71–93.
40. Trofimova LK, Araujo WL, Strokina AA, Fernie AR, Bettendorff L, Bunik VI. Consequences of the alpha-ketoglutarate dehydrogenase inhibition for neuronal metabolism and survival: implications for neurodegenerative diseases. Current medicinal chemistry. 2012; 19:5895–5906.
41. Travaglione S, Loizzo S, Rizza T, Del Brocco A, Ballan G, Guidotti M, Vona R, Di Nottia M, Torraco A, Carrozzo R, Fiorentini C, Fabbri A. Enhancement of mitochondrial ATP production by the Escherichia coli cytotoxic necrotizing factor 1. The FEBS journal. 2014; 281:3473–3488.
42. Williamson JR. Glycolytic control mechanisms. II. Kinetics of intermediate changes during the aerobic-anoxic transition in perfused rat heart. The Journal of biological chemistry. 1966; 241:5026–5036.
43. Beis I, Newsholme EA. The contents of adenine nucleotides, phosphagens and some glycolytic intermediates in resting muscles from vertebrates and invertebrates. The Biochemical journal. 1975; 152:23–32.
44. Gazizov MB, Nikolaeva VG, Zakharov VM, Khariullin RA, Moskva VV. Reactions of dialkyl hydrogen phosphites with acyl chlorides in presence of alkyl vinyl ethers. Russian journal of general chemistry. 1988; 58:940–941.
45. Karaman R, Goldblum A, Breuer E, Leader HJ. Acylphosphonic acids and methyl hydrogen acylphosphonates: physical and chemical properties and theoretical calculations. Journal of the chemical society, perkin transactions. 1989; 1:765–774.
46. Popov KM, Shimomura Y, Harris RA. Purification and comparative study of the kinases specific for branched chain alpha-ketoacid dehydrogenase and pyruvate dehydrogenase. Protein expression and purification. 1991; 2:278–286.
47. Shimomura Y, Nanaumi N, Suzuki M, Popov KM, Harris RA. Purification and partial characterization of branched-chain alpha-ketoacid dehydrogenase kinase from rat liver and rat heart. Archives of biochemistry and biophysics. 1990; 283:293–299.
48. Stanley CJ, Perham RN. Purification of 2-oxo acid dehydrogenase multienzyme complexes from ox heart by a new method. The Biochemical journal. 1980; 191:147–154.
49. Affourtit C, Quinlan CL, Brand MD. Measurement of proton leak and electron leak in isolated mitochondria. Methods Mol Biol. 2012; 810:165–182.
50. Grivennikova VG, Kapustin AN, Vinogradov AD. Catalytic activity of NADH-ubiquinone oxidoreductase (complex I) in intact mitochondria. evidence for the slow active/inactive transition. The Journal of biological chemistry. 2001; 276:9038–9044.
51. Starkov AA, Fiskum G, Chinopoulos C, Lorenzo BJ, Browne SE, Patel MS, Beal MF. Mitochondrial alpha-ketoglutarate dehydrogenase complex generates reactive oxygen species. The Journal of neuroscience: the official journal of the Society for Neuroscience. 2004; 24:7779–7788.
52. Bers DM, Patton CW, Nuccitelli R. A practical guide to the preparation of Ca2+ buffers. Methods in cell biology. 1994; 40:3–29.
53. Edgar R, Domrachev M, Lash AE. Gene Expression Omnibus: NCBI gene expression and hybridization array data repository. Nucleic acids research. 2002; 30:207–210.
54. Lisec J, Schauer N, Kopka J, Willmitzer L, Fernie AR. Gas chromatography mass spectrometry-based metabolite profiling in plants. Nature protocols. 2006; 1:387–396.
55. Bradford MM. A rapid and sensitive method for the quantitation of microgram quantities of protein utilizing the principle of protein-dye binding. Analytical biochemistry. 1976; 72:248–254.
56. Saeed AI, Sharov V, White J, Li J, Liang W, Bhagabati N, Braisted J, Klapa M, Currier T, Thiagarajan M, Sturn A, Snuffin M, Rezantsev A, Popov D, Ryltsov A, Kostukovich E, et al. TM4: a free, open-source system for microarray data management and analysis. BioTechniques. 2003; 34:374–378.