
INTRODUCTION
Epithelial ovarian carcinoma (EOC) has received increasing attention in recent years because it is associated with the highest mortality rate among gynecologic malignancies [1, 2]. The majority of patients are diagnosed at an advanced stage and have a poor prognosis [3]. Current management strategies include debulking surgery and adjuvant chemotherapy with a regimen of platinum and paclitaxel, which has a response rate of 80% for all patients and 40–60% for advanced-stage patients [4]. However, patients, especially those with an advanced stage, usually relapse after an initial response and ultimately die of recurrence [3]. Chemoresistance is an obstacle in the management of ovarian cancer. To overcome this problem several mechanisms have been proposed including suppression of apoptotic pathways, increased DNA repair and over-expression of multidrug-resistance genes [5–7]. Elucidating the mechanisms of chemoresistance may be helpful in the development of new therapeutic strategies.
Chitinase 3-like 1 (CHI3L1) is located on chromosome 1q32.1, and the product, YKL-40, a 40-kDa glycoprotein, is secreted by numerous human cells such as cartilage, synovium, endothelial cells, inflammatory cells, and cancer cells. It plays a role in cell proliferation, differentiation, apoptosis, angiogenesis, inflammation and extracellular tissue remodeling [8]. Elevated levels of serum YKL-40 are reported to be associated with several types of cancer, including ovary, breast, brain and lung cancer [9–18], and several medical and inflammatory diseases such as rheumatoid arthritis, diabetes mellitus, and coronary artery disease [19–21]. These medical, inflammatory, and malignant diseases all possibly contribute to the levels of serum YKL-40. In our study, we used real-time quantitative PCR (qRT-PCR) to measure the quantitative expression of CHI3L1 in ovarian cancer tissues without the influence of other malignancies or medical diseases.
CHI3L1 has been reported to play roles in the carcinogenesis, proliferation, invasion, and metastasis of glioma and prostate cancer [22–24]. The role of CHI3L1 in tumor angiogenesis has also been noted [25–27]. However, the role of CHI3L1 in ovarian cancer and chemoresistance is currently unknown. We initially investigated the correlation of clinical outcomes of patients and CHI3L1 expression to evaluate the feasibility of using CHI3L1 as a prognostic biomarker for patients with EOC. We used in vitro studies to elucidate the possible mechanism of CHI3L1 in chemoresistance. The results of this study may clarify the role of CHI3L1 in ovarian cancer and elucidate whether CHI3L1 is a potential biomarker of chemoresponse and a potential target for the treatment of patients with EOC.
RESULTS
The expression of CHI3L1 is higher in EOCs than in the normal ovarian tissues
A total of 180 patients with EOC were enrolled and 40 normal ovarian tissues were used as a reference. The representative figures of the qRT-PCR for CHI3L1 and G6PDH are shown in Figures 1A and 1B. The mean expression of CHI3L1 in the EOCs was much higher than that in the normal ovarian tissue (0.177 vs. 0.001, p < 0.001, Student’s t-test, Figure 1C and 1D).
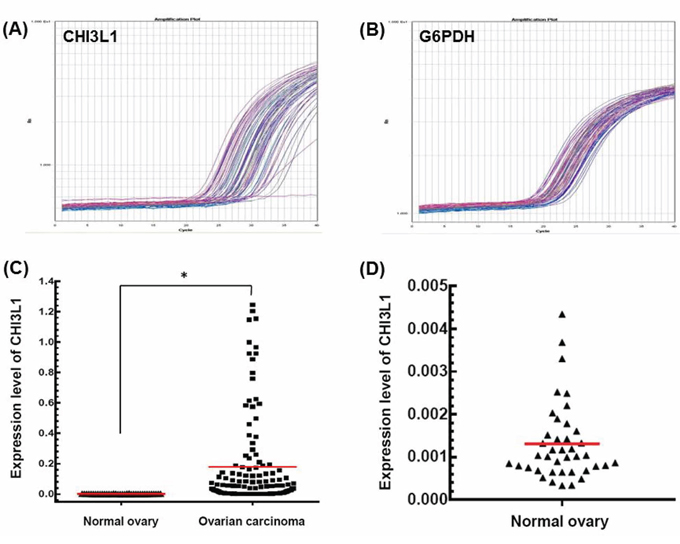
Figure 1: mRNA expression detected by quantitative real-time PCR. A. Representative figure of the quantification of CHI3L1 mRNA expression in tumor tissues. B. Representative figure of quantification of G6PDH mRNA expression in tumor tissues. C. CHI3L1 mRNA expression levels between normal and cancerous ovarian tissues. Black triangles indicated the normal ovarian tissues, and black squares indicated the ovarian cancer tissues.(*p < 0.05 by the Student’s t-test) D. CHI3L1 mRNA expression levels of normal ovarian tissues were shown in detail.
The expression of CHI3L1 is higher in patients with EOC that also present with a serous histologic type, advanced stage, chemoresistance, and poor outcome
The basic characteristics of the 180 patients are shown in Table 1. There were 129 (71.7%) serous carcinomas, 13 (7.2%) endometrioid carcinomas, 14 (7.8%) clear cell carcinomas, 8 (4.4%) carcinosarcomas, 3 (1.7%) transitional cell carcinomas and 13 (7.2%) carcinomas of mixed type. The expression of CHI3L1 was higher in the patients with a serous histologic type (0.174 vs. 0.029, p = 0.002), advanced stage (stages III/IV) (0.153 vs. 0.047, p = 0.046), chemoresistance (0.195 vs. 0.076, p = 0.004), recurrence (0.169 vs. 0.049, p = 0.008), and death (0.200 vs. 0.104, p = 0.036) than in those with a non-serous histologic type, early stage (stages I/II), chemosensitive, non recurring, and in those who were still alive (all by the Student’s t-test) (Table 2). There was no difference in the expression of CHI3L1 between tumors with a high (III) or low (I + II) histological grade.
Table 1: Clinicopathological characteristics of the 180 women with EOC
Number |
Percentage (%) |
|
|---|---|---|
Total patients |
180 |
100 |
Age (years) |
53.8 ± 12.2 |
|
Histology |
||
Serous |
129 |
71.7 |
Non-serous |
51 |
28.3 |
Grade |
||
Low (I+II) |
29 |
16.1 |
High (III) |
126 |
70.0 |
Not available |
25 |
13.9 |
FIGO stage |
||
Early (I+II) |
34 |
18.9 |
Advanced (III+IV) |
146 |
81.1 |
Debulking |
||
Optimal |
96 |
53.3 |
Suboptimal |
84 |
46.7 |
Platinum-based chemotherapy |
||
With paclitaxel |
153 |
85.0 |
Without paclitaxel |
27 |
15.0 |
Recurrence |
||
Yes |
126 |
70.0 |
No |
54 |
30.0 |
Death |
||
Yes |
54 |
30.0 |
No |
126 |
70.0 |
Progression-free survival (months) |
10 (0–139) |
|
Overall survival (months) |
26 (1–167) |
Table 2: Mean expression levels of CHI3L1 of the patients and subgroup analysis*
Histology |
Grade |
FIGO stage |
||||||||
|---|---|---|---|---|---|---|---|---|---|---|
Numbers |
Serous |
N-serous+ |
p value |
Low |
High |
p value |
Early |
Advanced |
p value |
|
Total patients |
180 |
0.174 |
0.029 |
0.002 |
0.068 |
0.154 |
0.144 |
0.047 |
0.153 |
0.046 |
Optimal debulked patients |
96 |
0.165 |
0.022 |
0.008 |
0.047 |
0.129 |
0.256 |
0.039 |
0.149 |
0.050 |
Patients with paclitaxel# |
153 |
0.192 |
0.031 |
0.002 |
0.081 |
0.166 |
0.235 |
0.031 |
0.162 |
0.073 |
Recurrence |
Chemo-response |
Outcome |
||||||||
|---|---|---|---|---|---|---|---|---|---|---|
Numbers |
No |
Yes |
p |
Sensitive |
Resistant |
p |
Alive |
Death |
p |
|
Total patients |
180 |
0.049 |
0.169 |
0.008 |
0.076 |
0.195 |
0.004 |
0.104 |
0.200 |
0.036 |
Optimally debulked patients |
96 |
0.057 |
0.151 |
0.083 |
0.071 |
0.206 |
0.019 |
0.099 |
0.160 |
0.351 |
Patients with paclitaxel# |
153 |
0.051 |
0.186 |
0.011 |
0.082 |
0.205 |
0.011 |
0.110 |
0.224 |
0.030 |
*The expression level was calculated using the 2−ΔΔCt method;
+N-serous indicated Non-serous;
#Patients with paclitaxel indicated these patients received platinum combined with paclitaxel chemotherapy; p value by Student’s t-test
Of the 96 women whose residual tumor size was ≤ 1 cm after debulking surgery (Table 2), those with a serous histologic type (0.165 vs. 0.022, p = 0.008) or chemoresistance (0.206 vs. 0.071, p = 0.019) had higher levels of CHI3L1 than those with a non-serous histologic type or chemosensitivity (both by the Student’s t-test).
Of the 153 patients who received platinum with paclitaxel chemotherapy, the levels of CHI3L1 were also higher in those with a serous histologic type (0.192 vs. 0.031, p = 0.002), chemoresistance (0.205 vs. 0.082, p = 0.011), recurrence (0.186 vs. 0.051, p = 0.011), and death (0.224 vs. 0.110, p = 0.030) than in those with a non-serous histologic type, chemosensitivity, non reoccurring, and in those who were still alive (all by the Student’s t-test). The patients with a high grade or advanced stage did not have higher CHI3L1 levels than those with a low grade or early stage.
CHI3L1 is a poor prognostic factor for EOC
We further evaluated whether CHI3L1 could be a prognostic factor for the 180 patients with EOC. The patients with high CHI3L1 expression (≥ 0.1) had a shorter progression free survival (PFS) (log-rank test, p < 0.001, Figure 2A) and overall survival (OS) (log-rank test, p < 0.001, Figure 2B) than those with a low CHI3L1 expression (< 0.1) in Kaplan-Meier survival analysis.
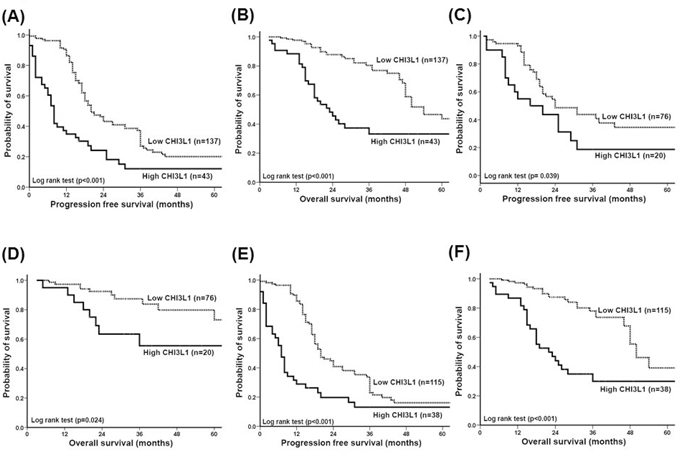
Figure 2: Correlation of CHI3L1 expression with progression-free survival (PFS) and overall survival (OS) of patients with ovarian cancer. A. PFS of all 180 patients. Patients with a high CHI3L1 expression had a much shorter PFS (p < 0.001). B. OS of all 180 patients. Patients with a high CHI3L1 expression had a much, shorter OS (p < 0.001). C. PFS of the 96 patients whose residual tumor diameter was ≤ 1 cm. Patients with a high CHI3L1 expression had a shorter PFS (p = 0.039). D. OS of the 96 patients whose residual tumor diameter was ≤ 1 cm. Patients with a high CHI3L1 expression had a shorter OS (p = 0.024). E. PFS of the 153 patients who received adjuvant platinum-paclitaxel chemotherapy. Patients with a high CHI3L1 expression had a much shorter PFS (p < 0.001). F. OS of the 153 patients who received adjuvant platinum-paclitaxel chemotherapy. Patients with a high CHI3L1 expression had a much shorter OS (p < 0.001). All differences were calculated by the log rank test.
We further analyzed the 96 patients whose tumor size was ≤ 1 cm after debulking surgery. Those with high CHI3L1 expression also had a shorter PFS (log-rank test, p = 0.039, Figure 2C) and OS (log-rank test, p = 0.024, Figure 2D) compared with those with low CHI3L1 expression. In addition, of the 153 patients who received paclitaxel-platinum chemotherapy, those with high CHI3L1 expression had a shorter PFS (log-rank test, p < 0.001, Figure 2E) and OS (log-rank test, p < 0.001, Figure 2F) compared with those with low CHI3L1 expression.
The hazard ratios (HR) of various risk factors by Cox regression analysis for the total 180 women with EOC are shown in Table 3. Using univariate analysis, high CHI3L1 expression (HR 2.32, 95% confidence interval (CI): 1.58–3.41, p < 0.001), advanced stage (HR: 2.46, 95% CI: 1.40 − 4.31, p = 0.002), high-grade (HR: 1.88, 95% CI: 1.10 − 3.20, p = 0.019) and residual tumor size > 1 cm after debulking surgery (HR: 1.91, 95% CI: 1.34 − 2.72, p < 0.001) were risk factors for recurrence. Using multivariate analysis, high CHI3L1 expression (HR: 2.91, 95% CI: 1.89 − 4.48, p < 0.001), advanced stage (HR: 2.47, 95% CI: 1.24 − 4.90, p = 0.009), high-grade (HR: 1.73, 95% CI: 1.01 − 2.97, p = 0.044) and residual tumor size > 1 cm after debulking surgery (HR: 1.74, 95% CI: 1.18 − 2.57, p = 0.005) were independent risk factors for recurrence.
Table 3: Cox regression model for the risk factors for recurrence and death
Recurrence |
Death |
||||||||
|---|---|---|---|---|---|---|---|---|---|
Univariate |
Multivariate |
Univariate |
Multivariate |
||||||
Numbers |
HR (95% CI) |
p |
HR (95% CI) |
p |
HR (95% CI) |
p |
HR (95% CI) |
p |
|
Histology |
|||||||||
Non-serous |
51 |
1.00 |
1.00 |
||||||
Serous |
129 |
0.68 (0.44–1.05) |
0.084 |
1.07 (0.60–1.90) |
0.800 |
||||
FIGO stage |
|||||||||
Early |
34 |
1.00 |
1.00 |
1.00 |
1.00 |
||||
Advanced |
146 |
2.46 (1.40–4.31) |
0.002 |
2.47 (1.24–4.90) |
0.009 |
5.20 (1.63–16.59) |
0.005 |
4.65 (1.41–15.31) |
0.011 |
Grade |
|||||||||
Low |
29 |
1.00 |
1.00 |
1.00 |
|||||
High |
126 |
1.88 (1.10–3.20) |
0.019 |
1.73 (1.01–2.97) |
0.044 |
1.09 (0.57–2.05) |
0.785 |
||
Debulking surgery |
|||||||||
Optimal |
96 |
1.00 |
1.00 |
1.00 |
1.00 |
||||
Suboptimal |
84 |
1.91 (1.34–2.72) |
< 0.001 |
1.74 (1.18–2.57) |
0.005 |
3.09 (1.81–5.26) |
< 0.001 |
2.95 (1.70–5.10) |
< 0.001 |
Platinum-based chemotherapy |
|||||||||
Without paclitaxel |
27 |
1.00 |
1.00 |
||||||
With paclitaxel |
153 |
1.30 (0.79–2.15) |
0.296 |
1.71 (0.81–3.61) |
0.156 |
||||
CHI3L1 expression |
|||||||||
Low |
137 |
1.00 |
1.00 |
1.00 |
1.00 |
||||
High |
43 |
2.32 (1.58–3.41) |
< 0.001 |
2.91 (1.89–4.48) |
< 0.001 |
3.03 (1.84–5.00) |
< 0.001 |
4.03 (2.37–6.87) |
< 0.001 |
Using univariate analysis, high CHI3L1 expression (HR 3.03, 95% CI: 1.84 − 5.00, p < 0.001), advanced stage (HR: 5.20, 95% CI: 1.63 − 16.59, p = 0.005) and residual tumor size > 1 cm after debulking surgery (HR: 3.09, 95% CI: 1.81 − 5.26, p < 0.001) were risk factors for death. However, multivariate analysis showed that high CHI3L1 expression (HR: 4.03, 95% CI: 2.37 − 6.87, p < 0.001), advanced stage (HR: 4.65, 95% CI: 1.41 − 15.31, p = 0.011) and residual tumor size > 1 cm after debulking surgery (HR: 2.95, 95% CI: 1.70 − 5.10, p < 0.001) were independent risk factors for death.
These results suggest that CHI3L1 expression is a poor prognostic factor for patients with EOC.
CHI3L1 inhibits apoptosis of human ovarian and endometrial cancer cells treated with cytotoxic drugs
To investigate the possible biological effects of CHI3L1 on ovarian cancer cells, CHI3L1-transfected OVCAR3 cells were generated for in vitro apoptosis-related assays. The RNA transcription levels of CHI3L1 in various OVCAR3 CHI3L1 transfectants were higher than those in the mock-transfected and original OVCAR3 cells (Figure 3A1). The representative figures of flow cytometric analysis for the detection of annexin V-positive and 7AAD-positive cells in various OVCAR3 transfectants treated with paclitaxel are shown in Figures 3B and 3C. The incremental fluorescence intensity of annexin V in the various OVCAR3 CHI3L1 transfectants was much lower than those in the original OVCAR3 and mock-transfected OVCAR3 cells (original OVCAR3: 24.01 ± 3.45, OVCAR3-mock: 24.53 ± 2.60, OVCAR3-CHI3L1(1):4.91±1.96, OVCAR3-CHI3L1(2): 7.64 ± 0.29, ANOVA test, p = 0.001, Figure 3D), when treated with paclitaxel for 48 hours. The incremental fluorescence intensity of 7AAD in the OVCAR3 CHI3L1 transfectants was also much lower than those in the original OVCAR3 and mock-transfected OVCAR3 cells (original OVCAR3: 10.63 ± 1.27, OVCAR3-mock: 12.91 ± 2.71, OVCAR3-CHI3L1(1): 2.91 ± 0.72, OVCAR3-CHI3L1(2): 2.49 ± 0.79, ANOVA test, p = 0.003, Figure 3D), when treated with paclitaxel for 48 hours. However, there were no significant differences in the incremental fluorescence intensity of annexin V (original OVCAR3: 6.66 ± 0.26, OVCAR3-mock: 6.90 ± 0.10, OVCAR3-CHI3L1(1): 9.24 ± 1.41, OVCAR3-CHI3L1(2): 9.97 ± 0.90, ANOVA test, p = 0.11) or 7AAD (original OVCAR3: 0.62 ± 0.35, OVCAR3-mock: 0.95 ± 0.06, OVCAR3-CHI3L1(1): 1.25 ± 0.11, OVCAR3-CHI3L1(2): 0.94 ± 0.01, ANOVA test, p = 0.27) in the cell lines treated with cisplatin.
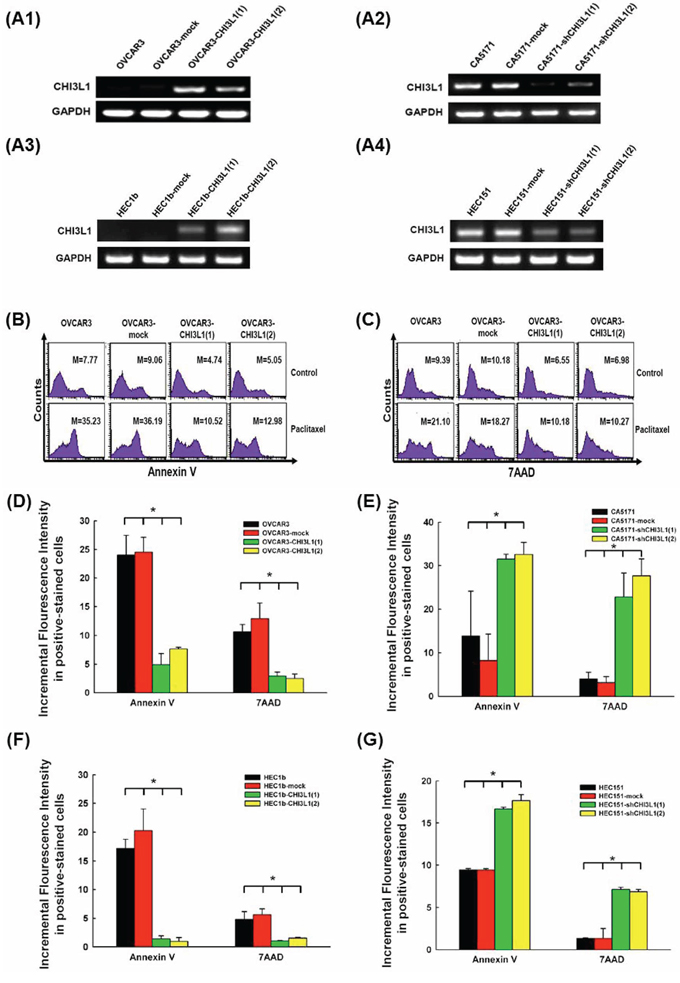
Figure 3: In vitro apoptotic assays of ovarian cancer (OVCAR3, CA5171) and endometrial cancer (HEC1b, HEC151) original cells, and their transfectants treated with respective cytotoxic drug. A. RT-PCR of CHI3L1 expression in the various cell lines. A1: The expression of CHI3L1 was higher in the OVCAR3-CHI3L1 transfectants than those in the original OVCAR3 and mock-transfectants. A2: The expression of CHI3L1 was lower in the CA5171-shCHI3L1 transfectants than those in the original CA5171 and mock-transfectants. A3: The expression of CHI3L1 was higher in the HEC1b-CHI3L1 transfectants than those in the original HEC1b and mock-transfectants. A4: The expression of CHI3L1 was lower in the HEC151-shCHI3L1 transfectants than those in the original HEC151 and mock-transfectants. B. Representative figures of flow cytometric analysis for annexin V-staining in original and various OVCAR3 transfectants treated with paclitaxel. C. Representative figures of flow cytometric analysis for 7AAD-stained in original and various OVCAR3 transfectants treated with paclitaxel. (The M values in (B) and (C) indicated the median value of fluorescence intensity of all cells stained with annexin V or 7AAD in original and various OVCAR3 transfectants). D. Bar figures of the incremental fluorescence intensity of Annexin V and 7AAD -positive cells in original and various OVCAR3 transfectants treated with paclitaxel for 48 hours (*p < 0.05 by ANOVA). The incremental fluorescence intensities of annexin V and 7AAD in the various OVCAR3 CHI3L1 transfectants were significantly lower than those in the original OVCAR3 and mock-transfected OVCAR3 cells. E. Bar figures of the incremental fluorescence intensity of Annexin V and 7AAD -positive cells in original and various CA5171 transfectants treated with paclitaxel for 48 hours (*p < 0.05 by ANOVA). The incremental fluorescence intensities of annexin V and 7AAD in the various CA5171 shCHI3L1 transfectants were higher than those in the original CA5171 and mock-transfected CA5171 cells. F. Bar figures of the incremental fluorescence intensity of Annexin V and 7AAD -positive cells in original and various HEC1b transfectants treated with paclitaxel for 48 hours (*p < 0.05 by ANOVA). The incremental fluorescence intensities of annexin V and 7AAD in the various HEC1b CHI3L1 transfectants were lower than those in the original HEC1b and mock-transfected HEC1b cells. G. Bar figures of the incremental fluorescence intensity of Annexin V and 7AAD -positive cells in original and various HEC151 transfectants treated with paclitaxel for 48 hours (*p < 0.05 by ANOVA). The incremental fluorescence intensities of annexin V and 7AAD in the various HEC151 shCHI3L1 transfectants were higher than those in the original HEC151 and mock-transfected HEC151 cells.
The CHI3L1-knockdown CA5171 cells were generated for in vitro apoptosis-related assays. The RNA transcription levels of CHI3L1 in various CA5171 shCHI3L1 transfectants were lower than those in the mock-transfected and original CA5171 cells (Figure 3A2). The incremental fluorescence intensity of annexin V in the various CA5171 shCHI3L1 transfectants was much higher than those in the original CA5171 and mock-transfected CA5171 cells (original CA5171: 13.85 ± 10.26, CA5171-mock: 8.24 ± 6.06, CA5171-shCHI3L1(1): 31.54 ± 1.14, CA5171-shCHI3L1(2): 32.62 ± 2.75, ANOVA test, p = 0.006, Figure 3E), when treated with paclitaxel for 48 hours. The incremental fluorescence intensity of 7AAD in the CA5171 shCHI3L1 transfectants was also higher than those in the original CA5171 and mock-transfected CA5171 cells (original CA5171: 3.96 ± 1.57, CA5171-mock: 3.16 ± 1.39, CA5171-shCHI3L1(1): 22.77 ± 5.54, CA5171-shCHI3L1(2): 27.65 ± 3.92, ANOVA test, p = 0.025, Figure 3E), when treated with paclitaxel for 48 hours. However, there were no significant differences in the incremental fluorescence intensity of annexin V (original CA5171: 1.40 ± 0.49, CA5171-mock: 0.95 ± 0.97, CA5171-shCHI3L1(1): 2.03 ± 0.59, CA5171-shCHI3L1(2): 3.66 ± 1.66, ANOVA test, p=0.34) or 7AAD (original CA5171: 1.97 ± 1.08, CA5171-mock: 2.06 ± 1.17, CA5171-shCHI3L1(1): 1.52 ± 0.46, CA5171-shCHI3L1(2): 3.44 ± 1.28, ANOVA test, p = 0.62) in the cell lines treated with cisplatin. These results suggest that the CHI3L1 can inhibit the paclitaxel-induced apoptosis of human ovarian cancer cells.
To confirm if these biological effects of CHI3L1 can be also identified on endometrial cancer cells, CHI3L1-transfected HEC1b cells were generated for in vitro apoptosis-related assays. The RNA transcription levels of CHI3L1 in various HEC1b CHI3L1 transfectants were higher than those in the mock-transfected and original HEC1b cells (Figure 3A3). The incremental fluorescence intensity of annexin V in the various HEC1b CHI3L1 transfectants was much lower than those in the original HEC1b and mock-transfected HEC1b cells (original HEC1b: 17.17 ± 0.91, HEC1b-mock: 20.26 ± 2.17, HEC1b-CHI3L1(1): 1.37 ± 0.30, HEC1b-CHI3L1(2): 0.94 ± 0.38, ANOVA test, p < 0.001, Figure 3F), when treated with paclitaxel for 48 hours. The incremental fluorescence intensity of 7AAD in the HEC1b CHI3L1 transfectants was also lower than those in the original HEC1b and mock-transfected HEC1b cells (original HEC1b: 4.83 ± 1.34, HEC1b-mock: 5.64 ± 0.98, HEC1b-CHI3L1(1): 1.02 ± 0.04, HEC1b-CHI3L1(2): 1.51 ± 0.12, ANOVA test, p = 0.009, Figure 3F), when treated with paclitaxel for 48 hours. However, there were no significant differences in the incremental fluorescence intensity of annexin V (original HEC1b: 4.77 ± 3.51, HEC1b-mock: 4.56 ± 3.52, HEC1b-CHI3L1(1): 2.59 ± 1.06, HEC1b-CHI3L1(2): 3.42 ± 0.77, ANOVA test, p = 0.93) or 7AAD (original HEC1b: 1.08 ± 2.44, HEC1b-mock: 2.02 ± 1.91, HEC1b-CHI3L1(1): 2.04 ± 1.44, HEC1b-CHI3L1(2): 1.88 ± 1.20, ANOVA test, p = 0.24) in the cell lines treated with cisplatin.
The CHI3L1-knockdown HEC151 cells were generated for in vitro apoptosis-related assays. The RNA transcription levels of CHI3L1 in various HEC151 shCHI3L1 transfectants were lower than those in the mock-transfected and original HEC151 cells (Figure 3A4). The incremental fluorescence intensity of annexin V in the various HEC151 shCHI3L1 transfectants was much higher than those in the original HEC151 and mock-transfected HEC151 cells (original HEC151: 9.44 ± 0.16, HEC151-mock: 9.42 ± 0.17, HEC151-shCHI3L1(1): 16.68 ± 0.20, HEC151-shCHI3L1(2): 17.68 ± 0.72, ANOVA test, p < 0.001, Figure 3G), when treated with paclitaxel for 48 hours. The incremental fluorescence intensity of 7AAD in the HEC151 shCHI3L1 transfectants was also higher than those in the original HEC151 and mock-transfected HEC151 cells (original HEC151: 1.34 ± 0.07, HEC151-mock: 1.34 ± 1.18, HEC151-shCHI3L1(1): 7.14 ± 0.25, HEC151-shCHI3L1(2): 6.87 ± 0.27, ANOVA test, p = 0.004, Figure 3G), when treated with paclitaxel for 48 hours. However, there were no significant differences in the incremental fluorescence intensity of annexin V (original HEC151: 1.14 ± 0.10, HEC151-mock: 1.21 ± 0.19, HEC151-shCHI3L1(1): 0.72 ± 0.21, HEC151-shCHI3L1(2): 0.43 ± 0.25, ANOVA test, p=0.13) or 7AAD (original HEC151: 4.94 ± 2.72, HEC151-mock: 4.01 ± 1.77, HEC151-shCHI3L1(1): 4.46 ± 1.46, HEC151-shCHI3L1(2): 5.59 ± 0.68, ANOVA test, p = 0.93) in the cell lines treated with cisplatin. These results suggest that the CHI3L1 can inhibit the paclitaxel-induced apoptosis of human endometrial cancer cells.
CHI3L1 inhibits apoptosis of human ovarian and endometrial cancer cells by up-regulating anti-apoptotic Mcl-1
We evaluated whether CHI3L1 could regulate apoptosis-related molecules. The representative figures of the expressions of various apoptosis-related molecules, including Mcl-1, Bcl-2, Bak and Bax, were detected by immunoblotting in OVCAR3 and CA5171 original cells (Figures 4A and 4B). The Mcl-1 levels in the OVCAR3 CHI3L1 transfectants were much higher than in the original and mock-transfected OVCAR3 cells (original OVCAR3: 1.0, OVCAR3-mock: 1.09 ± 0.03, OVCAR3-CHI3L1(1): 2.79 ± 0.18, OVCAR3-CHI3L1(2): 3.06 ± 0.16, ANOVA test, p < 0.001, Figure 4C). There were no differences in protein levels of the other apoptosis-related molecules.
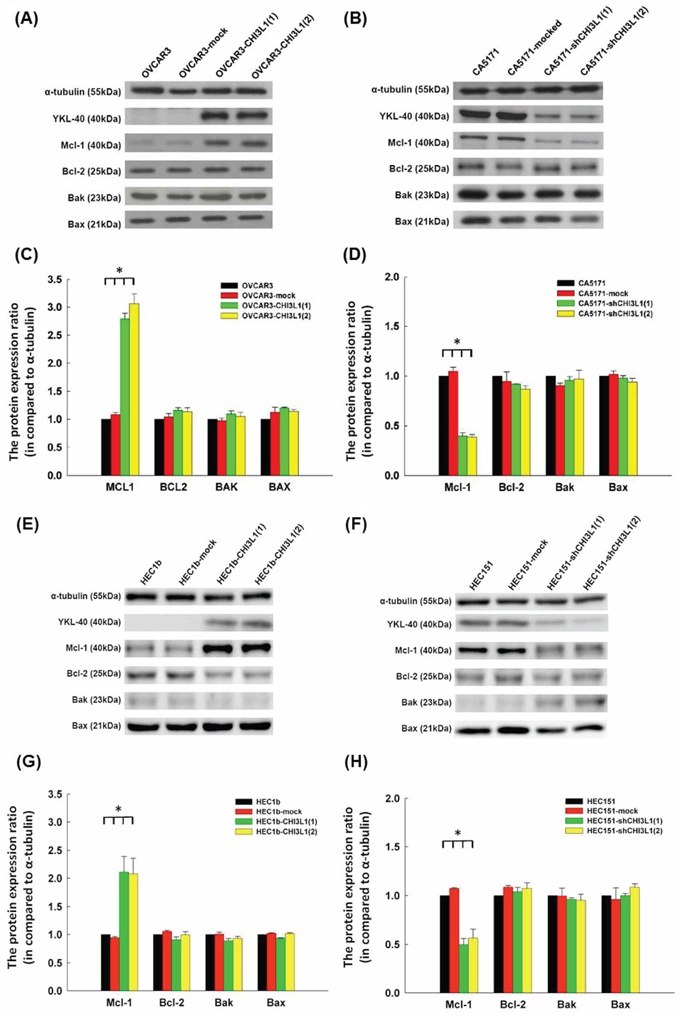
Figure 4: Western blot analysis of ovarian cancer (OVCAR3, CA5171) and endometrial cancer (HEC1b, HEC151) original cells and their transfectants. A. Representative figures of Western blots of apoptosis-related molecules in OVACR3 original cells and their transfectants. B. Representative figures of Western blots of apoptosis-related molecules in CA5171 original cells and their transfectants. C. Bar figures of protein expressions of various molecules in OVACR3 original cells and their transfectants. The expressions of Mcl-1 increased significantly in the CHI3L1-transfected OVCAR3 cells (*p < 0.05 by ANOVA). D. Bar figures of protein expressions of various molecules in CA5171 original cells and their transfectants. The expressions of Mcl-1 decreased significantly in the shCHI3L1-transfected CA5171 cells (*p < 0.05 by ANOVA). E. Representative figures of Western blots of apoptosis-related molecules in HEC1b original cells and their transfectants. F. Representative figures of Western blots of apoptosis-related molecules in HEC151 original cells and their transfectants. G. Bar figures of protein expressions of various molecules in HEC1b original cells and their transfectants. The expressions of Mcl-1 increased significantly in the CHI3L1-transfected HEC1b cells (*p < 0.05 by ANOVA). H. Bar figures of protein expressions of various molecules in HEC151 original cells and their transfectants. The expressions of Mcl-1 decreased significantly in the shCHI3L1-transfected HEC151 cells (*p < 0.05 by ANOVA).
However, Mcl-1 levels in the CA5171 shCHI3L1 transfectants were much lower than in the original and mock-transfected CA5171 cells (original CA5171: 1.0, CA5171-mock: 1.05 ± 0.04, CA5171-shCHI3L1(1): 0.40 ± 0.03, CA5171-shCHI3L1(2): 0.39 ± 0.03, ANOVA test, p < 0.001, Figure 4D). There were no differences in protein levels of the other apoptosis-related molecules. These results indicate that CHI3L1 may inhibit apoptosis by enhancing the expression of Mcl-1 in ovarian cancer cells.
The representative figures of the expressions of various apoptosis-related molecules, including Mcl-1, Bcl-2, Bak and Bax, detected by immunoblotting in HEC1b and HEC151 original cells and their transfectants are shown in Figures 4E and 4F. The Mcl-1 levels in the HEC1b CHI3L1 transfectants were higher than in the original HEC1b and mock-transfected HEC1b cells (original HEC1b: 1.0, HEC1b-mock: 0.94 ± 0.02, HEC1b-CHI3L1(1): 2.11 ± 0.28, HEC1b-CHI3L1(2): 2.08 ± 0.28, ANOVA test, p = 0.004, Figure 4G). There were no differences in protein levels of the other apoptosis-related molecules.
However, the Mcl-1 levels in the HEC151 shCHI3L1 transfectants were much lower than in the original HEC151 and mock-transfected HEC151 cells (original HEC151: 1.0, HEC151-mock: 1.07 ± 0.01, HEC151-shCHI3L1(1): 0.49 ± 0.06, HEC151-shCHI3L1(2): 0.56 ± 0.09, ANOVA test, p < 0.001, Figure 4H). There were no differences in the protein levels of the other apoptosis-related molecules. These results indicate that CHI3L1 may inhibit apoptosis by enhancing the expression of Mcl-1 in endometrial cancer cells.
DISCUSSION
Several studies have been published on the ability of serum or plasma YKL-40 to detect and assess therapeutic responses or as a prognostic predictor of ovarian cancer [9–15], although other studies have not supported this role [28, 29]. Elevated levels of serum YKL-40 have been reported in several other types of cancer, including breast [16], gastrointestinal tract [30], prostate [31], brain [17], and lung [18] cancer. In addition, several medical and inflammatory diseases have been associated with elevated serum levels of YKL-40, including polycystic ovarian syndrome [32], rheumatoid arthritis [19], diabetes mellitus [20], stroke [33], coronary artery disease [21] and asthma [34]. Only a few studies have investigated YKL-40 expression in ovarian cancer tissues using immunohistochemistry, and the results have not been promising [14, 35, 36]. Therefore, we used qRT-PCR in this study to quantitatively measure CHI3L1 expression in ovarian cancer tissues without the influence of other malignancies or medical diseases.
In this study, we found that CHI3L1 expression in cancerous tissues is a prognostic biomarker for patients with EOC. CHI3L1 expression was higher in patients with a serous histological type, advanced stage, chemoresistance and poor prognosis. Previous studies of ovarian cancer tissue also showed that YKL-40 was related to histology, stage and shorter survival by immunohistochemistry [14, 35, 36]. A high CHI3L1 expression was associated with recurrence and death in our study. The correlation of poor outcome and high CHI3L1 expression was also observed in patients whose residual tumor size was ≤ 1 cm after debulking surgery or chemotherapy with paclitaxel. In multivariate Cox regression analysis, we found that high CHI3L1 expression, advanced stage, and residual tumor size > 1 cm after debulking surgery were independent risk factors for recurrence and death. Therefore, we further investigated whether CHI3L1 plays a role in the chemoresistance of ovarian carcinoma.
Studies have found possible biological functions and mechanisms for CHI3L1 in cancer cells [22, 37]. For example, CHI3L1 regulates the proliferation of glioma cells through MAPK and AKT pathways [37], and it also plays roles in tumorigenesis and local invasion through matrix metalloproteinase-2 [22]. Nuclear factor I-X3 and STAT3 has also been identified in controlling the migration and invasion of glioma cells via the regulation of CHI3L1 [24]. CHI3L1 has also been found to promote tumor angiogenesis by inducing the coordination of membrane-bound receptor syndecan-1 and integrin alpha(v)beta(3), and by activating MAPK kinase1/2 in endothelial cells [25, 26]. However, the biological function of CHI3L1 in ovarian cancer had not been explored.
We found that CHI3L1 interfered with the paclitaxel-induced apoptosis of human ovarian cancer cells by up-regulating the anti-apoptotic Mcl-1 molecule. The cell toxicity of paclitaxel acts through the stabilization of microtubules, cell-cycle arrest in the G2/M-phase and the activation of apoptotic pathways [38]. Several mechanisms of drug resistance have been proposed, including suppression of apoptotic pathways [5], increased DNA repair [6] and over-expression of multidrug-resistance genes [7]. Our results indicate that CHI3L1 could up-regulate the expression of Mcl-1 in favor of anti-apoptotic pathways to hamper the apoptosis induced by chemotherapeutic drugs in ovarian cancer cells. However, we did not find an anti-apoptotic effect of CHI3L1 in the ovarian cancer cells treated with cisplatin. OVCAR3 and CA5171 cells are resistant to cisplatin [39, 40], and this may have a determinative effect on evaluating the role of CHI3L1 in cisplatin-induced apoptosis. We also confirmed these findings in endometrial cancer cell models. Further studies are needed to uncover the complex mechanism of cisplatin- or paclitaxel-induced apoptosis involving CHI3L1 and apoptosis-regulatory molecules.
The primary treatments for epithelial ovarian carcinoma include cytoreduction surgery and adjuvant chemotherapy, however survival is affected by disease recurrence and chemoresistance [41]. The goal of primary cytoreduction surgery is to remove as much tumor mass as possible to prevent residual disease, however it has been reported that maximal cytoreduction has only been achieved in 20–90% of patients, depending on the experience of the surgeon [42]. Chemoresistance is another problem in the management of ovarian cancer, for which several novel agents are now under investigation [3, 41, 43]. Although recurrent disease is generally incurable, management with surgery, combination of salvage chemotherapy, and targeted therapy might improve progression-free survival [41]. Advances in the molecular biology of ovarian cancer can promote the development of targeted therapy to provide personalized medicine. Our study indicated that a high CHI3L1 expression was an independent prognostic factor for EOC, even in the patients whose residual tumor size < 1cm after debulking surgery or who receiving paclitaxel-platinum chemotherapy. Our in vitro experiments also show that CHI3L1 can promote ovarian cancer cell resistance to paclitaxel by up-regulating Mcl-1. These findings may be incorporated into trials of new agents to treat EOC. Based on the CHI3L1 expression in ovarian cancer tissue, appropriate candidates can be selected to receive combinations of paclitaxel-platinum chemotherapy and other novel anti-apoptotic agents, especially Mcl-1. A combination of anti- CHI3L1 neutralizing antibody and irradiation can synergistically inhibit tumor vascularization and progression in xenografted brain tumor models [44, 45]. Also, resveratrol was found to repress the expression of CHI3L1 in glioma cells in in vitro experiments [46]. Currently, no cancer therapeutic agent related to CHI3L1 or YKL 40 has been reported. Our current study may provide preliminary findings for developing specific therapies [47]. Further clinical trials are needed to prove the utility of CHI3L1 in managing patients with ovarian cancer.
MATERIALS AND METHODS
Patients and specimens
The study protocol was approved by the Institutional Review Board of the hospital. Patients with EOC who received staging or debulking surgery and adjuvant platinum-based chemotherapy were enrolled, and informed consent was obtained before collecting samples. Cancerous tissue specimens were collected during surgery, immediately frozen in liquid nitrogen, and stored at −70°C until the experiments. Normal ovarian tissues were collected from women with benign gynecologic lesions who underwent bilateral salpingo-oophorectomy and were also immediately frozen in liquid nitrogen and stored at −70°C until the experiments. The maximal residual tumor size after surgery was recorded and was divided as two groups- ≤ 1 cm and > 1 cm. Histological grading was based on the International Union against Cancer criteria, and staging was based on the criteria of the International Federation of Gynecology and Obstetrics [48]. The patients received regular follow-up every 3 months after the primary treatment. Abnormal results of imaging studies (including computerized tomography or magnetic resonance imaging), elevated CA125 (more than 2 times the upper normal limit) of two consecutive tests in 2-week intervals, or biopsy-proven disease were defined as recurrence. Patients with disease progression or recurrence 6 months or less after completing adjuvant chemotherapy were defined as being chemoresistant, while those without recurrence or recurrence more than 6 months after completing adjuvant chemotherapy were defined as chemosensitive. Progression-free survival was calculated as the period from the date of completing chemotherapy to the date of confirmed recurrence, disease progression, or last follow-up. Overall survival was calculated as the period from surgery to the date of death associated with disease or the date of last follow-up. Pre-existing clinical data including age, menopausal status, clinical stage, treatment history, surgical findings during debulking, recurrence status, and survival were collected from medical records stored in a centralized database.
RNA extraction from cancer tissues
Total RNA of the tissue specimens was isolated with Trizol reagent (Invitrogen Corporation, Carlsbad, CA), according to the manufacturer’s instructions. The samples were subsequently passed over a Qiagen RNeasy column (Qiagen, Valencia, CA) for removal of small fragments that affect RT reaction and hybridization quality. After RNA recovery, cDNA was synthesized by a chimeric oligonucleotide with an oligo-dT and a T7 RNA polymerase promoter at a concentration of 100 pmol/μL.
Quantitative real-time polymerase chain reaction (QRT-PCR)
First-strand cDNA was synthesized using a RevertAid first strand cDNA synthesis kit (Thermo Fisher Scientific, Waltham, MA). QRT-PCR was performed using a LightCycler Real-Time detection system (Roche Diagnostics, Mannheim, Germany). The relative abundance of mRNA level was calculated by using the comparative method with G6PDH as the internal control. Detection of CHI3L1 was performed using the primer Hs00609691_m1 (TaqMan® Assays, Life Technologies Corporation) with 50 cycles of 10 seconds at 95°C, 10 seconds at 60°C, and 10 seconds at 72°C. Detection of G6PDH was performed using the LightCycler h-G6PDH housekeeping gene set (Roche Applied Science, Indianapolis, IN) with 50 cycles of 10 seconds at 95°C, 15 seconds at 55°C, and 15 seconds at 72°C.
The comparative 2−ΔΔCt method was used to calculate the expression of the target gene as described previously [49]. Generation of quantitative data was based on the number of cycles needed for amplification-generated fluorescence to reach a specific threshold of detection (the Ct value). For the relative quantification of gene expression on the basis of adding fixed amounts of RNA-starting material to the reactions, the Ct values obtained for each real-time PCR were first transformed using the term E−Ct, where E is reaction efficiency, divided by the corresponding value obtained for the same gene in the reference sample (normal ovarian tissues). The following equation was used to calculate the expression level of CHI3L1 in each sample: Relative expression level of CHI3L1 = 2−ΔΔCt, ΔCt = Ct target (CHI3L1) − Ct housekeeping (G6PDH), ΔΔCt = ΔCt sample (ovarian cancer tissue) −ΔCt calibrator (normal ovarian tissue).
Reverse-transcription polymerase chain reaction (RT-PCR)
RNA was first reverse-transcribed to cDNA using a Moloney murine leukemia virus reverse transcriptase kit (Invitrogen Life Technologies, San Diego, CA). To generate CHI3L1, sense primer TGTGAAGGCGTCTCAAACAG and anti-sense primer AATTCGGCCTTCATTTCCTT were used for 30 cycles. Glyceraldehyde-3-phosphate dehydrogenase (GAPDH) was used as the housekeeping gene to compare with CHI3L1. To generate GAPDH, sense primer ACCCAGAAGACTGTGGATGG and antisense promer TGCTGTA GCCAAATTCGTTG were used for 30 cycles. The PCR products were then analyzed in 1% agarose gel with EtBr staining in TBE solution.
Transfection of CHI3L1 in OVCAR3 cells
The OVCAR3 cell line was obtained from the American Type Culture Collection (Manassas, VA). The transcription status of CHI3L1 in OVCAR3 cells was checked by RT-PCR as described above. The plasmid PLKO_AS3w.puro was purchased from the National RNAi Core Facility (Academia Sinica, Taiwan). To generate PLKO_AS3w CHI3L1.puro, CHI3L1 was first amplified by PCR using OVCAR3 cell cDNA as the template with sense primer (NheI) Hu-CHI3L1_S_NheI GGCTAGCACCATGGGTGTGAAGGCGTCTCAAAC and anti-sense primer (PstI) Hu-CHI3L1_AS_PstI TAACTGCAGCTCAGCCTGGGACTCAGCA. The amplified product was then cloned into the NheI/PstI sites of PLKO_AS3w.puro. The transfection was followed the protocol on the website http://rnai.genmed.sinica.edu.tw/webContent/web/protocols. OVCAR3 cells transfected with PLKO_AS3w.puro (mock) were used as the control. The CHI3L1 expression was assayed by RT-PCR and Western blot. The stable clones of various OVCAR3 transfectants were used in the following experiments.
Knock-down of CHI3L1 in CA5171 cells
To eliminate endogenous CHI3L1 expression in CA5171 cells [40], an in-vitro knock-down experiment by small hairpin RNA (shRNA) targeting to CHI3L1 were performed. shRNA for CHI3L1 was purchased from National RNAi Core Facility. CHI3L1 shRNA constructed lentivirus were collected from 293T cells transfected with shRNA vector, Δ8.91and pMD.G. All plasmids were re-suspended in Opti-MEM® medium and transfected by using Lipofectamine2000 reagent according to the manufacturer’s instructions. To generate CHI3L1-knockdown CA5171 cells (CA5171-shCHI3L1), CA5171 cell were seeded in 6-cm dishes and infected with CHI3L1 shRNA lentivirus containing 10 μg/ml polybrene for 48 hours. For selecting of stable clones, puromycin were added to the culture medium for further 48-hour incubation. The CHI3L1 expression was assayed by RT-PCR and Western blot. The stable clones of various CA5171 transfectants were used in the following experiments.
Transfection of CHI3L1 in HEC1b cells
The HEC1b cell line was obtained from the American Type Culture Collection (Manassas, VA). The transcription status of CHI3L1 in HEC1b cells was checked by RT-PCR as described above. The plasmid PLKO_AS3w.puro was purchased from the National RNAi Core Facility (Academia Sinica, Taiwan). To generate PLKO_AS3w CHI3L1.puro, CHI3L1 was first amplified by PCR using HEC1b cell cDNA as the template with sense primer (NheI) Hu-CHI3L1_S_NheI GGCTAGCACCATGGGTGTGAAGGCGTCTCAAAC and anti-sense primer (PstI) Hu-CHI3L1_AS_PstI TAACTGCAGCTCAGCCTGGGACTCAGCA. The amplified product was then cloned into the NheI/PstI sites of PLKO_AS3w.puro. The transfection was followed the protocol on the website http://rnai.genmed.sinica.edu.tw/webContent/web/protocols. HEC1b cells transfected with PLKO_AS3w.puro (mock) were used as the control. The CHI3L1 expression was assayed by RT-PCR and Western blot. The stable clones of various HEC1b transfectants were used in the following experiments.
Knock-down of CHI3L1 in HEC151 cells
To eliminate endogenous CHI3L1 expression in HEC151 cells, an in-vitro knock-down experiment by small hairpin RNA (shRNA) targeting to CHI3L1 were performed. shRNA for CHI3L1 was purchased from National RNAi Core Facility. CHI3L1 shRNA constructed lentivirus were collected from 293T cells transfected with shRNA vector, Δ8.91and pMD.G. All plasmids were re-suspended in Opti-MEM® medium and transfected by using Lipofectamine2000 reagent according to the manufacturer’s instructions. To generate CHI3L1-knockdown HEC151 cells (HEC151-shCHI3L1), HEC151 cell were seeded in 6-cm dishes and infected with CHI3L1 shRNA lentivirus containing 10 μg/ml polybrene for 48 hours. For selecting of stable clones, puromycin were added to the culture medium for further 48-hour incubation. The CHI3L1 expression was assayed by RT-PCR and Western blot. The stable clones of various HEC151 transfectants were used in the following experiments.
Apoptotic assays of the ovarian cancer cells
Apoptotic assays of the various OVCAR3, CA5171, HEC1b and HEC151 transfectants treated with respective cytotoxic agent were performed by detecting 7-amino-actinomycin D (7-AAD) and annexin V in these cells. Briefly, the cells were treated with 2.5 nM of paclitaxel or 12.5 μM of cisplatin for 48 hours. Paclitaxel and cisplatin were purchased from Sigma-Aldrich (Sigma-Aldrich, St. Louis, MO). The preparation and dosage of these drugs were according to the manufacturer’s instructions and previous studies [50, 51]. Cells treated with PBS were used as the negative control. The cells were then incubated with 7-AAD and FITC-conjugated annexin V (BD Bioscience, Franklin Lakes, NJ), respectively, according to the manufacturer’s instructions, and were then analyzed by flow cytometry (FACScan; BD Bioscience, Franklin Lakes, NJ).
Immunoprecipitation and immunoblotting
Immunoblotting assays of the various OVCAR3, CA5171, HEC1b and HEC151 transfectants were performed. Briefly, the cells were first lysed in the immunoprecipitation assay buffer, and the protein extracts were quantified using a BCA Protein Assay Kit (Pierce, Rockford, IL). Fifty μg of each cell lysate was then resolved by SDS/PAGE (12% gel), transferred onto a PVDF/nylon membrane (EMD Millipore, Billerica, MA), and probed with Abs specific to α-tubulin, YKL, Mcl-1, Bcl-2, Bak and Bax (Upstate Biotechnology, Lake Placid, NY). The membrane was then probed with horseradish peroxidase-conjugated secondary Ab (Upstate Biotechnology, Lake Placid, NY). The specific bands were visualized by an ECL® Western blotting system (GE Healthcare, Little Chalfont, UK). Protein levels were measured by densitometric analysis and normalized to the levels of α-tubulin (control) by ImageQuant 5.0 software (Molecular Dynamics Inc., Sunnyvale, CA). The expression level of each protein was presented as the fold change in comparison with the density of α-tubulin, and the expression levels in the original OVCAR3, CA5171, HEC1b and HEC151 cells were used as the reference.
Statistical analysis
All statistical analyses were performed using SPSS version 15.0 (SPSS Inc., Chicago, IL, USA). Comparisons between unpaired groups were made using one-way analysis of variance (ANOVA) or the Student’s t-test for continuous variables and Fisher’s exact test for categorical variables. Levels of CHI3L1 of more than 0.1 were defined as a high CHI3L1 expression, and those less than 0.1 were defined as a low CHI3L1 expression. Survival curves were generated using the Kaplan-Meier method, and differences in survival curves were calculated using the log rank test. Cox regression analysis was used to evaluate the prognostic factors for recurrence and death. All data were expressed as mean ± S.E. from at least three different experiments. p values less than 0.05 were considered to be statistically significant.
ACKNOWLEDGMENTS AND FUNDING
This work was supported in part by the 7th Core Laboratory Facility of the Department of Medical Research of National Taiwan University Hospital, with grants NTUH103-S2376 and NTUH103-M2600 from National Taiwan University Hospital, grant 102-EDN04 from E-da Hospital Kaohsiung, Taiwan-National Taiwan University Hospital Joint Research Program, and grant NSC 101-2314-B-002-188-MY3 and 102-2321-B-002-080-MY2 from the Ministry of Science and Technology, Taipei, Taiwan. The authors thank the Taiwan Gynecologic Cancer (TGC) Network for providing part of the tissue samples and related clinical data for our research work. The TGC Network is support by National Research Program for Biopharmaceuticals (MOST 103-2325-B-002-032). The TGC Network currently includes 8 medical centers (National Taiwan University Hospital, Chi Mei Hospital, Veteran General Hospital—Taipei, Taichung and Kaohsiung, Tri-Service General Hospital, China Medical University Hospital and Mackay Memorial Hospital).
CONFLICTS OF INTEREST
The authors declare no potential conflict of interest.
Authorship
Y.C.C., C.A.C., and W.F.C. designed experiments analyzed data and wrote the manuscript; H.W.L. and T.C.C. performed the in vitro apoptotic assays, immunoprecipitation and immunoblotting; M.C.C and C.F.C. performed the real-time PCR; Y.C.C., S.F.H. and W.F.C analyzed the data. C.F.F., C.A.C. and W.F.C. discussed experiments and edited the paper.
REFERENCES
1. Siegel R, Naishadham D, Jemal A. Cancer statistics, 2012. CA Cancer J Clin. 2012; 62:10–29.
2. Chiang YC, Chen CA, Chiang CJ, Hsu TH, Lin MC, You SL, Cheng WF, Lai MS. Trends in incidence and survival outcome of epithelial ovarian cancer: 30-year national population-based registry in Taiwan. J Gynecol Oncol. 2013; 24:342–351.
3. Agarwal R, Kaye SB. Ovarian cancer: strategies for overcoming resistance to chemotherapy. Nat Rev Cancer. 2003; 3:502–516.
4. Stuart GC. First-line treatment regimens and the role of consolidation therapy in advanced ovarian cancer. Gynecologic Oncology. 2003; 90:S8–15.
5. O'Gorman DM, Cotter TG. Molecular signals in anti-apoptotic survival pathways. Leukemia. 2001; 15:21–34.
6. Vikhanskaya F, Marchini S, Marabese M, Galliera E, Broggini M. P73a overexpression is associated with resistance to treatment with DNA-damaging agents in a human ovarian cancer cell line. Cancer Res. 2001; 61:935–938.
7. Yamamoto K, Kikuchi Y, Kudoh K, Nagata I. Modulation of cisplatin sensitivity by taxol in cisplatin-sensitive and -resistant human ovarian carcinoma cell lines. J Cancer Res Clin Oncol. 2000; 126:168–172.
8. Johansen JS, Schultz NA, Jensen BV. Plasma YKL-40: a potential new cancer biomarker? Future oncology (London, England). 2009; 5:1065–1082.
9. Choudhuri S, Sharma C, Banerjee A, Kumar S, Kumar L, Singh N. A repertoire of biomarkers helps in detection and assessment of therapeutic response in epithelial ovarian cancer. Mol Cell Biochem. 2014; 386:259–269%.
10. Dehn H, Hogdall EV, Johansen JS, Jorgensen M, Price PA, Engelholm SA, Hogdall CK. Plasma YKL-40, as a prognostic tumor marker in recurrent ovarian cancer. Acta Obstet Gynecol Scand. 2003; 82:287–293.
11. Dupont J, Tanwar MK, Thaler HT, Fleisher M, Kauff N, Hensley ML, Sabbatini P, Anderson S, Aghajanian C, Holland EC, Spriggs DR. Early detection and prognosis of ovarian cancer using serum YKL-40. J Clin Oncol. 2004; 22:3330–3339.
12. Gronlund B, Hogdall EV, Christensen IJ, Johansen JS, Norgaard-Pedersen B, Engelholm SA, Hogdall C. Pre-treatment prediction of chemoresistance in second-line chemotherapy of ovarian carcinoma: value of serological tumor marker determination (tetranectin, YKL-40, CASA, CA 125). The International journal of biological markers. 2006; 21:141–148.
13. Hogdall EV, Johansen JS, Kjaer SK, Price PA, Christensen L, Blaakaer J, Bock JE, Glud E, Hogdall CK. High plasma YKL-40 level in patients with ovarian cancer stage III is related to shorter survival. Oncol Rep. 2003; 10:1535–1538.
14. Hogdall EV, Ringsholt M, Hogdall CK, Christensen IJ, Johansen JS, Kjaer SK, Blaakaer J, Ostenfeld-Moller L, Price PA, Christensen LH. YKL-40 tissue expression and plasma levels in patients with ovarian cancer. BMC Cancer. 2009; 9:8.
15. Yip P, Chen TH, Seshaiah P, Stephen LL, Michael-Ballard KL, Mapes JP, Mansfield BC, Bertenshaw GP. Comprehensive serum profiling for the discovery of epithelial ovarian cancer biomarkers. PLoS One. 2011; 6:e29533.
16. Wang D, Zhai B, Hu F, Liu C, Zhao J, Xu J. High YKL-40 serum concentration is correlated with prognosis of Chinese patients with breast cancer. PLoS One. 2012; 7:e51127.
17. Bernardi D, Padoan A, Ballin A, Sartori M, Manara R, Scienza R, Plebani M, Della Puppa A. Serum YKL-40 following resection for cerebral glioblastoma. Journal of neuro-oncology. 2012; 107:299–305.
18. Corradi M, Goldoni M, Alinovi R, Tiseo M, Ampollini L, Bonini S, Carbognani P, Casalini A, Mutti A. YKL-40 and mesothelin in the blood of patients with malignant mesothelioma, lung cancer and asbestosis. Anticancer Res. 2013; 33:5517–5524.
19. Kazakova M, Batalov A, Deneva T, Mateva N, Kolarov Z, Sarafian V. Relationship between sonographic parameters and YKL-40 levels in rheumatoid arthritis. Rheumatology international. 2013; 33:341–346.
20. Sakamoto F, Katakami N, Kaneto H, Yasuda T, Takahara M, Miyashita K, Kuroda A, Matsuhisa M, Kosugi K, Shimomura I. Association of serum YKL-40 levels with urinary albumin excretion rate in young Japanese patients with type 1 diabetes mellitus. Endocrine journal. 2013; 60:73–79.
21. Harutyunyan M, Gotze JP, Winkel P, Johansen JS, Hansen JF, Jensen GB, Hilden J, Kjoller E, Kolmos HJ, Gluud C, Kastrup J. Serum YKL-40 predicts long-term mortality in patients with stable coronary disease: a prognostic study within the CLARICOR trial. Immunobiology. 2013; 218:945–951.
22. Ku BM, Lee YK, Ryu J, Jeong JY, Choi J, Eun KM, Shin HY, Kim DG, Hwang EM, Yoo JC, Park JY, Roh GS, Kim HJ, Cho GJ, Choi WS, Paek SH, et al. CHI3L1 (YKL-40) is expressed in human gliomas and regulates the invasion, growth and survival of glioma cells. Int J Cancer. 2011; 128:1316–1326.
23. Areshkov PO, Avdieiev SS, Balynska OV, Leroith D, Kavsan VM. Two closely related human members of chitinase-like family, CHI3L1 and CHI3L2, activate ERK1/2 in 293 and U373 cells but have the different influence on cell proliferation. International journal of biological sciences. 2012; 8:39–48.
24. Singh SK, Bhardwaj R, Wilczynska KM, Dumur CI, Kordula T. A complex of nuclear factor I-X3 and STAT3 regulates astrocyte and glioma migration through the secreted glycoprotein YKL-40. The Journal of biological chemistry. 2011; 286:39893–39903.
25. Francescone RA, Scully S, Faibish M, Taylor SL, Oh D, Moral L, Yan W, Bentley B, Shao R. Role of YKL-40 in the angiogenesis, radioresistance, and progression of glioblastoma. The Journal of biological chemistry. 2011; 286:15332–15343.
26. Shao R, Hamel K, Petersen L, Cao QJ, Arenas RB, Bigelow C, Bentley B, Yan W. YKL-40, a secreted glycoprotein, promotes tumor angiogenesis. Oncogene. 2009; 28:4456–4468.
27. Francescone R, Ngernyuang N, Yan W, Bentley B, Shao R. Tumor-derived mural-like cells coordinate with endothelial cells: role of YKL-40 in mural cell-mediated angiogenesis. Oncogene. 2014; 33:2110–2122.
28. Chudecka-Glaz A, Gorski B, Zielinska D, Blogowski W, Wojciechowska I, Bedner R, Rzepka-Gorska I. Serum YKL-40 levels in patients with ovarian cancer and women with BRCA1 gene mutation—comparison to CA 125 antigen. Eur J Gynaecol Oncol. 2009; 30:668–671.
29. Chudecka-Glaz AM, Cymbaluk-Ploska AA, Menkiszak JL, Sompolska-Rzechula AM, Toloczko-Grabarek AI, Rzepka-Gorska IA. Serum HE4, CA125, YKL-40, bcl-2, cathepsin-L and prediction optimal debulking surgery, response to chemotherapy in ovarian cancer. J Ovarian Res. 2014; 7:62.
30. Allin KH, Bojesen SE, Johansen JS, Nordestgaard BG. Cancer risk by combined levels of YKL-40 and C-reactive protein in the general population. Br J Cancer. 2012; 106:199–205.
31. Ozdemir E, Cicek T, Kaya MO. Association of serum YKL-40 level with tumor burden and metastatic stage of prostate cancer. Urology journal. 2012; 9:568–573.
32. Celik C, Abali R, Guzel S, Bastu E, Kucukyalcin V, Yilmaz M. Elevated circulating levels of YKL-40 are a marker of abnormal glucose tolerance in women with polycystic ovary syndrome. Clinical endocrinology. 2012; 77:893–897.
33. Park HY, Jun CD, Jeon SJ, Choi SS, Kim HR, Choi DB, Kwak S, Lee HS, Cheong JS, So HS, Lee YJ, Park DS. Serum YKL-40 levels correlate with infarct volume, stroke severity, and functional outcome in acute ischemic stroke patients. PLoS One. 2012; 7:e51722.
34. Konradsen JR, James A, Nordlund B, Reinius LE, Soderhall C, Melen E, Wheelock AM, Lodrup Carlsen KC, Lidegran M, Verhoek M, Boot RG, Dahlen B, Dahlen SE, Hedlin G. The chitinase-like protein YKL-40: a possible biomarker of inflammation and airway remodeling in severe pediatric asthma. The Journal of allergy and clinical immunology. 2013; 132:328–335. e325.
35. Stawerski P, Wagrowska-Danilewicz M, Stasikowska-Kanicka O, Danilewicz M. Increased tissue immunoexpression of YKL-40 protein in high grade serous ovarian cancers. Pathology, research and practice. 2011; 207:573–576.
36. Yang GF, Cai PY, Li XM, Deng HX, He WP, Xie D. Expression and clinical significance of YKL-40 protein in epithelial ovarian cancer tissues. Ai zheng = Aizheng = Chinese journal of cancer. 2009; 28:142–145.
37. Zhang W, Kawanishi M, Miyake K, Kagawa M, Kawai N, Murao K, Nishiyama A, Fei Z, Zhang X, Tamiya T. Association between YKL-40 and adult primary astrocytoma. Cancer. 2010; 116:2688–2697.
38. Wang TH, Wang HS, Soong YK. Paclitaxel-induced cell death: where the cell cycle and apoptosis come together. Cancer. 2000; 88:2619–2628.
39. OVCAR-3. (ATCC® HTB-161™) American Type Culture Collection. http://www.atcc.org/Products/All/HTB-161.aspx
40. Chiang YC, Cheng WF, Chang MC, Lu TP, Kuo KT, Lin HP, Hsieh CY, Chen CA. Establishment of a New Ovarian Cancer Cell Line CA5171. Reproductive sciences (Thousand Oaks, Calif). 2015; 22:725–734.
41. Coleman RL, Monk BJ, Sood AK, Herzog TJ. Latest research and treatment of advanced-stage epithelial ovarian cancer. Nature reviews Clinical oncology. 2013; 10:211–224.
42. Wakabayashi MT, Lin PS, Hakim AA. The role of cytoreductive/debulking surgery in ovarian cancer. J Natl Compr Canc Netw. 2008; 6:803-810; quiz 811.
43. Matsuo K, Lin YG, Roman LD, Sood AK. Overcoming platinum resistance in ovarian carcinoma. Expert opinion on investigational drugs. 2010; 19:1339–1354.
44. Shao R, Francescone R, Ngernyuang N, Bentley B, Taylor SL, Moral L, Yan W. Anti-YKL-40 antibody and ionizing irradiation synergistically inhibit tumor vascularization and malignancy in glioblastoma. Carcinogenesis. 2014; 35:373–382.
45. Faibish M, Francescone R, Bentley B, Yan W, Shao R. A YKL-40-neutralizing antibody blocks tumor angiogenesis and progression: a potential therapeutic agent in cancers. Mol Cancer Ther. 2011; 10:742–751.
46. Zhang W, Murao K, Zhang X, Matsumoto K, Diah S, Okada M, Miyake K, Kawai N, Fei Z, Tamiya T. Resveratrol represses YKL-40 expression in human glioma U87 cells. BMC Cancer. 2010; 10:593.
47. Johansen JS, Jensen BV, Roslind A, Price PA. Is YKL-40 a new therapeutic target in cancer? Expert opinion on therapeutic targets. 2007; 11:219–234.
48. Prat J. Staging classification for cancer of the ovary, fallopian tube, and peritoneum. Int J Gynaecol Obstet. 2014; 124:1–5.
49. Livak KJ, Schmittgen TD. Analysis of relative gene expression data using real-time quantitative PCR and the 2(-Delta Delta C(T)) Method. Methods. 2001; 25:402–408.
50. Smith JA, Ngo H, Martin MC, Wolf JK. An evaluation of cytotoxicity of the taxane and platinum agents combination treatment in a panel of human ovarian carcinoma cell lines. Gynecol Oncol. 2005; 98:141–145.
51. Kelland LR, Abel G. Comparative in vitro cytotoxicity of taxol and Taxotere against cisplatin-sensitive and -resistant human ovarian carcinoma cell lines. Cancer Chemother Pharmacol. 1992; 30:444–450.