
INTRODUCTION
Gastric cancer (GC), one of the most common malignancies worldwide, is also the primary cause of cancer-related deaths in China and internationally [1]. Due in part to the absence of early diagnostic modalities, GC is usually diagnosed at late stages, with a very poor prognosis. The 5-year survival rate of late-stage GC is only 3.1%, whereas the 5-year survival of early GC is up to 90% [2]. Therefore, it is critical to further elucidate the molecular pathogenesis of GC in order to identify molecular biomarkers for early detection and novel targets for effective therapy.
MicroRNAs (miRNAs) are small, single-stranded RNAs that negatively modulate transcription by sequence-specific interaction with the 3′ untranslated regions (UTRs) of target mRNAs [3]. Their target genes are involved in many cancer-related cellular processes, including cell cycle regulation, differentiation, apoptosis, and invasion/migration. MiRNAs have been characterized as oncogenes or tumor suppressors [4]. Dysregulated expression of miRNAs is a newly proposed mechanism of cancer pathogenesis [5, 6]; specific miRNAs are associated with each type of tumor development and progression [7, 8]. Nevertheless, the unique expression profiles of miRNAs and their downstream signaling pathways in GC remain incompletely characterized. Therefore, the purpose of the current study was to delineate the global miRNA expression profile and related signaling networks in GC.
MiRNA microarray analyses were first performed to identify dysregulated miRNAs in human GC cell lines. 16 miRNAs were found to be aberrantly expressed, 11 of which were chosen and validated by real-time qRT-PCR miRNAs-106a, -17, -20a, -92a, -100, -125b, -127-3p, -145, -381, and -455. Results of these qRT-PCRs agreed with miRNA microarray data. 2,532 potential mRNA targets of these miRNAs, related to cell proliferation, cell death, apoptosis, and known vital tumorigenesis signaling pathways, were predicted by further bioinformatics analyses based on the online miRWalk database. In addition, miRNA-gene network analyses suggested miRNA-125b as a key miRNA in GC pathogenesis.
RESULTS
Identification of dysregulated miRNAs
To better understand miRNA dysregulation in GC cells, comprehensive miRNA expression profiles were assessed in two groups of gastric cell lines by microRNA microarray. The expression patterns of normal gastric cells (HFE145) and GC cells (NCI-N87, MKN28, RF1, KATO III and RF48) were distinct (Figure 1). MiRNAs exhibiting two-fold or greater differences between all 5 GC cell lines and normal cells are shown in Supplementary Tables S1 and S2. In total, 16 significantly dysregulated miRNAs were identified from microarray analyses. Relative to the expression profile of the normal gastric cell line HFE145, 6 miRNAs (miRNAs-106a, -17, -20a, -20b, -92a and -96) were consistently overexpressed, while 10 miRNAs (miRNAs-100, -125b, -127, -145, -193a, -381, -455, -483, -601, and -671) were uniformly downregulated in all 5 GC cell lines (Figure 2).
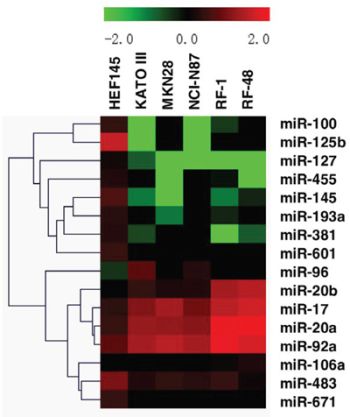
Figure 1: Alterations in miRNA expression profiles across 5 gastric cancer cell lines and 1 normal gastric cell line.
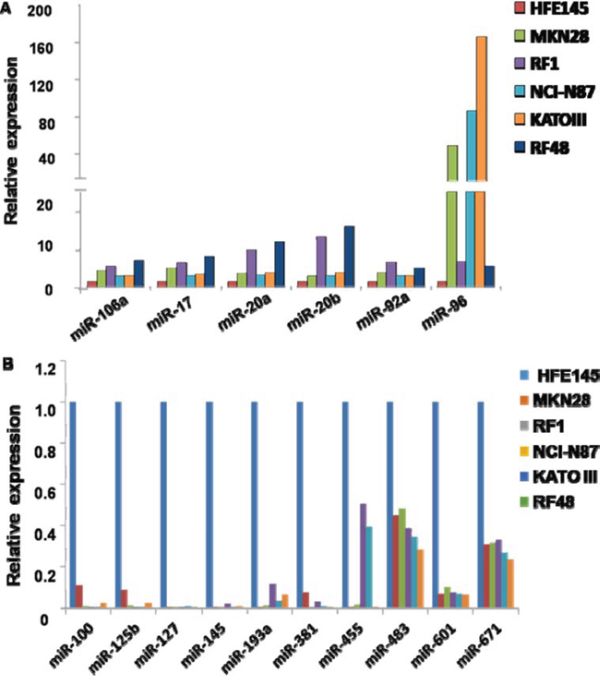
Figure 2: MiRNAs upregulated and downregulated in all 5 gastric cancer cell lines by microRNA microarray. A. Expression patterns of upregulated miRNAs; B. Expression patterns of down-regulated miRNAs. MiRNAs in Figures A and B were identified based on a ≥ 2-fold change in signal intensity on microarrays.
Validation of miRNA expression by qRT-PCR
To validate miRNA microarray data, qRT-PCRs were performed using TaqMan MicroRNA Assays. 11 miRNAs (miRNAs-106a, -17, -20a, -92a, -96, -100, -125b, -127-3p, -145, -193a, -381) were randomly selected for validation from the 16 significantly dysregulated miRNAs. Expression levels of all 11 miRNAs by qRT-PCR agreed consistently with miRNA microarray results. Among these 11 miRNAs, 5(miRNAs-106a, -17, -20a, -92a and -92a) and 6(miRNAs-100, -125b, -145, -127, -193a and -381) were upregulated or downregulated more than 2-fold in all 5 GC cell lines, respectively (Figure 3). These results showed that gastric tumorigenesis was characterized by significant changes in miRNA expression profiles.
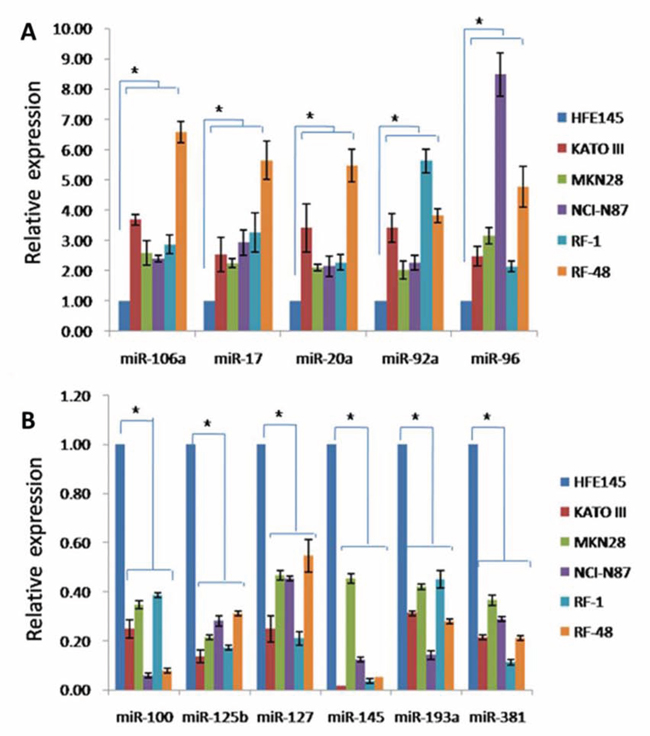
Figure 3: Validation of miRNA expression alterations in GC cells. A. Expression levels of upregulated miRNAs in human GC cells determined by qRT-PCR. B. Expression levels of downregulated miRNAs in human GC cells determined by qRT-PCR. P < 0.05.
GO analysis
To elucidate functions of dysregulated miRNAs in GC, potential mRNA targets of altered miRNAs were collected using the Validated Target module of miRWalk. 2,532 targets were obtained. Among these targets, deduplication was conducted and 703 (27.7%) targets were finally saved.
The functions of these 703 target genes were then analyzed using GO annotation with the DAVID tool. When setting the cutoff standard at P < 0.01 and FDR < 0.05, 446, 27 and 33 GO terms, respectively, were found from three ontologies: biological processes, cellular components and molecular functions (Table 1). The 10 most significant GO terms are shown in Table 1. In addition, cluster analysis was also conducted to search for the enrichment of targets represented by the negative logarithm of the P value (–Log (P)) in the ontology of biological processes. The top 10 functional classes are shown in Figure 4. According to cluster analyses for biological functions, most of the predicted targets of altered miRNAs were involved in cell proliferation, transcription, cell death, programmed cell death, RNA metabolic process, and gene expression. These functions are known to be strongly associated with human tumorigenesis and metastasis [9].
Table 1: The enriched GO categories of predicted targets genes (The top 10, FDR < 0.05, P < 0.01)
Term |
Count |
P Value |
Fold Enrichment |
FDR |
|---|---|---|---|---|
Most significant GO biological processes(total GO term = 446) |
||||
GO:0042127~regulation of cell proliferation |
149 |
1.77E-50 |
3.934269826 |
3.29E-47 |
GO:0010604~positive regulation of macromolecule metabolic process |
148 |
5.77E-45 |
3.588669796 |
1.07E-41 |
GO:0009891~positive regulation of biosynthetic process |
130 |
5.33E-43 |
3.886969687 |
9.87E-40 |
GO:0031328~positive regulation of cellular biosynthetic process |
128 |
3.01E-42 |
3.88304125 |
5.58E-39 |
GO:0051173~positive regulation of nitrogen compound metabolic process |
123 |
1.59E-41 |
3.968915476 |
2.95E-38 |
GO:0006357~regulation of transcription from RNA polymerase II promoter |
131 |
1.66E-41 |
3.744462545 |
3.08E-38 |
GO:0010557~positive regulation of macromolecule biosynthetic process |
122 |
4.48E-40 |
3.876454478 |
8.31E-37 |
GO:0010941~regulation of cell death |
137 |
5.13E-40 |
3.493136562 |
9.50E-37 |
GO:0043067~regulation of programmed cell death |
136 |
1.60E-39 |
3.48045069 |
2.96E-36 |
GO:0042981~regulation of apoptosis |
134 |
1.16E-38 |
3.463389657 |
2.15E-35 |
Most significant GO cellular component (total GO term = 27) |
||||
GO:0031981~nuclear lumen |
142 |
9.86E-23 |
2.313779081 |
1.41E-19 |
GO:0031974~membrane-enclosed lumen |
161 |
1.48E-20 |
2.049507218 |
2.11E-17 |
GO:0043233~organelle lumen |
158 |
3.70E-20 |
2.051101948 |
5.29E-17 |
GO:0005654~nucleoplasm |
100 |
4.74E-20 |
2.678754804 |
6.79E-17 |
GO:0070013~intracellular organelle lumen |
149 |
1.85E-17 |
1.978845413 |
2.65E-14 |
GO:0005667~transcription factor complex |
38 |
9.81E-14 |
4.275292668 |
1.40E-10 |
GO:0005829~cytosol |
107 |
4.97E-11 |
1.900788014 |
7.11E-08 |
GO:0044451~nucleoplasm part |
59 |
1.28E-10 |
2.511658424 |
1.83E-07 |
GO:0045121~membrane raft |
26 |
1.27E-09 |
4.295748614 |
1.82E-06 |
GO:0009986~cell surface |
42 |
2.43E-09 |
2.851488304 |
3.48E-06 |
Most significant GO molecular function (total GO term = 33) |
||||
GO:0030528~transcription regulator activity |
178 |
1.16E-31 |
2.441568622 |
1.79E-28 |
GO:0003700~transcription factor activity |
130 |
1.63E-27 |
2.765282215 |
2.53E-24 |
GO:0043565~sequence-specific DNA binding |
98 |
8.85E-27 |
3.348405977 |
1.37E-23 |
GO:0016563~transcription activator activity |
76 |
1.90E-24 |
3.844416738 |
2.95E-21 |
GO:0046983~protein dimerization activity |
82 |
1.61E-20 |
3.137727975 |
2.49E-17 |
GO:0003702~RNA polymerase II transcription factor activity |
49 |
2.67E-17 |
4.164923008 |
4.15E-14 |
GO:0046982~protein heterodimerization activity |
43 |
1.26E-15 |
4.287516896 |
1.90E-12 |
GO:0003677~DNA binding |
192 |
2.58E-15 |
1.708282449 |
3.96E-12 |
GO:0008134~transcription factor binding |
69 |
1.59E-14 |
2.789539077 |
2.46E-11 |
GO:0019899~enzyme binding |
68 |
1.33E-13 |
2.696546711 |
2.06E-10 |
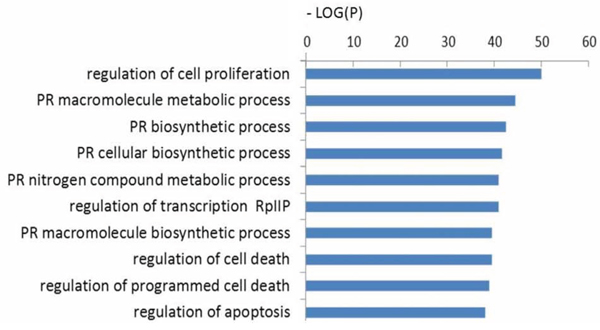
Figure 4: GO analysis of candidate target genes. Functional annotations of 16 differentially expressed miRNAs. −Log (P) values for negative logarithm of P value, greater value represents more enrichment of significance. PR: positive regulation; RpIIP: RNA polymerase II promoter.
KEGG pathway analysis
To gain a better understanding of the functions and regulatory networks of predicted target genes, we searched for target enrichment in KEGG. There were 702 differentially expressed genes identified in 29 pathways with a cutoff standard of P < 0.01 and FDR < 0.05 by KEGG pathway analysis (Table 2). These results revealed that the predicted targets of dysregulated miRNAs were associated with multiple tumor types, including bladder, pancreatic, lung and colorectal cancer. Predicted targets were correlated with apoptosis, cell cycle, and cell adhesion. Some important signaling pathways known to mediate tumorigenesis and metastasis were also involved, including the TGF-β, p53 and ErbB signaling pathways. Moreover, the MAPK cell cycle pathways were enriched according to–Log (P) values (Figure 5).
Table 2: The enriched pathways of the predicted target genes (FDR < 0.05, P < 0.01)
Pathway ID and Name |
genes |
P Value |
FDR |
|---|---|---|---|
hsa05200:Pathways in cancer |
98 |
1.41E-38 |
1.69E-35 |
hsa04010:MAPK signaling pathway |
53 |
4.51E-12 |
5.41E-09 |
hsa05215:Prostate cancer |
38 |
2.01E-20 |
2.42E-17 |
hsa04510:Focal adhesion |
38 |
3.57E-08 |
4.29E-05 |
hsa05212:Pancreatic cancer |
33 |
7.48E-19 |
8.98E-16 |
hsa04110:Cell cycle |
32 |
2.70E-10 |
3.24E-07 |
hsa05220:Chronic myeloid leukemia |
31 |
3.40E-16 |
4.00E-13 |
hsa05218:Melanoma |
29 |
5.96E-15 |
7.19E-12 |
hsa05222:Small cell lung cancer |
29 |
8.35E-13 |
1.00E-09 |
hsa04722:Neurotrophin signaling pathway |
29 |
1.96E-08 |
2.35E-05 |
hsa04210:Apoptosis |
28 |
1.48E-11 |
1.77E-08 |
hsa04620:Toll-like receptor signaling pathway |
27 |
3.37E-09 |
4.05E-06 |
hsa04660:T cell receptor signaling pathway |
27 |
1.56E-08 |
1.87E-05 |
hsa04350:TGF-beta signaling pathway |
26 |
5.49E-10 |
6.59E-07 |
hsa05214:Glioma |
25 |
1.36E-12 |
1.64E-09 |
hsa05210:Colorectal cancer |
25 |
1.40E-09 |
1.68E-06 |
hsa05219:Bladder cancer |
24 |
2.06E-16 |
2.66E-13 |
hsa04115:p53 signaling pathway |
24 |
7.07E-11 |
8.48E-08 |
hsa04012:ErbB signaling pathway |
24 |
1.62E-08 |
1.94E-05 |
hsa05223:Non-small cell lung cancer |
22 |
2.27E-11 |
2.72E-08 |
hsa05221:Acute myeloid leukemia |
21 |
8.66E-10 |
1.04E-06 |
hsa05211:Renal cell carcinoma |
19 |
9.60E-07 |
0.001151 |
hsa04520:Adherens junction |
19 |
4.27E-06 |
0.005122 |
hsa05213:Endometrial cancer |
18 |
4.12E-08 |
4.95E-05 |
hsa04621:NOD-like receptor signaling pathway |
17 |
3.70E-06 |
0.00444 |
hsa04920:Adipocytokine signaling pathway |
17 |
1.10E-05 |
0.013157 |
hsa04150:mTOR signaling pathway |
15 |
8.87E-06 |
0.010635 |
hsa04930:Type II diabetes mellitus |
14 |
1.35E-05 |
0.016212 |
hsa05216:Thyroid cancer |
13 |
2.21E-07 |
2.66E-04 |
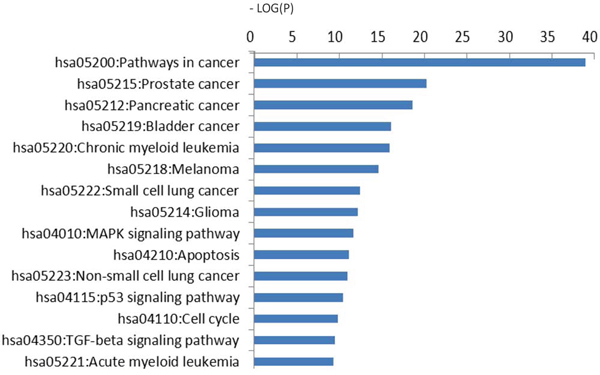
Figure 5: KEGG pathway analysis. Predicted targets of 16 significantly differentially expressed miRNAs. The vertical axis is the pathway category; the horizontal axis is the enrichment of pathways represented by −Log (P) values.
Potential causative miRNAs in GC
To further elucidate correlations between miRNAs and potential target genes, miRNA-gene network analyses were generated by Cytoscape (Figure 6). Relationships between miRNAs and target genes were analyzed by integrating the top GO analysis results with the KEGG pathway data. In this Figure, the size of each node is proportional to the purported functional connectivity of each miRNA. According to its size in this representation, miRNA-125b is the hub node with the most interactions, suggesting that it is a key causative point within this network.
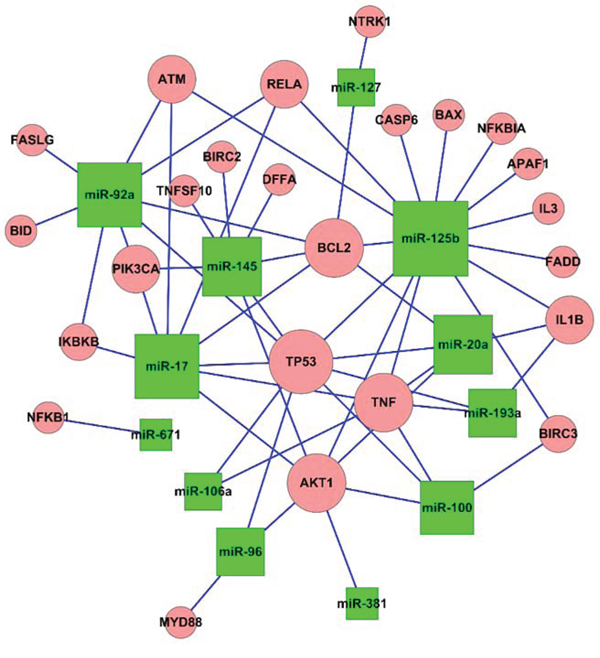
Figure 6: Presumed connections between miRNAs and the target genes. The network of apoptosis regulated by the target genes. The size of each node is proportional to the supposed functional connectivity of each miRNA according to numbers of putative target genes. MiRNA-125b is the largest node in the network.
DISCUSSION
During the past decade, miRNAs have emerged as key regulators in numerous oncogenic processes. Their discovery has initiated revolutionary progress in cancer research [10–12]. Thus, it is relevant to delineate the expression profiles, functions, and potential regulatory mechanisms of miRNAs in cancers. The current study investigated the expression signature of miRNAs in GC and analyzed their downstream targets, functions, and signaling pathways in GC.
Firstly, miRNA expression profiles were described in gastric cell lines (one NC- and 5 GC-derived cell lines). Compared with normal cells, 6 (miRNAs-106a, -17, -20a, -20b, -92a and -96) and 10 miRNAs (miRNAs-100, -125b, -127, -145, -193a, -381, -455, -483, -601, and -671) were uniformly and significantly overexpressed or downregulated in all 5 GC cell lines, respectively. The differential expression of 11 of these 16 dysregulated miRNAs was validated using RT-qPCR. These results suggest that gastric tumorigenesis is characterized by significant changes in miRNA expression profiles.
Although our microarray data was not validated in primary GC tissue samples, our findings are consistent with previous literature in GC as well as other cancer types. For example, miRNA-106a exhibits oncogenic functions in pancreatic cancer [13]. It was also found to be overexpressed in GC and to regulate invasion and metastasis [14–16]. MiRNAs-17, -20a and -92a, members of the miRNA-17-92 cluster, acting as oncogenes, are also overexpressed in GC tissues [17]. The expression level of miRNA-20b was also found to be increased in GC tissues [18]. Meanwhile, miRNAs-125b, -127, and -145 were downregulated in GC tissues and cell lines. MiRNA-145 was shown to suppress invasion, metastasis, and angiogenesis in GC cells [19–21]. The remaining dysregulated miRNAs that we identified are reported for the first time in GC. Thus, our results provide a rationale for further study of these novel dysregulated miRNAs in gastric tumorigenesis.
Since most miRNAs are believed to be involved in carcinogenesis by inhibiting target mRNAs, we predicted targets of these 16 altered miRNAs. In total, 2,532 targets were identified using the Validated Target module of miRWalk database. Further GO analyses revealed that the majority of predicted target genes functioned in modulating transcriptional regulation, cell proliferation, cell death, and programmed cell death. These functions are known to be closely related to human tumorigenesis and metastasis.
Signaling pathways regulated by validated targets of the 16 dysregulated miRNAs were assessed via KEGG pathway analysis. In the current study, the most significant pathways were closely associated with tumor pathogenesis, including pathways in cancer, pancreatic cancer, prostate cancer, chronic myeloid leukemia, and bladder cancer. In addition to pathways in cancer, the MAPK signaling pathway was also shown to be important in GC development. MAPKs (mitogen-activated protein kinases) principally comprise extracellular signaling–related kinases (ERKs), c-Jun NH2-terminal kinases (JNKs), and p38 MAPKs. These pathways play an important role in cell proliferation and differentiation, survival, apoptosis, and anti-apoptosis [22, 23] and are implicated in various tumor types. Furthermore, Liang et al. [24] showed that MAPKs, particularly the ERK subclass, are overexpressed and correlate with tumorigenesis and metastatic potential in GC. In our results, 53 potential mRNA targets were implicated in the MAPK pathway. Thus, elucidating oncogenic mechanisms by which miRNAs regulate the MAPK pathway represents a promising strategy for identifying new therapeutic targets in GC.
Finally, by combining GO terms and KEGG pathway analysis with network analyses, we identified a potential crucial miRNA in gastric carcinogenesis, miRNA-125b. MiRNA-125b can act as either a tumor suppressor or an oncogene, depending on tumor type, with either increased or decreased expression. For example, miRNA-125b expression is decreased in hepatocellular carcinoma (HCC) tissues and HCC cell lines vs. normal tissues and cells, suggesting a tumor-suppressive role in this organ [25]. Conversely, in pancreatic cancer, prostate cancer and acute myeloid leukemia, miRNA-125b levels are elevated, implying that it functions as an oncogene in these tissues [26–28]. MiRNA-125b expression levels are heterogeneous in GC cell lines and tissues, according to discoveries by several research groups. Matteo et al [19] found that miRNA-125b levels were significantly downregulated in GC tissues. However, another group showed that miRNA-125b was upregulated in GC (HGC-27, MKN-28, BGC-823, SGC-7901, AGS, and MKN-45 GC cell lines) vs. the normal gastric cell line GES-1 [29]. In our study, miRNA-125b was downregulated in all GC cell lines studied (NCI-N87, MKN28, RF1, KATO III and RF48) vs. HFE145. Inconsistent findings in previous studies may have been due to histologic heterogeneity in GC. Moreover, previous studies have indicated that expression of miRNA-125b is altered according to pathophysiological conditions [30–32]. For example, in papillary thyroid cancer, miRNA-125b is upregulated, while in anaplastic thyroid carcinoma, expression of miRNA-125b is reduced relative to normal thyroid tissue [32]. Notwithstanding the heterogeneous and controversial expression of miRNA-125b in various cancers, miRNA-125b plays a key role in regulating signaling pathways that mediate cell proliferation, differentiation, and apoptosis [33]. Thus, miRNA-125b may represent a potential biomarker for the diagnosis and independent prognostication of GC. Admittedly, no biological functional experiments have been conducted to elucidate the causative role of miRNA-125b. Nevertheless, further investigations are indicated to overcome this gap in knowledge.
In summary, 16 significantly dysregulated miRNAs were discovered in GC, including 6 up- and 10 down-regulated miRNAs. In addition, 2,532 potential target transcripts were predicted for these 16 miRNAs. Integrated GO and KEGG pathway analyses, combined with miRNA-gene network analyses, uncovered a potential key gastric oncogenic miRNA, miRNA-125b. These findings imply that dysregulated expression of miRNAs and their potential target mRNAs are prominently involved in the pathogenesis of GC, suggesting that dysregulated miRNAs may serve as potential biomarkers and therapeutic targets in GC patients.
MATERIALS AND METHODS
Cell lines
Human immortalized normal gastric epithelial cells (NC) HFE145 and GC cells (NCI-N87, MKN28, RF1, KATO III and RF48) were obtained from Howard University and the American Type Culture Collection, respectively. These cells were grown in DMEM medium containing 10% fetal bovine serum (FBS). Cell lines were cultured in a humidified air supplemented with 5% CO2 at 37°C.
Preparation of Total RNA
According to the manufacturer's instructions, total RNA, including the miRNAs, was extracted from cells by using the miRNeasy mini kit (Qiagen, Hilden, Germany). The RNA concentration was measured using a NanoDrop 2000 spectrophotometer (Thermo Fisher Scientific, Waltham, USA). The integrity and the quality of RNA were determined by Agilent 2100 Bioanalyzer (Agilent Technologies, Santa Clara, USA). RNAs with a 2100RIN (RNA integrity number) 6.0 and 28S/18S 0.7 were used for the miRNA array analysis and reverse transcription (RT).
MicroRNA microarrays
MicroRNA microarray analyses were performed on two groups of cell lines: normal gastric epithelial cells (NC) HFE145 and GC cells (NCI-N87, MKN28, RF1, KATO III and RF48). MicroRNA labeling and microarrays were performed with MicroRNA Labeling Reagent and Hybridization Kits (Agilent, Santa Clara, CA, USA) and Human microRNA Microarray Kits (V2, Agilent), respectively. All procedures were performed as described previously [34]. Every miRNA was represented by 2 probes and 15 replicates on each microarray, which contained 723 human miRNAs and 76 human viral miRNAs. 100 ng of total RNA from each cell line was treated with phosphatase and then labeled with cyanine 3-pCp. Hybridization was carried out according to manufacturers’ instructions. Hybridization signals were detected using an Agilent Microarray Scanner (Agilent) with Agilent's Scan Control version A.7.0.1 software. Quantile normalization was conducted. The value of two probes were averaged and used as the final expression level. Differential analysis was carried out using the Student t-test; P < 0.05 was set as the cut-off. MiRNAs that were up-regulated or down-regulated by at least two-fold between the two cell line groups were regarded as significantly dysregulated miRNAs.
Real-time quantitative reverse transcription PCR
Procedures for real-time quantitative reverse-transcription PCR (qRT-PCR) analyses have been described previously [35]. TaqMan MicroRNA Assays, Human (Applied Biosystems, Foster City, CA, USA) and U6 small nuclear RNA TaqMan RT–PCR amplicon (RNU6B TaqMan microRNA Assay kit, Applied Biosystems) were used to confirm miRNA and U6 expression, respectively. U6 was used as an internal control. Fold-change of expression was calculated by using Ct values in comparison with controls. Expression levels were determined by the comparative ΔCt method.
Target prediction and bioinformatic analyses
In silico prediction of miRNA target genes was carried out by miRWalk (http://www.umm.uni-heidelberg.de/apps/zmf/mirwalk/) [36]. The miRWalk database focuses on predicted as well as validated miRNA binding sites in all known genes in human, mouse and rat. In current study, the potential target genes were processed by the Validated Target module of the miRWalk database. For functional analyses of miRNA potential targets, GO term analysis was applied to organize genes into categories on the basis of biological processes, cellular components and molecular functions [35]. Biological pathways defined by Kyoto Encyclopedia of Genes and Genomes (KEGG) analysis were identified by DAVID (Database for Annotation, Visualization and Integrated Discovery) software (http://david.abcc.ncifcrf.gov/tools.jsp). DAVID online provides a set of functional annotations of a large number of genes. P-values of each pathway were adjusted by the method of Benjamini-Hochberg to control the false discovery rate (FDR). In current study, GO terms and signaling pathways were selected with the threshold of significance being defined as P < 0.01 and FDR < 0.05.
ACKNOWLEGDEMENTS AND FUNDING
We are grateful to Drs. Hassan Ashktorab and Duane Smoot for the provision of HFE-145 cells.
CONFLICTS OF INTEREST
The authors disclose no potential conflicts of interest.
GRANT SUPPORT
National Nature Science Foundation of China (81172282), the Shenzhen Peacock Plan (KQCX20130621101141669), the Planned Science and Technology Project of Shenzhen (GJHS201206 21142654087 and JCYJ20140418095735574), the Key Laboratory Project of Shenzhen (ZDSY201303291011 30496), Natural Science Foundation of SZU (201108 and T201202) to Z Jin; National Natural Youth Science Foundation of China (81302151) to X Zhang; Natural Science Foundation of Shenzhen University (201119) to Z Zhao; National Natural Youth Science Foundation of China (81071655) to YJ Wei; National Nature Science Foundation of China (81071655) to D Zheng; NIH grants DK087454, CA146799, CA173390, American Cancer Society Clinical Research Professorship to Stephen J. Meltzer. Dr. Meltzer is the Harry B. Myerberg-Thomas R. Hendrix Professor of Gastroenterology.
REFERENCES
1. Lv SX, Gan JH, Wang CC, Luo EP, Huang XP, Xie Y, Huang Y. Biopsy from the base of gastric ulcer may find gastric cancer earlier. Med Hypotheses. 2011; 76:249–250.
2. Tang L, Zhao S, Liu W, Parchim NF, Huang J, Tang Y, Gan P, Zhong M. Diagnostic accuracy of circulating tumor cells detection in gastric cancer: systematic review and meta-analysis. BMC cancer. 2013; 13:314.
3. Bartel DP. MicroRNAs: target recognition and regulatory functions. Cell. 2009; 136:215–233.
4. Lujambio A, Lowe SW. The microcosmos of cancer. Nature. 2012; 482:347–355.
5. Li X, Zhang Y, Zhang Y, Ding J, Wu K, Fan D. Survival prediction of gastric cancer by a seven-microRNA signature. Gut. 2010; 59:579–585.
6. Ueda T, Volinia S, Okumura H, Shimizu M, Taccioli C, Rossi S, Alder H, Liu CG, Oue N, Yasui W, Yoshida K, Sasaki H, Nomura S, Seto Y, Kaminishi M, Calin GA, et al. Relation between microRNA expression and progression and prognosis of gastric cancer: a microRNA expression analysis. Lancet Oncol. 2010; 11:136–146.
7. Carvalho J, van Grieken NC, Pereira PM, Sousa S, Tijssen M, Buffart TE, Diosdado B, Grabsch H, Santos MA, Meijer G, Seruca R, Carvalho B, Oliveira C. Lack of microRNA-101 causes E-cadherin functional deregulation through EZH2 up-regulation in intestinal gastric cancer. J Pathol. 2012; 228:31–44.
8. Tsukamoto Y, Nakada C, Noguchi T, Tanigawa M, Nguyen LT, Uchida T, Hijiya N, Matsuura K, Fujioka T, Seto M, Moriyama M. MicroRNA-375 is downregulated in gastric carcinomas and regulates cell survival by targeting PDK1 and 14-3-3zeta. Cancer Res. 2010; 70:2339–2349.
9. Labi V, Erlacher M. How cell death shapes cancer. Cell death & disease. 2015; 6:e1675.
10. Leonardo TR, Schultheisz HL, Loring JF, Laurent LC. The functions of microRNAs in pluripotency and reprogramming. Nat Cell Biol. 2012; 14:1114–1121.
11. van Rooij E, Olson EN. MicroRNA therapeutics for cardiovascular disease: opportunities and obstacles. Nat Rev Drug Discov. 2012; 11:860–872.
12. Nana-Sinkam SP, Croce CM. Clinical applications for microRNAs in cancer. Clin Pharmacol Ther. 2013; 93:98–104.
13. Li P, Xu Q, Zhang D, Li X, Han L, Lei J, Duan W, Ma Q, Wu Z, Wang Z. Upregulated miR-106a plays an oncogenic role in pancreatic cancer. FEBS Lett. 2014; 588:705–712.
14. Cui L, Zhang X, Ye G, Zheng T, Song H, Deng H, Xiao B, Xia T, Yu X, Le Y, Guo J. Gastric juice MicroRNAs as potential biomarkers for the screening of gastric cancer. Cancer. 2013; 119:1618–1626.
15. Zhu M, Zhang N, He S, Lui Y, Lu G, Zhao L. MicroRNA-106a targets TIMP2 to regulate invasion and metastasis of gastric cancer. FEBS Lett. 2014; 588:600–607.
16. Kim BH, Hong SW, Kim A, Choi SH, Yoon SO. Prognostic implications for high expression of oncogenic microRNAs in advanced gastric carcinoma. J Surg Oncol. 2013; 107:505–510.
17. Kim YK, Yu J, Han TS, Park SY, Namkoong B, Kim DH, Hur K, Yoo MW, Lee HJ, Yang HK, Kim VN. Functional links between clustered microRNAs: suppression of cell-cycle inhibitors by microRNA clusters in gastric cancer. Nucleic Acids Res. 2009; 37:1672–1681.
18. Guo J, Miao Y, Xiao B, Huan R, Jiang Z, Meng D, Wang Y. Differential expression of microRNA species in human gastric cancer versus non-tumorous tissues. J Gastroenterol Hepatol. 2009; 24:652–657.
19. Fassan M, Pizzi M, Realdon S, Balistreri M, Guzzardo V, Zagonel V, Castoro C, Mastracci L, Farinati F, Nitti D, Zaninotto G, Rugge M. The HER2-miR125a5p/miR125b loop in gastric and esophageal carcinogenesis. Hum Pathol. 2013; 44:1804–1810.
20. Guo LH, Li H, Wang F, Yu J, He JS. The Tumor Suppressor Roles of miR-433 and miR-127 in Gastric Cancer. Int J Mol Sci. 2013; 14:14171–14184.
21. Qiu T, Zhou X, Wang J, Du Y, Xu J, Huang Z, Zhu W, Shu Y, Liu P. MiR-145, miR-133a and miR-133b inhibit proliferation, migration, invasion and cell cycle progression via targeting transcription factor Sp1 in gastric cancer. FEBS Lett. 2014; 588:1168–1177.
22. Johnson GL, Lapadat R. Mitogen-activated protein kinase pathways mediated by ERK, JNK, and p38 protein kinases. Science. 2002; 298:1911–1912.
23. Zhang Z, Miao L, Xin X, Zhang J, Yang S, Miao M, Kong X, Jiao B. Underexpressed CNDP2 participates in gastric cancer growth inhibition through activating the MAPK signaling pathway. Mol Med. 2014; 20:17–28.
24. Liang B, Wang S, Zhu XG, Yu YX, Cui ZR, Yu YZ. Increased expression of mitogen-activated protein kinase and its upstream regulating signal in human gastric cancer. World J Gastroenterol. 2005; 11:623–628.
25. Jia HY, Wang YX, Yan WT, Li HY, Tian YZ, Wang SM, Zhao HL. MicroRNA-125b Functions as a Tumor Suppressor in Hepatocellular Carcinoma Cells. Int J Mol Sci. 2012; 13:8762–8774.
26. Bloomston M, Frankel WL, Petrocca F, Volinia S, Alder H, Hagan JP, Liu CG, Bhatt D, Taccioli C, Croce CM. MicroRNA expression patterns to differentiate pancreatic adenocarcinoma from normal pancreas and chronic pancreatitis. JAMA. 2007; 297:1901–1908.
27. Shi XB, Xue L, Yang J, Ma AH, Zhao J, Xu M, Tepper CG, Evans CP, Kung HJ, deVere White RW. An androgen-regulated miRNA suppresses Bak1 expression and induces androgen-independent growth of prostate cancer cells. Proc Natl Acad Sci U S A. 2007; 104:19983–19988.
28. Bousquet M, Quelen C, Rosati R, Mansat-De Mas V, La Starza R, Bastard C, Lippert E, Talmant P, Lafage-Pochitaloff M, Leroux D, Gervais C, Viguie F, Lai JL, Terre C, Beverlo B, Sambani C, et al. Myeloid cell differentiation arrest by miRNA-125b-1 in myelodysplastic syndrome and acute myeloid leukemia with the t(2,11)(p21;q23) translocation. J Exp Med. 2008; 205:2499–2506.
29. Wu JG, Wang JJ, Jiang X, Lan JP, He XJ, Wang HJ, Ma YY, Xia YJ, Ru GQ, Ma J, Zhao ZS, Zhou R. MiRNA-125b promotes cell migration and invasion by targeting PPP1CA-Rb signal pathways in gastric cancer, resulting in a poor prognosis. Gastric Cancer. 2015; 18:729–739.
30. Huang K, Dong S, Li W, Xie Z. The expression and regulation of microRNA-125b in cancers. Acta Biochim Biophys Sin (Shanghai). 2013; 45:803–805.
31. Vriens MR, Weng J, Suh I, Huynh N, Guerrero MA, Shen WT, Duh QY, Clark OH, Kebebew E. MicroRNA expression profiling is a potential diagnostic tool for thyroid cancer. Cancer. 2012; 118:3426–3432.
32. Pallante P, Visone R, Ferracin M, Ferraro A, Berlingieri MT, Troncone G, Chiappetta G, Liu CG, Santoro M, Negrini M, Croce CM, Fusco A. MicroRNA deregulation in human thyroid papillary carcinomas. Endocr Relat Cancer. 2006; 13:497–508.
33. Wu N, Lin X, Zhao X, Zheng L, Xiao L, Liu J, Ge L, Cao S. MiRNA-125b acts as an oncogene in glioblastoma cells and inhibits cell apoptosis through p53 and p38MAPK-independent pathways. Br J Cancer. 2013; 109:2853–2863.
34. Jin Z, Selaru FM, Cheng Y, Kan T, Agarwal R, Mori Y, Olaru AV, Yang J, David S, Hamilton JP, Abraham JM, Harmon J, Duncan M, Montgomery EA, Meltzer SJ. MicroRNA-192 and -215 are upregulated in human gastric cancer in vivo and suppress ALCAM expression in vitro. Oncogene. 2011; 30:1577–1585.
35. Sam LT, Mendonca EA, Li J, Blake J, Friedman C, Lussier YA. PhenoGO: an integrated resource for the multiscale mining of clinical and biological data. BMC Bioinformatics. 2009; 10:S8.
36. Dweep H, Sticht C, Pandey P, Gretz N. miRWalk—database: prediction of possible miRNA binding sites by “walking” the genes of three genomes. J Biomed Inform. 2011; 44:839–847.