
Introduction
Colorectal cancer (CRC) is the third most prevalent cancer type in the world [1] and fourth leading cause of cancer related deaths [2]. Stage II and III tumors together represent approximately 70% of CRC patients [3]. Although multidisciplinary therapy successfully induce clinical remission in approximately 60% of stage II and III cases, 40-50 % of patients will relapse, and most of them will die from secondary diseases [3, 4]. One third of CRC patients without histological evidence of lymph node involvement die within five years after surgery from distant metastasis or local recurrence [5], suggesting that pathological stage alone may not predict the clinical course of CRC adequately. Therefore, it is necessary to explore the novel molecular markers for identifying aggressive phenotypes within stage II and III CRC.
ANO9 (anoctamin 9), also known as TMEM16J, is located in chromosome 11 band p15. It is a member of the TMEM16 family, which plays key roles in a variety of physiological functions that range from ion transport to phospholipid scrambling and to regulation of other ion channels. Although the first two family members, ANO1 and ANO2, were functionally characterized, which are involved in transepithelial ion transport, olfaction, phototransduction, smooth muscle contraction, nociception, cell proliferation and control of neuronal excitability, until now, the role of ANO9 remains poorly understood and controversial [6].
The aim of the present study was to investigate the role and oncogenic mechanisms of ANO9 in human CRC progression. Furthermore, the clinical significance of ANO9 was also addressed in this study.
Results
Differential expression of ANO9 in CRC samples and cell lines
Relative quantities of ANO9 mRNA in CRC cell lines were expressed as N-fold difference in relation to LoVo and normalized to the GAPDH as a reference gene. The ANO9 mRNA expression in SW480, HCT116, and Caco-2 were increased 2.7-, 1.8- and 1.1-fold, respectively, compared with that of LoVo. Whereas ANO9 mRNA levels of SW620 and Colo205 were decreased 0.6- and 0.1-fold, respectively. To provide visualized evidence for ANO9 mRNA expression, RT-PCR was also used and the same results were obtained (Figure 1A). In 64 fresh samples, ANO9 mRNA expression was significantly lower in recurrent CRC tissues than in those without recurrence (P = 0.006; Figure 1B). Moreover, random CRC samples were also selected for Western blotting, and the same results were obtained (Figure 1C).
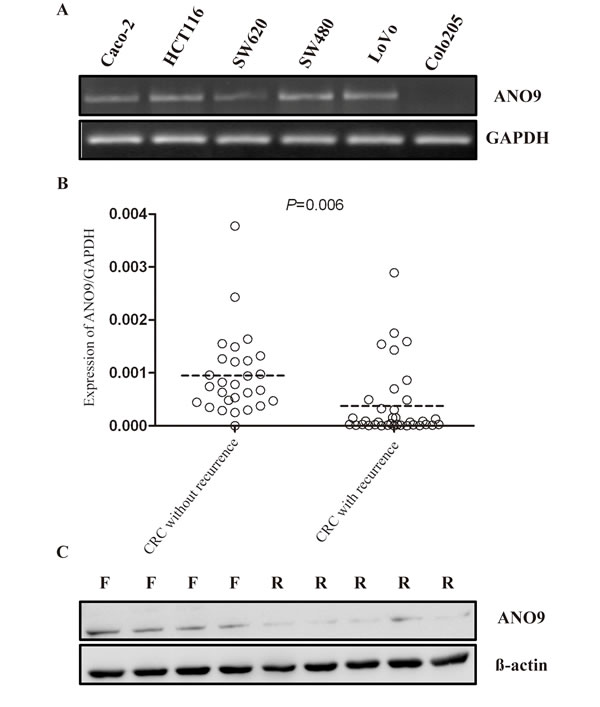
Figure 1: A. ANO9 expression in 6 CRC cell lines was detected by RT-PCR. GAPDH was amplified as an internal control. B. In recurrent CRC, ANO9 mRNA levels were significantly decreased compared to the CRC without recurrence (Wilcoxon Signed Ranks Test, P < 0.05). C. Western blots analysis of ANO9 protein expression in CRC tissues. R indicates recurrence samples; F, samples free of recurrence.
By use of a tissue microarray (75 cores) we investigated the protein expression of ANO9 in primary and metastatic cancer specimens and their matched nontumor counterparts. The tumorous or non-tumorous mucosa-specific staining was semi-quantitatively scored by the intensity and the percentage of positive staining. As shown in Figure 2, ANO9 protein expression was detected mainly in cytoplasm of cells. Analysis of ANO9 protein level in the 61 CRC tissues (28 primary tissues and 33 metastatic tissues) revealed that 25% (15/61) of samples demonstrating strong (2+ and 3+) intensities and 75% (46/61) low (- and 1+) intensities. The positive expression of ANO9 in surrounding nontumor tissues was significantly higher than that in tumorous tissue (P < 0.001).
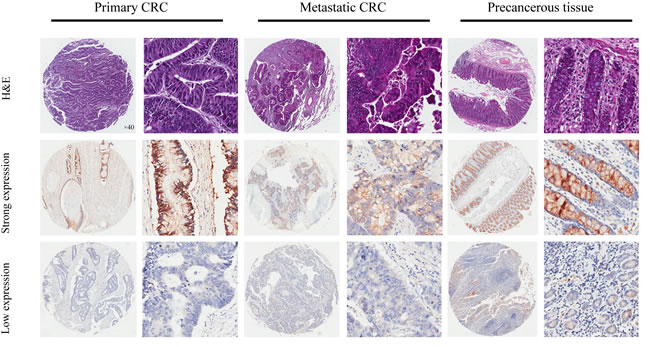
Figure 2: Representatives of ANO9 expression in consecutive TMA slides consisting of 75 non-tumor, primary, and metastatic CRC tissues detected by immunohistochemistry (magnification×40 or 400). In most cases, ANO9 expression was often stronger in the cytoplasm of primary CRC cells compared with metastatic cancer cells. And adjacent non-cancer tissue is detected with stronger ANO9 expression compared with both type of cancer tissues.
ANO9 decreased cell growth, inhibited cell cycle, and promoted cell apoptosis
To characterize the role of ANO9 in CRC development, the full-length cDNA of the gene was cloned into expressing vector pCDNA3.1 and stably transfected into human CRC cell line HCT116, Caco-2 and LoVo cells. The expression level of ANO9 in transfected cells was determined by Western blotting (Figure S1). While the empty-vector-transfected cells grew into large clones, the ANO9-transfected cells grew slowly (Figure 3A). CCK-8 assay demonstrated that ANO9 inhibited cell proliferation compared with vector-transfected cells (P < 0.05) (Figure 3B). Cell cycle analysis showed that ANO9 over-expression caused a significant accumulation of cells in the G0-G1 phase, with a concomitant decrease of cells in the G2-S phase compared with empty-vector-transfected cells (P < 0.05) (Figure 3C). Moreover, it also revealed that ANO9 over-expression promoted cell apoptosis using PI staining to label apoptotic cells in 3 CRC cell lines (Figure 3D).
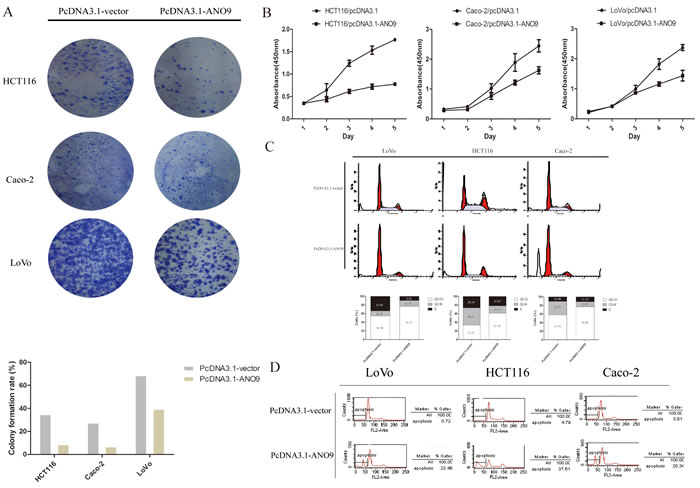
Figure 3: A. Less and smaller clones were formed in ANO9-transfected cells by crystal violet staining compared with empty-vector-transfected cells. B. CCK-8 assay detected the growth condition of ANO9-transfected cells and empty-vector-transfected cells. Points, means of three separate experiments. Bars, standard deviation (SD) (P < 0.05). C. ANO9 over-expression caused a significant accumulation of cells in the G0-G1 phase and a marked decrease in the G2-S phase compared with empty-vector-transfected cells (P < 0.05) by flow cytometry. D. ANO9 over-expression promoted cell apoptosis using PI staining to label apoptotic cells.
ANO9 decreased cell invasion
Matrigel-transwell assay was used to determine the effect of ANO9 on cell invasion. PcDNA3.1-vector cells showed about 3.61±0.37-fold and 1.64±0.19-fold penetration rate through the matrigel-coated membrane compared with PcDNA3.1-ANO9 in LoVo and HCT116 cells, respectively (Figure 4), which indicated that ANO9 reduced the invasion ability of tumor cells.
To confirm the above results, we also tested the effect of ANO9 knockdown in a CRC cell line, SW480. We first confirmed the knockdown effect on the expression of ANO9 in this cell line (see Supplementary Material, Figure S2A). As expected, ANO9 knockdown increased cell growth, colony formation, and cell invasion in SW480 cells (see Supplementary Material, Figure S2).
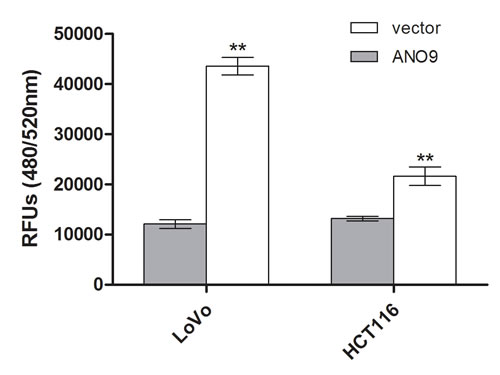
Figure 4: Cell invasion was measured using a QCMTM 24-well cell invasion kit. Each experiment was repeated three times, and data represent the mean±SD of three determinations.
Correlation between ANO9 expression and clinicopathological features
ANO9 mRNA expression was significantly associated with cancer recurrence and TNM stage (Table 1). Table 2 showed the relationships between clinicopathological features and ANO9 protein expression in samples. No significant age, sex, size, lymphvascular and perineural invasion differences were observed. However, ANO9 expression was significantly associated with carcinogenesis (P < 0.001).
Univariate analysis by Kaplan-Meier plots revealed that high ANO9 expression was significantly associated with favorable disease-free survival results (P < 0.001). Kaplan-Meier curves demonstrate survival distributions were significantly different in CRC regarding to perineural or lymphovascular invasion and TNM stage (P < 0.05). Characteristic plots of ANO9 expression is shown in Figure 5A. Moreover, we also analyzed mRNA expression data of genes in a dataset of 566 samples using the R2 bioinformatic platform (http://r2.amc.nl). It is possible to view the differential expression of genes in a user-defined panel of dataset. We selected the GEO ID: GSE39582 dataset, which aimed to build up a robust molecular classification of mRNA expression profiles (Affymetrix U133Plus2) of a large series of 443 colon cancer. Kaplan-Meier plots revealed that overexpression of ANO9 expression was significantly associated with favorable relapse-free survival results (P = 0.013, Figure 5B). Multivariate Cox analysis indicated that ANO9 expression, TNM stage, and lymphovascular invasion were independent variables for prognosis of stage II and III CRC patients (P = 0.007, 0.001, and 0.003) (Table 3).
Table 1: Relationships between clinicopathological features and ANO9 mRNA expression in colorectal cancer
Variables |
N |
ANO9 expression |
Pa value |
|
High (n=37) |
Low (n=27) |
|||
Age |
0.223 |
|||
<80 |
57 |
31 |
26 |
|
≥80 |
7 |
6 |
1 |
|
Sex |
1 |
|||
Male |
40 |
23 |
17 |
|
Female |
24 |
14 |
10 |
|
Size |
0.314 |
|||
≤5cm |
35 |
18 |
17 |
|
>5cm |
29 |
19 |
10 |
|
Grading |
0.460 |
|||
Well |
15 |
9 |
6 |
|
Moderate |
39 |
24 |
15 |
|
Poor |
10 |
4 |
6 |
|
Type |
0.233 |
|||
Non-mucin-producing cancer |
50 |
31 |
19 |
|
Mucin-producing cancer |
14 |
6 |
8 |
|
Location of tumor |
0.429 |
|||
Colon |
22 |
11 |
11 |
|
Rectum |
42 |
26 |
16 |
|
Recurrence |
<0.001* |
|||
Yes |
34 |
9 |
27 |
|
No |
30 |
28 |
0 |
|
TNM stage |
0.010* |
|||
II |
27 |
21 |
6 |
|
III |
37 |
16 |
21 |
|
Lymphovascular invasion |
0.576 |
|||
Yes |
17 |
11 |
6 |
|
No |
47 |
26 |
21 |
|
Perineural invasion |
0.072 |
|||
Yes |
14 |
5 |
9 |
|
No |
50 |
32 |
18 |
|
a P value are obtained from χ2 test
*Statistically significant, P<0.05
Table 2: Relationships between clinicopathological features and ANO9 protein expression in colorectal cancer
Variables |
N |
ANO9 expression |
Pa value |
|
Strong |
Low |
|||
Sex |
1 |
|||
Male |
21 |
3 |
18 |
|
Female |
7 |
1 |
6 |
|
Age |
0.133 |
|||
≥65 |
6 |
2 |
4 |
|
<65 |
22 |
2 |
20 |
|
Location |
0.527 |
|||
Rectum |
11 |
1 |
10 |
|
Colon |
17 |
3 |
14 |
|
Histologic type |
0.549 |
|||
Non-mucin-producing cancer |
26 |
4 |
22 |
|
Mucin-producing cancer |
2 |
0 |
2 |
|
Histologic grading |
0.212 |
|||
Low,moderate-grade |
21 |
2 |
19 |
|
High-grade |
7 |
2 |
5 |
|
Tumor size |
0.687 |
|||
>5 cm |
5 |
1 |
4 |
|
≤5 cm |
23 |
3 |
20 |
|
Lymphovascular invasion |
0.318 |
|||
Yes |
3 |
1 |
2 |
|
No |
25 |
3 |
22 |
|
Perineural invasion |
0.678 |
|||
Yes |
1 |
0 |
1 |
|
No |
27 |
4 |
23 |
|
TNM stage |
0.212 |
|||
II |
7 |
2 |
5 |
|
III |
21 |
2 |
19 |
|
Type of Cancer |
0.085 |
|||
Primary |
28 |
4 |
24 |
|
Metastatic |
33 |
11 |
22 |
|
Type of tissues |
<0.001* |
|||
Non-tumorous tissue |
14 |
12 |
2 |
|
Tumorous tissue |
61 |
15 |
46 |
|
a P value are obtained from χ2 test
*Statistically significant, P<0.05
Table 3: Uni- and multivariate analysis of survival in CRC
Factors |
HR (95% CI) |
P value* |
Univariate analysis |
||
Sex |
0.793(0.388-1.620) |
0.524 |
Age |
0.167(0.023-1.219) |
0.078 |
Tumor location |
1.021(0.514-2.027) |
0.954 |
Tumor size |
0.515(0.255-1.036) |
0.063 |
TNM stage |
7.479(3.063-18.266) |
0.000* |
Histologic type |
0.635(0.297-1.356) |
0.241 |
Lymphovascular invasion |
2.805(1.386-5.677) |
0.004* |
Perineural invasion |
4.374(2.175-8.795) |
0.000* |
ANO9 expression |
0.131(0.058-0.292) |
0.000* |
Multivariate analysis |
||
ANO9 expression |
0.097(0.033-0.292) |
0.001* |
TNM stage |
9.380(2.857-30.794) |
0.003* |
Lymphovascular invasion |
12.366(3.815-40.077) |
0.007* |
HR, hazard ratio; CI, confidence interval
*Statistically significant, P<0.05
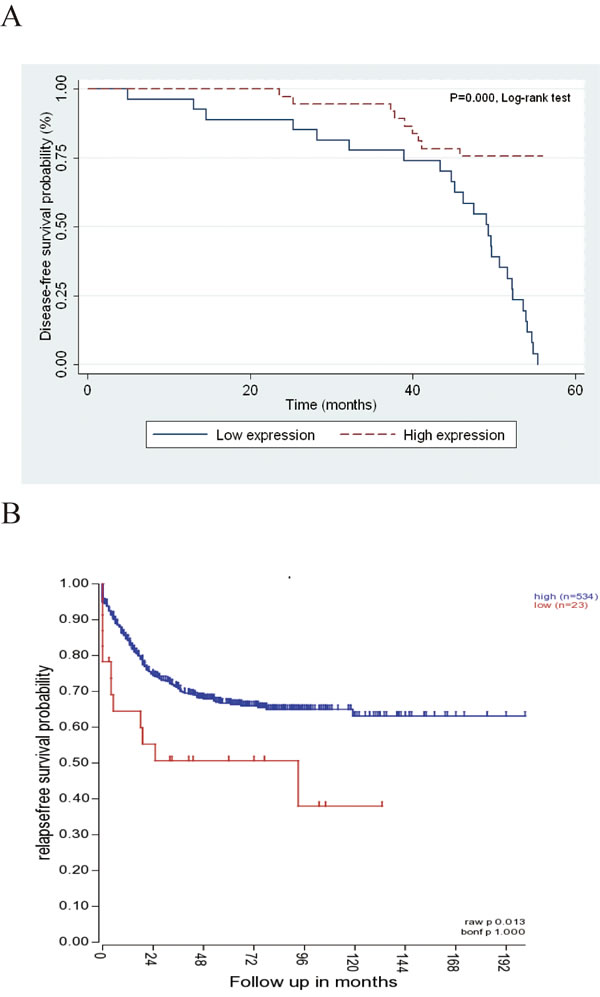
Figure 5: A. Patients with low ANO9 expression (n = 37) showed a significantly poorer prognisis than those with high ANO9 expression (n = 27; P ﹤ 0.05; log-rank test). B. Patients with low ANO9 expression (n = 534) showed a significantly poorer prognosis than those with strong expression (n = 23) based on R2 applications.
Discussion
Our study characterizes the role of ANO9 in human CRC. The ANO9 expression in recurrent CRC tissues was found significantly lower than in those without recurrence. And the proportion of strong ANO9 protein expressers in non-tumorous tissue was significantly higher than that in tumorous tissue (P < 0.05). Furthermore, we investigated the oncogenic mechanisms of ANO9 in human CRC cell lines, and found that it promotes cell proliferation and tumor invasion in vitro. Moreover, survival analysis demonstrated that ANO9 expression was associated with disease/relapse-free survival time, which confirmed its role in progression of CRC. Multivariate survival analysis showed that strong ANO9 expression was an independent protection factor.
Although the role of several TMEM16 family members is relatively clear, ANO9 remain poorly understood. Overexpression of ANO9 was involved in Ca2+-dependent lipid scrambling [11]. On the other hand, it was shown that ANO9 mediates Ca2+-dependent currents [12]. Schreiber et al. found that ANO9 reduced both basal and ATP-induced anion conductance, and inhibited the activity of ANO1 [13]. As known to us, ANO1 mediates cell proliferation, signal transduction and tumorigenesis [14-22]. Especially, it induces MAPK and contributes directly to cancer progression [15], whereas ANO9 could inhibit the activity of ANO1 and other anoctamins [13], which implied that ANO9 might inhibit malignant progression. In this study, we found that low expressers of ANO9 exhibited a higher recurrence trend, with a nearly 10-fold higher risk of metastases (HR,10.31; P < 0.05). Although the exact function of ANO9 is still unclear, on the basis of present work, ANO9 plays a tumor-suppressor role in stage II and III CRC by inhibiting cell cycle, reducing proliferation, promoting apoptosis and decreasing cancer cell invasion.
In view of the comprehensive data presented in this study, we propose that low-expression of ANO9 indicates poor prognosis in stage II and II CRC patients (Figure 1), which contributes to identifying subsets of patients with aggressive tumors. The role of adjuvant chemotherapy in those patients with stage II tumors is still unclear [23, 24]. To maximize the benefits of adjuvant therapy, an independent prognostic marker could be helpful in identifying aggressive phenotypes within stage II CRC. To our knowledge, it is the first time to explore the role of ANO9 in tumors, which might help to identify a subset of patients at high-risk of recurrence and these patients may therefore benefit from more aggressive treatment.
Taken together, in this study we showed that reduction of ANO9 has an important role in the tumorigenesis and cancer progression of stage II and III CRC. Better understanding of the pathophysiological functions of ANO9 may lead to a much more effective management of CRC via precise prognostication and molecularly targeted treatment.
Materials and Methods
CRC samples and cell lines
From April 2000 to November 2004, 64 fresh CRC tissues, 36 with recurrence and 28 without recurrence, were collected immediately after operation at the Fudan University Shanghai Cancer Center (Shanghai, China). For immunohistochemical analysis, we selected 28 patients with CRC who underwent surgery at hospitals that cooperated with Shanghai Outdo Biotech Co., Ltd. during 2005-2007. Clinicopathaological characteristics of the research subjects are shown in Table 1 and 2. Patients were only included in this study if they had provided written consent to participate in the study after receiving written information regarding its course and purpose. Approval for the study was received from the Ethics Committee of the host institution.
Human CRC cell lines SW480, SW620, LoVo, Colo205, HCT116 and Caco-2 were obtained from American Type Culture collection (ATCC, Manassas, VA). The method of cell culture was described previously [7].
mRNA analysis by qPCR
Total RNA was isolated with an RNeasy Mini Kit (Qiagen GmbH, Hilden, Germany) and treated with Dnase. According to the manufacturer’s instructions, cDNAs were synthesized with Oligo-dT primers (Promega, Madison, WI). The ANO9-specific primers used were 5’-AGGACTTCCAGGACCCTGAT-3’ (forword) and 5’-CACGTGCTCAAAGAGGATGA-3’ (reverse). Glyceraldehyde-3-phosphate dehydrogenase (GAPDH) served as a control for normalization of gene expression and was amplified using primers 5’-GAAGGTGAAGGTCGGAGTC-3’ (forward) and 5’-GAAGATGGTGATGGGATTTC-3’ (reverse). The method of qPCR was described previously [8].
Western blotting
The cells were lysed in lysis buffer (PBS containing 1% Triton X-100, protease inhibitor cocktail, and 1 mmol/L phenylmethylsulfonylfluoride) at 4℃ for 30 minutes. Equal quantities of protein were subjected to SDS-PAGE. After transfer to Immobilon-P transfer membrane, successive incubations with anti-ANO9 and anti-ß-actin, and horseradish peroxidase-conjugated secondary antibody were carried out. The immunoreactive proteins were then detected using the ECL system. Bands were scanned using a densitometer (GS-700; Bio-Rad).
Tissue microarray (TMAs) construction and Immunohistochemistry
The colonic tissue microarray was constructed by Shanghai Biochip Co, Ltd, as described previously [9]. Immunohistochemical staining was performed using two-step method. The sections were deparaffinized and rehydrated. Antigen retrieval was performed by autoclaving the slides in 10 mM citric acid buffer. A polyclonal rabbit antihuman ANO9 antibody (dilution 1:500) was obtained from Abcam (Cambridge, UK).
Cytoplasm staining was measured for this antibody. Positive cells were counted by 2 pathologists who were blind to clinical outcome. For clinicopathological correlation, we used a 4-tiered scoring system (negative to 3+), which took into account the percentage of positive cells and staining intensity as described previously [7]. The detailed approach was used to generate a score for each tissue core as follows: no staining or staining < 10% of tumour cells (score 0), faint/barely perceptible partial staining > 10% of tumour cells (score 1+), weak-to-moderate staining > 10% of tumour cells (score 2+), and strong staining > 10% of tumour cells (score 3+). We separately interpreted ANO9 - and 1+ as ‘low expression’ and 2+ and 3+ as ‘strong expression’.
Plasmid constructs and transfection
ANO9 was polymerase chain reaction (PCR) amplified and cloned into expression vector pcDNA3.1(+) (Invitrogen, Carlsbad, CA) and stable ANO9-expressing clones in CRC cells were selected for further experiments.
Colony forming assay
For clonogenic assay, 1×10³ cells were seeded into 6-well tissue culture plates and left to form clones over a period. Cultures were stained with 0.1 % crystal violet, and the number of clones in a 2×2 cm grid (on the culture plates) was scored to determine the clone-forming ability of the cells. Clones containing over 50 cells were counted. Each result was performed in triplicate.
Cell growth assay
Cell growth was analyzed using a WST-8 Cell Counting Kit-8 (Dojindo, Kumamoto, Japan). Cells (2×10³) suspended in RPMI1640 medium (100μl) containing 10% fetal bovine serum were seeded in 96-well plates and incubated. CCK-8 solution (10μl) was added to each well and the cultures were incubated at 37℃ for 90 min. Absorbance at 450 nm was measured using an immunoreader. The results were plotted as means ± SD of three separate experiments having five determinations per experiment for each experimental condition.
Cell cycle analysis
Cell cycle distribution was analyzed by flow cytometry. Cells were trypsinized, rinsed with PBS, fixed with 70% ethanol at 4℃ overnight, and treated with RNaseA (0.02 mg/ml) in the dark at room temperature for 30 min. Cells were resuspended in 0.05 mg/ml propidium iodide and analyzed with flow cytometry (Becton Dickinson). The results were analyzed using software (FCSExpress 4 Flow Research Edition) to determine the distribution of different cell cycle phases.
Apoptosis assay by flow cytometry
Cells were collected and washed with ice cold PBS twice, and resuspended at a density of 1×10⁶ cells/mL in ice cold PBS. One milliliter was transferred into a new tube and 5 μL of 50 μg/mL PI staining solution was added. The tubes were gently mixed and incubated for 15 min at RT in dark conditions. The samples were then analyzed using flow cytometry within 1 h. Unstained cells were used as negative control.
Cell invasion assay
The cell invasion assay was performed with QCM 24-well Invasion Assay kit (Chemicon International). This cell invasion assay was performed in an invasion chamber, based on the Boyden chamber principle. This kit contains 24 inserts and each insert contains an 8-μm pore size polycarbonate membrane coated with a thin layer of ECM. The method was described previously [10].
RNAi
Oligonucleotides containing siRNA sequences of the target genes were designed, and named siANO9-1, siANO9-2 and sicontrol (see Supplementary Material, Table S1). The annealed oligos were cloned into the pSUPER.retro vector (Oligoengine, Boston, MA, USA) and sequenced. The recombinant pSUPER-sh-RNA vectors were transfected into CRC cells with LipofectamineTM 2000 transfection reagent (Invitrogen). Stable clones were selected with 1.0 μg/ml puromycin (Sigma-Aldrich) for 7 days.
Statistical analysis
Statistical analyses were conducted with Stata (version SE/10; StataCorp, College Station, TX). The association among categorical data was analyzed by using the χ2 test. Survival curves were generated by the Kaplan-Meier method, and univariate survival distributions were compared with the use of the log-rank test. The multivariate Cox proportional hazards model was used for detection of independent prognosticator. The 2-tailed P value for significance was established at 0.05.
Acknowledgments and Funding
This study was supported by Postdoctoral Science Foundation of Heilongjiang Province (LRB87859), Medical Scientific Research Foundation of Heilongjiang Province (2011-144), The Opening Project of Key Laboratory of Medical Genetics of Heilongjiang Higher Education Institutions and Natural Science Foundation of Heilongjiang Province (H201332)
ConflictS of Interests
The authors declare that they have no conflict of interest.
References
1. Shike M, Winawer SJ, Greenwald PH, Bloch A, Hill MJ and Swaroop SV. Primary prevention of colorectal cancer. The WHO Collaborating Centre for the Prevention of Colorectal Cancer. Bull World Health Organ. 1990; 68:377-385.
2.Haggar FA and Boushey RP. Colorectal cancer epidemiology: incidence, mortality, survival, and risk factors. Clin Colon Rectal Surg. 2009; 22:191-197.
3. Cserni G. Nodal staging of colorectal carcinomas and sentinel nodes. J Clin Pathol. 2003; 56:327-335.
4. Gramont A. Adjuvant therapy of stage II and III colon cancer. Semin Oncol. 2005; 32:11-14.
5. Chatla C, Jhala NC, Katkoori VR, Alexander D, Meleth S, Grizzle WE and Manne U. Recurrence and survival predictive value of phenotypic expression of Bcl-2 varies with tumor stage of colorectal adenocarcinoma. Cancer Biomark.. 2005; 1:241-250.
6. Picollo A, Malvezzi M and Accardi A. TMEM16 proteins: unknown structure and confusing functions. J Mol Biol. 2015; 427:94-105.
7. Li C, Cai S, Wang X and Jiang Z. Hypomethylation-associated up-regulation of TCF3 expression and recurrence in stage II and III colorectal cancer. Plos One. 2014; 9:e112005.
8. Jiang Z, Xu Y and Cai S. Down-regulated GAS1 expression correlates with recurrence in stage II and III colorectal cancer. Hum Pathol. 2011; 42:361-368.
9. Kallioniemi OP, Wagner U, Kononen J and Sauter G. Tissue microarray technology for high-throughput molecular profiling of cancer. Hum Mol Genet. 2001; 10:657-662.
10. Xu L and Deng X. Protein kinase Ciota promotes nicotine-induced migration and invasion of cancer cells via phosphorylation of micro- and m-calpains. J Biol Chem. 2006; 281:4457-4466.
11. Suzuki J, Fujii T, Imao T, Ishihara K, Kuba H and Nagata S. Calcium-dependent phospholipid scramblase activity of TMEM16 protein family members. J Biol Chem. 2013; 288:13305-13316.
12. Tian Y, Schreiber R and Kunzelmann K. Anoctamins are a family of Ca2+-activated Cl- channels. J Cell Sci. 2012; 125:4991-4998.
13. Schreiber R, Uliyakina I, Kongsuphol P, Warth R, Mirza M, Martins JR and Kunzelmann K. Expression and function of epithelial anoctamins. J Biol Chem. 2010; 285:7838-7845.
14. Manoury B, Tamuleviciute A and Tammaro P. TMEM16A/anoctamin 1 protein mediates calcium-activated chloride currents in pulmonary arterial smooth muscle cells. J Physiol. 2010; 588:2305-2314.
15. Duvvuri U, Shiwarski DJ, Xiao D, Bertrand C, Huang X, Edinger RS, Rock JR, Harfe BD, Henson BJ, Kunzelmann K, Schreiber R, Seethala RS, Egloff AM, Chen X, Lui VW and Grandis JR, et al. TMEM16A induces MAPK and contributes directly to tumorigenesis and cancer progression. Cancer Res. 2012; 72:3270-3281.
16. Huang WC, Xiao S, Huang F, Harfe BD, Jan YN and Jan LY. Calcium-activated chloride channels (CaCCs) regulate action potential and synaptic response in hippocampal neurons. Neuron. 2012; 74:179-192.
17. Huang F, Zhang H, Wu M, Yang H, Kudo M, Peters CJ, Woodruff PG, Solberg OD, Donne ML, Huang X, Sheppard D, Fahy JV, Wolters PJ, Hogan BL, Finkbeiner WE and Li M, et al. Calcium-activated chloride channel TMEM16A modulates mucin secretion and airway smooth muscle contraction. Proc Natl Acad Sci U S A. 2012; 109:16354-16359.
18. Cho H, Yang YD, Lee J, Lee B, Kim T, Jang Y, Back SK, Na HS, Harfe BD, Wang F, Raouf R, Wood JN and Oh U. The calcium-activated chloride channel anoctamin 1 acts as a heat sensor in nociceptive neurons. Nat Neurosci. 2012; 15:1015-1021.
19. Mazzone A, Eisenman ST, Strege PR, Yao Z, Ordog T, Gibbons SJ and Farrugia G. Inhibition of cell proliferation by a selective inhibitor of the Ca(2+)-activated Cl(-) channel, Ano1. Biochem Biophys Res Commun. 2012; 427:248-253.
20. Wong XM, Younger S, Peters CJ, Jan YN and Jan LY. Subdued, a TMEM16 family Ca(2)(+)-activated Cl(-)channel in Drosophila melanogaster with an unexpected role in host defense. Elife. 2013; 2:e862.
21. Lee B, Cho H, Jung J, Yang YD, Yang DJ and Oh U. Anoctamin 1 contributes to inflammatory and nerve-injury induced hypersensitivity. Mol Pain. 2014; 10:5.
22. Wanitchakool P, Wolf L, Koehl GE, Sirianant L, Schreiber R, Kulkarni S, Duvvuri U and Kunzelmann K. Role of anoctamins in cancer and apoptosis. Philos Trans R Soc Lond B Biol Sci. 2014; 369:20130096.
23. Trarbach T, Kubicka S, Hacker U, Ridwelski K and Reinacher-Schick A. [Adjuvant therapy of colon carcinoma]. Onkologie. 2008; 31 Suppl 5:19-23.
24. De Dosso S, Sessa C and Saletti P. Adjuvant therapy for colon cancer: present and perspectives. Cancer Treat Rev. 2009; 35:160-166.