
INTRODUCTION
Thyroid nodules are common in clinical practice. With widespread use of high-resolution ultrasound, incidental thyroid nodules are being detected in up to 67% of adult population [1]. Once a thyroid nodule is detected, it is important to exclude malignancy. Although Fine-needle Aspiration (FNA) is the diagnostic standard in evaluating thyroid nodule, about 15 to 30% yield indeterminate cytology findings and patients are referred for diagnostic thyroid surgery [1-5]. As the majority of nodules prove to be benign on final histology, it is imperative to improve preoperative diagnostic evaluation.
In our previous studies, we show that the expression of three genes (C1orf24, ITM1 and PVALB) help to distinguish a benign from a malignant thyroid nodule with high sensitivity, specificity, positive predictive value and negative predictive value [6-8]. Among these thyroid markers, C1orf24 (Chromosome 1 Open Reading Frame 24), also called FAM129A and NIBAN, was found to be one of the best predictors of cancer. C1orf24 was highly expressed in follicular thyroid carcinoma (FTC) and papillary thyroid carcinoma (PTC), while was not expressed in normal thyroid and in benign follicular thyroid adenoma (FTA) and hyperplasia [6, 7, 9].
C1orf24 was initially found as differentially expressed between two renal carcinoma cell lines, established from the same Tsc2 knockout (Eker) rat model of hereditary renal carcinoma [10]. Later, it was demonstrated that C1orf24 was expressed in early neoplastic lesion in Eker rats, while it was absent in normal rat kidney. Furthermore, C1orf24 was reported to be expressed in other hereditary renal carcinoma models such as Tsc2 and Tsc1 knockout mice. Likewise, the expression of C1orf24 was also found in sporadic human renal cell carcinomas, which have no loss of heterozigosity of the TSC2 gene [11]. As C1orf24 expression is commonly induced at early stages of renal carcinogenesis, independent of TSC2 status, the authors proposed C1orf24 as a new marker of renal carcinogenesis.
In 2006, the same group reported C1orf24 expression in most thyroid carcinomas, including papillary microcarcinoma, and in a small subset of thyroid benign lesions with oxyphilic (Hürthe) cells [12]. This study not only corroborates our findings but, importantly, describes that C1orf24 is upregulated from the early stages of papillary thyroid carcinogenesis and Hürthle tumors. Finally, C1orf24 was found expressed in early stages of head and neck squamous cell carcinomas (HNSCC) and remained upregulated through the carcinogenesis progression while normal counterparts were negative [13].
Although C1orf24 is described as highly expressed in several tumors subtypes, little is known about the molecular mechanism underlying its expression. Understanding how the expression of C1orf24 is regulated is central to comprehend its role in cancer.
MicroRNAs (miRNAs) are small endogenous noncoding RNA molecules that have been acknowledged as post-transcriptional regulators of gene expression. By binding to the 3’-untranslated region (UTR) of their mRNA targets, miRNAs can induce mRNA degradation or blockade of mRNA translation [14-17]. miRNAs have important roles in regulating a wide range of cellular processes such as development, cellular differentiation, proliferation, apoptosis and metabolism. Indeed, aberrant expression of miRNAs has been associated with genesis and progression of a wide variety of cancers, including thyroid [18-21].
In the present study we sought to investigate whether miRNAs could be involved in the post-transcriptional regulation of C1orf24 in thyroid cancer. We provide evidence that C1orf24 expression is directly regulated by miR-106b. Further functional studies demonstrated that both miR-106b and siRNA knockdown of C1orf24, in two thyroid carcinomas cell lines, inhibited cell migration and cell cycle progression while induced apoptosis.
RESULTS
In silico prediction of putative miRNAs targeting C1orf24
Using in silico analysis, we identified five highly conserved miRNAs (miR-106b, miR-17-5p, miR-20a-5p, miR-106a-5p and miR-20b-5p) that potentially target 3′-UTR of C1orf24 mRNA. miR-106b belongs to the miR-106b~25 cluster, which is located at 7q22.1. miR-17-5p and miR-20a-5p belong to the miR-17~92 cluster, which is located at 13q31.3. miR-106a-5p and miR-20b-5p are members of the miR-106a~363 cluster, which is located at Xq26.2. miRNAs were predicted by all three different target prediction programs (TargetScan, PicTar and miRanda). As miR-106a-5p and miR-20b-5p are located at X chromosome, and their variation could be due to sex-specific differential regulation of its expression, they were excluded from the analysis. Then, based on rank of prediction, one miR of each cluster was chosen for analysis. Therefore, miR-17-5p (P = -29.29 x 10⁴) and miR-106b (P = -25.10 x 10⁴) were chosen for further validation (Figure 1).
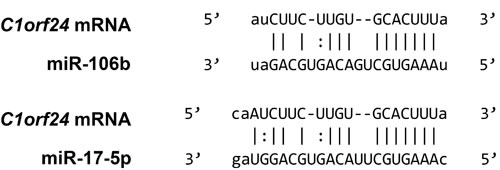
Figure 1: 3’-UTR of C1orf24 and predicted binding sites of miR-106b and miR-17-5p.
Increased expression of C1orf24 coincides with diminished expression of miR-106b in thyroid carcinomas
We previously reported that C1orf24 was overexpressed in thyroid carcinomas at both mRNA and protein levels [6, 8]. The expression of C1orf24 and selected miRNAs (miR-17-5p and miR-106b) were investigated by quantitative PCR (qPCR) in 48 thyroid samples. The expression of C1orf24 was increased in nearly all thyroid carcinomas, while its expression was absent in most benign FTAs (P = 0.0052). In contrast, the expression of miR-106b was observed as consistently down-regulated in most thyroid carcinomas compared to benign FTAs (P = 0.0137) (Figure 2, Supplementary Figure S1). These data suggest that an increased expression of C1orf24 upon malignant transformation coincides with a decreased expression of miR-106b, which may advocate an underlying association between these phenomena. The expression of miR-17-5p did not differ between FTAs and carcinomas.
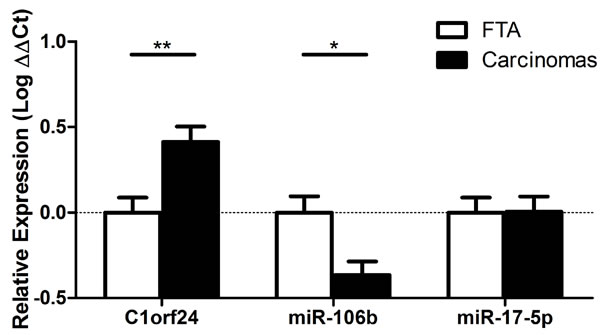
Figure 2: Expression of C1orf24 and selected miRNAs in follicular thyroid adenomas (FTA) and thyroid carcinomas. C1orf24 is overexpressed in thyroid carcinomas compared to FTAs (P = 0.0052). The expression of miR-106b is lower in thyroid carcinomas compared to FTAs (P = 0.0137). No difference was observed in miR-17-5p between FTAs and carcinomas. Data are presented as means ± SD (n = 48). P values represent statistical analysis using Mann-Whitney U test.
miR-106b is expressed at low levels in thyroid cancer cell lines while C1orf24 is expressed at high levels
We next determined the level of miR-106b expression in four follicular thyroid carcinoma cell lines (FTC 133, FTC 236, FTC 238, WRO) and one papillary thyroid carcinoma cell line (TPC1). qPCR analysis showed that miR-106b is expressed at very low levels in all cell lines (Figure 3A). We next investigated the C1orf24 expression in all thyroid carcinoma cell lines and in a rat normal thyroid cell line (PCCL3) at protein levels. C1orf24 is expressed at higher levels in WRO and TPC1 cell lines (Figure 3B). These data are consistent with that observed in thyroid carcinoma specimens, where the miR-106b data are inversely correlated to the expression of C1orf24. Considering all thyroid carcinoma cell lines had comparable miR-106b expression (Figure 3A) and that WRO and TPC1 cell lines showed the highest expression levels of C1orf24 (Figure 3B), these cell lines were chosen for further in vitro analysis.
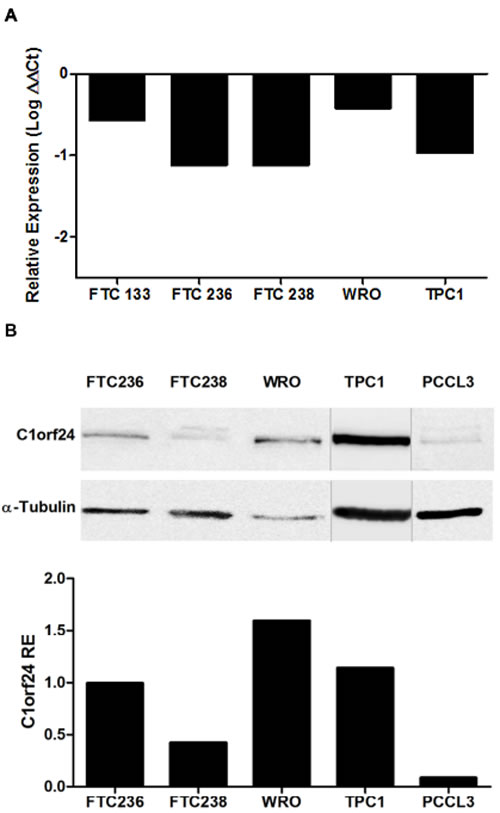
Figure 3: Endogenous expression of miR-106b and C1orf24 in thyroid carcinoma cell lines. A. Quantitative PCR analysis showed that miR-106b expression is very low in all human thyroid carcinoma cell lines. ΔΔCt was calculated using FTA samples as the control group. B. C1orf24 expression in thyroid carcinoma cell lines and in a rat normal thyroid cell (PCCL3) by Western blot. α-tubulin was used as a loading control. The band intensities were quantified and normalized to α-tubulin intensities and the results are graphically represented (bottom).
Ectopic expression of miR-106b in thyroid carcinoma cell lines inhibits C1orf24 expression
To test if the miR-106b suppresses C1orf24 expression, a small double-stranded RNA that mimics endogenous mature miR-106b was transfected into WRO and TPC1 cell lines. Cells were also transfected with a negative control, a random sequence which is not predicted to target any known gene. When the miR-106b expression was restored, abundance of C1orf24, at both transcript and protein levels, was reduced in WRO and TPC1 cell lines (Figure 4).
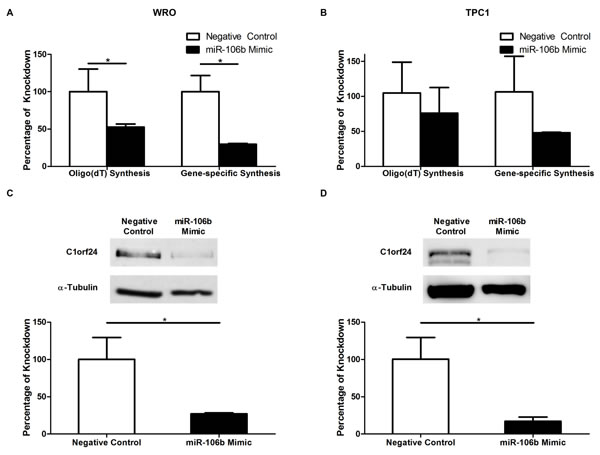
Figure 4: The effect of miR-106b on the expression of C1orf24. Thyroid carcinoma cell lines were transfected with miR-106b and negative control mimics. C1orf24 mRNA expression was measured in WRO (A) and TPC1 (B) cell lines by quantitative PCR using as template cDNA synthetized using oligo(dT)12-18 or C1orf24 specific primers. The expression of C1orf24 was lower after transfection with miR-106b mimic in both oligo(dT)12-18 (P = 0.0133) or primer specific (P = 0.028) analysis in WRO (A) and TPC1 (B) cell lines. C1orf24 protein levels were reduced in WRO (C) and TPC1 (D) transfected with miR-106b mimic (P = 0.0265 and P = 0.0486, respectively). The band intensities were quantified and normalized to α-tubulin and the results are graphically represented (bottom). Data are presented as means ± SD (n = 3), Mann-Whitney U Test.
C1orf24 is a direct target of miR-106b
As ectopic expression of miR-106b led to suppression of C1orf24, luciferase assay was performed to investigate in vitro interaction between the miR-106b and C1orf24 3’-UTR. As endogenous expression of C1orf24 is very low in a normal rat thyroid cell line (PCCL3), this cell line was chosen (Figure 3B). The miR-106b binding site in the C1orf24 3’-UTR was cloned downstream of Firefly Luciferase gene. Co-transfection of the miR-106b mimic with reporter construct led to a drastic reduction of the luciferase activity, compared to the co-transfection of miR-106b mimic and negative control (P = 0.004, Figure 5A, left graphic). To confirm the interaction of miR-106b and C1orf24 3’-UTR, a plasmid carrying a mutation in the putative miR-106b binding site was used (Figure 5B). When the reporter construct carrying C1orf24 3’-UTR lacking the miR106 site (mutated) was co-transfected with the miR-106b mimic, the luciferase activity was similar to that observed in the cells co-transfected with the reporter construct with negative control (Figure 5A, right graphic). These results support the hypothesis that miR-106b directly interacts to and negatively regulates C1orf24 expression by binding to its 3’-UTR mRNA.
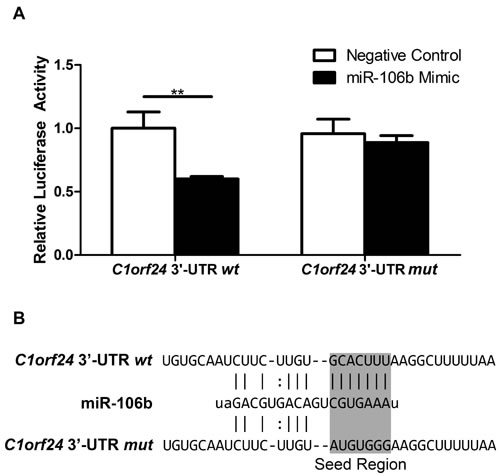
Figure 5: miR-106b negatively regulates C1orf24 in thyroid cell line. A. PCCL3 cells were co-transfected with pmirGLO wt or pmirGLO mut and miR-106b mimic or negative control. Luciferase activity was lower when vector carrying C1orf24 3’-UTR wt was co-transfected with miR-106b mimic, compared to the co-transfection of pmirGLO wt and negative control. When PCCL3 cells were co-transfected with vector carrying C1orf24 3’-UTR mut and miR-106b mimic or negative control, no differences were observed. Values are expressed as means ± SD (n = 6). B. 3’-UTR C1orf24 mRNA showing wild type (wt) and mutated (mut) seed sequence which correspond to the binding site of miR-106b. **P < 0.01.
C1orf24 knockdown, through ectopic expression of miR-106b, increases apoptosis rate and inhibits cell migration
We here investigated whether ectopic expression of miR-106b, in WRO and TPC1 cell lines, induces apoptosis. The restoring of miR-106b expression in WRO and TPC1 cells increased apoptosis, compared to negative control (P = 0.0286 and P = 0.0082, respectively, Figures 6A and 6B). We further characterized the effect of C1orf24 knockdown, through ectopic expression of miR-106b, on cell migration using wound-healing assay. After transient transfection, the extent of wound closure was monitored for up to 72 h in WRO and up to 48 h in TPC1. Representative images of two independent experiments performed in quintuplicate are shown in Figures 6C and 6D. Wound-healing assay showed that WRO and TPC1, transfected with miR-106b mimic, diminished scratch wounds closure compared to negative control (P = 0.0008 and P = 0.0119, respectively). Results are graphically represented in Figures 6E and 6F.
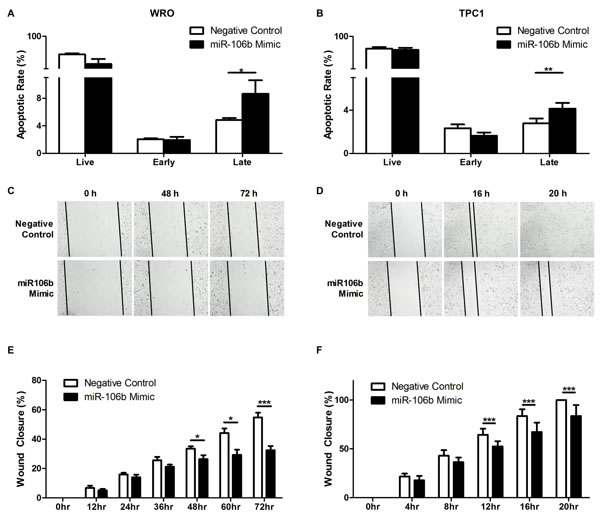
Figure 6: Effect of miR-106b in apoptosis and migration. WRO (A) and TPC1 (B) cells transfected with miR-106b mimic increased late apoptosis rate compared to negative control (P = 0.0286 and P = 0.0082, respectively). Values are expressed as means ± SD (n = 5). Scratch wound assay was performed on WRO (C and TPC1 D) cells transfected with miR-106b or negative control. Data were collected over the indicated period of time and are graphically represented (E and F). Values are expressed as means ± SD (n = 5). *P < 0.05 and *** P < 0.001, Student’s T-Test.
siRNA-mediated knockdown of C1orf24 increases apoptosis while inhibits cell migration and cell cycle progression
In order to check if the effects observed after miR-106b transfection into thyroid cell lines were due to C1orf24 inhibition or due to an interaction with other gene, WRO and TPC1 cells were transiently transfected with small interfering RNA specific to C1orf24 (si-C1orf24) or scrambled siRNA negative control (si-NC). Two siRNAs (si-C1orf24#1 and si-C1orf24#2) were able to knockdown the expression of C1orf24 (Supplementary Figure S2A). However si-C1orf24#1 showed greater knockdown efficiency and, therefore, was selected for further in vitro analysis (Supplementary Figure S2B). siRNA-mediated knockdown of C1orf24 increased apoptosis in WRO (P = 0.0052) and TPC1 cells (P = 0.0317) (Figures 7A and 7B). We further characterized the effect of the si-C1orf24 knockdown on cell migration using wound-healing assay. The extent of wound closure was monitored for up to 72 h in WRO and up to 48 h in TPC1. Representative images of two independent experiments are shown in Figures 7C and 7D. C1orf24 knockdown inhibited scratch wounds closure at 72 h in WRO and at 16 h in TPC1 (P < 0.0001) (Figures 7E and 7F). To determine whether cell cycle was affected as a consequence of si-C1orf24 knockdown, cell cycle progression was monitored. si-C1orf24 knockdown increase the percentage of cells in the G2/M phase in WRO cell line (P = 0.033) and, the percentage of cells in G0/G1 in TPC1 cell line (P = 0.029) (Figures 7G and 7H).
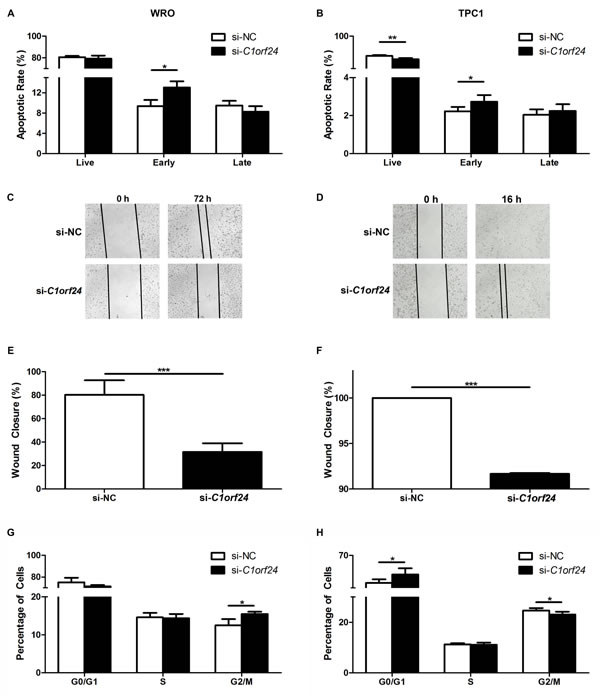
Figure 7: Effect of siRNA-mediated C1orf24 knockdown in apoptosis, migration and cell cycle. WRO (A) and TPC1 (B) cells transfected with siRNA specific to C1orf24 (si-C1orf24) increased early apoptosis rate compared to negative control (si-NC, P = 0.0052 and P = 0.0317, respectively). Significant reduction in percentage of live TPC1 cells were detected after transfection with si-C1orf24 (P = 0.0079). Values are expressed as means ± SD (n = 5). Scratch wound assay was performed on WRO (C) and TPC1 (D) cells transfected with si-C1orf24 or si-NC. Data were collected over the indicated period of time and are graphically represented (E and F). WRO G. cells transfected with si-C1orf24 increased G2/M phase arrest compared to control (P = 0.033). G0/G1 phase arrest was observed in TPC1 cells (P = 0.029) (H). Values are expressed as means ± SD (n = 5). ***P < 0.001, Student’s T-Test.
DISCUSSION
Our group previously identified C1orf24 as one of the molecular markers differentially expressed between benign and malignant thyroid nodules and, therefore, a potential preoperative diagnosis marker [6-9]. Several studies showed that C1orf24 is highly expressed in thyroid carcinomas [12] and other human cancers [10, 11, 13, 22]. However, the molecular mechanisms underlying its expression remain largely unknown.
It is known that miRNAs regulate gene expression at post-transcriptional level. Several studies have demonstrated that miRNAs repress the expression of oncogenes or tumor suppressor genes and, therefore, miRNA deregulation can contribute directly to the development of cancer, including thyroid cancer [21, 23-27]. Hence, we here investigated if miRNAs could down-regulate the expression of C1orf24.
Using an in silico analysis, five miRNAs, belonging to the miR-17 family, were predicted to target the C1orf24 3’-UTR site. The expression of the miRNAs miR17-5p and miR-106b were validated in thyroid samples. The expression of the miR17-5p did not differ between benign and malign tumors and, therefore, was not further explored. However, the expression of the miR-106b was significantly lower in thyroid carcinomas specimens and thyroid carcinoma cell lines than its expression in benign thyroid lesions. Moreover, an inverse correlation between C1orf24 and miR-106b expression was observed in thyroid carcinomas, suggesting that miR-106b may attenuate C1orf24 expression. Of note, miR-106b was recently described as one of 14 miRNAs that comprise the signature for classification of FTA and FTC [27].
We also showed that restoration of miR-106b expression, in WRO and TPC1 thyroid carcinoma cell lines, inhibited C1orf24 expression at both mRNA and protein levels. As our findings suggest that miR-106b mimic can promote C1orf24 mRNA degradation, we used C1orf24-specific oligonucleotide to prime first-strand cDNA and to evaluate the C1orf24 expression by qPCR. The miR-106b mimic represses C1orf24 expression at similar rate to that observed when cDNA was primed using oligo-dT oligonucleotide (Figures 4A and 4B). These findings indicate that miR-106b can decrease C1orf24 expression by either inhibiting translation or directly causing degradation of its mRNA.
Additionally, we employed luciferase reporter-gene assay to confirm C1orf24 as a target gene of miR-106b. Reduced luciferase activity confirmed that miR-106b binds to C1orf24 3’-UTR cloned region. On the other hand, site-direct mutagenesis in the miR-106b-binding site did not change luciferase activity, demonstrating that mutations in this binding site abolished its regulation. Therefore, here provide evidences that miR-106b directly regulates C1orf24, validating the in silico prediction approach [27].
Although the role of C1orf24 in cancer remains unknown, it has been shown that C1orf24 knockdown, by RNA interference, induces apoptosis [28]. Moreover, ectopic expression of miR-106b in breast cancer cell lines represses tumor migration, invasion and proliferation [29]. Hence, we investigated the effects of C1orf24 knockdown through both ectopic expression of miR-106b and siRNA on apoptosis and cell migration. Our in vitro data support the hypothesis that C1orf24 inhibits apoptosis. Inhibition of C1orf24 expression by restoring miR-106b expression in follicular and papillary thyroid carcinoma cell lines significantly promoted late apoptosis while siRNA knockdown induced early apoptosis. Differences in apoptotic response can be partially explained by silencing efficacy (78%, Figures 4C, 4D, and 95%, Supplementary Figure S2), once siRNA is a specific silencing sequence while miRNAs can target different genes. Additionally, we also demonstrate, for the first time, that the inhibition of C1orf24 expression, via siRNA knockdown or miR-106b expression, reduced cell migration.
Lastly, C1orf24 knockdown induced cell cycle arrest. Since miR-106b can target different genes known to be involved in cell cycle, we did not evaluate its effect on cell cycle regulation. Intriguingly, in the WRO cells, with mutant P53, the cell cycle arrest occurred at G2/M phase while in the TPC1 cells, with wild-type P53 status, the cell cycle arrest occurred at G0/G1 phase. It is well know that the p53-independent apoptosis slow the process occurring after a G0/G1 phase arrest while the p53-dependent apoptosis is much more faster and is characterized by early and late apoptotic phases, taking place in cells arrested at G0/G1 phase [30].
The apparent association between C1orf24, P53 and apoptosis has been previously suggested by Ji et al 2012 [31]. They have been described that AKT phosphorylates C1orf24 at S602 under stress conditions. Phosphorylated C1orf24 binds to NPM, thereby preventing NPM from binding to MDM2. The free MDM2 interacts with P53 promoting its degradation and, therefore, increasing cell survival. Accordingly, C1orf24 depletion induces p53 stabilization and increases cell apoptosis [31].
To the best of our knowledge, this study is the first to provide insights about regulation of C1orf24 expression in cancer. The decreased miR-106b expression and increase C1orf24 expression may have a synergistic effect during the development and progression of thyroid cancer. Accordingly, we believe that C1orf24 could act as an oncogene while miR-106b functions as a tumor suppressor, although further analyses are needed. These findings may have important therapeutic implications, as C1orf24 down-regulation would have anti-proliferative, anti-invasive and pro-apoptotic effects.
MATERIALS AND METHODS
Thyroid samples
A total of 48 thyroid samples were obtained from patients who underwent thyroid surgery between 2000 and 2010 at Hospital São Paulo (Universidade Federal de São Paulo) and Hospital das Clínicas (Universidade de São Paulo). Tissue specimens were frozen in liquid nitrogen immediately after surgical resection and stored at -80ºC until use. Final histological classification was obtained from paraffin-embedded sections. The study included 12 follicular thyroid adenomas (FTA), 10 follicular thyroid carcinomas (FTC), eight classical papillary thyroid carcinomas (CVPTC) and 18 follicular variant of papillary thyroid carcinomas (FVPTC). For all samples, informed consent, approved by the Independent Ethical Committees of Universidade Federal de São Paulo and Universidade de São Paulo, was obtained.
Cell lines
WRO (follicular thyroid carcinoma) cell line was maintained in Dulbecco’s modified essential medium (DMEM) supplemented with 10% fetal bovine serum (FBS) (Life Technologies, Grand Island, NY). FTC 133 (follicular thyroid carcinoma) was maintained in DMEM and Ham´s F12 (1:1 mixture) supplemented with 10% FBS (Life Technologies). FTC 236 (follicular thyroid carcinoma) was maintained in DMEM and Ham´s F12 medium (1:1 mixture) supplemented with 10% FBS (Life Technologies), thyroid stimulating hormone (TSH 1 mU/mL) and insulin (10 µg/mL) (Sigma-Aldrich, St. Louis, MO). FTC 238 (follicular thyroid carcinoma) was maintained in DMEM and Ham´s F12 (1:1 mixture) supplemented with 5% FBS (Life Technologies). TPC1 (papillary thyroid carcinoma) was maintained in RPMI supplemented with 10% FBS (Life Technologies). PCCL3 cell line (normal rat thyroid) was maintained in Ham’s F12 medium (Life Technologies) supplemented with 5% FBS, TSH (1 mU/mL), hydrocortisone (10 ng/mL), transferrin (5 µg/mL) and insulin (10 µg/mL) (Sigma-Aldrich). All cell lines were maintained in a 5% CO2 and 37oC humidified incubator.
miRNA selection
In silico prediction of miRNAs targeting C1orf24 was performed using three miRNA databases and softwares: TargetScan (http://www.targetscan.org/vert_40/), PicTar (http://pictar.mdc-berlin.de/) and miRanda (http://www.microrna.org/microrna/home.do).
RNA isolation and quantitative RT-PCR
Expression level of C1orf24 was quantified by quantitative RT-PCR (qPCR) in all thyroid samples and thyroid carcinoma cell lines. Total RNA was isolated from thyroid samples and cell lines using TRIzol Reagents, according to manufacturer’s instructions (Invitrogen Corp., Carlsbad, CA). One microgram of total RNA from each sample was reverse transcribed into cDNA using oligo(dT)12-18 primers, as described [8]. cDNA was then diluted five-fold, and 1.0 μL aliquot of cDNA was used in a 12 μL PCR reactions containing SYBR Green PCR Master Mix (Applied Biosystems, Foster City, CA) and 10 μmol/L of each primer for target gene or reference gene (RPS8). PCR primers were as follow: C1orf24 sense (5’-CCAGAACTTCCAGACCACCAA-3’) and antisense (5’-CGGAATGCAGCGGAAGATT-3’) and RPS8 sense (5’-AACAAGAAATACCGTGCCC-3’) and antisense (5’-GTACGAACCAGCTCGTTATTAG-3’). To investigate the expression levels of miR-17-5p and miR-106b in thyroid samples and thyroid carcinoma cell lines, 100 ng of total RNA was reversed transcribed into cDNA using TaqMan MicroRNA Reverse Transcription Kit for hsa-miR-17-5p (assay ID 002308), hsa-miR-106b-5p (assay ID 000442) and RNU24 (assay ID 001001) (Applied Biosystems). qPCR was performed using an aliquot of cDNA and TaqMan Universal PCR master mix, according to manufacturer’s recommendation (Applied Biosystems). qPCR reactions were performed in triplicate and threshold cycle (Ct) was averaged (SD ≤1). In thyroid samples, fold changes were calculated according to the comparative ΔΔCt method, as described [6]. FTAs were used as control group.
Western blot analysis
Western blot analysis was performed to assess C1orf24 expression in thyroid carcinoma cell lines, as previously described [32]. Briefly, protein was isolated using an ice-cold buffer containing 50 mM Tris-HCl (pH 7.4), 100 mmol/L NaCl, 50 mM NaF, 1 mM NaVO4, 0.5% NP-40 and protease inhibitor cocktail (Roche, Mannheim, Germany). Lysate was centrifuged at 10.000 x g at 4°C, supernatant was collected and protein concentration was determined using Bradford assay (Sigma-Aldrich). About 50 µg of protein was loaded into a pre-cast NuPAGE 4-12% Bis-Tris Gel (Invitrogen Corp.) and transferred onto a polyvinylidene difluoride membrane (Amersham Biosciences, Piscataway, NJ). Membrane was then incubated with primary antibody overnight at 4°C. Antibodies against C1orf24 (1:200) [7] or anti-α-Tubulin (1:10.000; Sigma Aldrich) were used. Subsequently, membrane was washed and incubated with peroxidase-conjugated secondary antibodies at 1:10.000 dilution (DAKO, Glostrup, Denmark). Immune complexes were detected using SuperSignal West Pico Chemiluminescent Substrate (Pierce, Rockford, IL) and ImageQuant LAS 4000 imaging system (GE Healthcare, Waukesha, WI). The chemiluminescent signal was quantified with ImageQuant software (GE Healthcare).
Ectopic expression of miR-106b mimic in thyroid carcinoma cell lines
To investigate the putative effect of miR-106b on C1orf24 expression, WRO and TPC1 cell lines were transiently transfected the miR-106b double-stranded RNAs, which mimics pre-miR-106b precursor (assay ID PM 10067). The scramble control miRNA duplex (assay ID AM 17110) was used as negative control (Ambion, Foster City, CA, USA). WRO cell line (8 x 10⁴) was transfected with 30 nM of miR-106b or negative control mimics using siPORT neoFX transfection reagents, according to manufacturer’s instruction (Ambion). TPC1 cell line (2.5 x 10⁵) was transfected with 100 nM of miR-106b or negative control mimics by cell electroporation (150 V, 900 µF).
Transient transfection of siRNA targeting C1orf24 in thyroid carcinoma cell lines
To investigate the putative effect of C1orf24 silencing, we transiently transfected two pre-designed validated small interfering RNAs (siRNA) for human C1orf24 (si-C1orf24#1 and si-C1orf24#2) into WRO. These siRNAs and the scramble siRNA negative control were commercially obtained from Ambion. WRO and TPC1 cell lines were transiently transfected as described above.
C1orf24 knockdown analysis
To monitor the mRNA expression of C1orf24, cells were harvested 48 h (TPC1) and 72 h (WRO) after either transfection with miR-106b mimic, si-C1orf24 or respective scramble negative controls. Total RNA was extracted using TRIzol Reagents (Invitrogen Corp.). First-strand cDNA was primed using oligo(dT)12-18, as described above. Subsequently, C1orf24 expression was measured by qPCR and relative expression calculate as above [6]. To confirm down-regulation of C1orf24 at mRNA levels, cDNA synthesis was performed using gene-specific primer cocktails, as described by Liles et al [33]. Primers for target (C1orf24) and internal control (RPS8) were used. Oligonucleotides were as follow: C1orf24 antisense (5’-CGGAATGCAGCGGAAGATT-3’) and RPS8 antisense (5-’GTACGAACCAGCTCGTTATTAG-3’). Threshold cycle (Ct) was averaged (SD ≤1). The knockdown ratio (% KD) was calculated using the 100.(2ΔΔCt) method, accordingly to manufacturers’ instructions (Ambion). Negative control was used as reference sample. Each analysis was performed in three experimental replicates with three technical replicates within each experiment. To monitor the expression of C1orf24 at protein level, cells were harvested 72 h after transfection with miR-106b mimic, si-C1orf24 or respective scramble negative controls. Western blot analysis was performed as afore mentioned. Three technical replicates were performed and SEM±SD were used to statistical analysis.
Generation of the construct containing a 3’-UTR region of the human C1orf24
To demonstrate a direct interaction between miR-106b and C1orf24, a 688-bp region of C1orf24 3’-UTR containing the potential miR-106b binding site, as predicted by the informatics analysis, was PCR-amplified using a cDNA from a follicular thyroid carcinoma. Primers were as follow: sense: 5’-CCGTCTAGAACGTGAAGGAGGGAGAAGGT-3’ and antisense: 5’-CCGTCTAGAGGATGAGTAA CAGGCCCAGA-3’ (with XbaI linkers underlined). Primers were designed using Primer3 program (http://www.ncbi.nlm.nih.gov/tools/primer-blast/). Then PCR product was cloned into pCR2.1-TOPO vector (Invitrogen Corp.), according to manufacturer’s instructions. To confirm the identity of PCR products, DNA isolated from pCR2.1-TOPO containing 3’-UTR of C1orf24 was sequenced using ABI Prism BigDye Terminator Cycle Sequencing Kit (Applied Biosystems) as described [34]. To retrieve the fragment containing the 3’-UTR of C1orf24, the pCR2.1-TOPO construct was digested with XbaI. The purified fragment was subcloned into pmirGLO Dual-Luciferase miRNA Target Expression Vector (Promega Corp., Madison, WI). This vector simultaneously expresses both Renilla and Firefly Luciferase. The construct was sequenced to confirm the insertion of 3’-UTR fragment of C1orf24 downstream of Firefly Luciferase (Luc2).
Site-directed mutagenesis at predicted miR-106b binding site in the 3’-UTR region of the human C1orf24
We next introduced mutations in the seed sequence recognized by miR-106 in C1orf24 mRNA. The mutant vector was created by replacing the seed regions (GCACTTT), cloned into pmirGLO Dual-Luciferase vector as above, to ATGTGGG by site-directed mutagenesis (QuikChange II XL kit, Agilent Technologies, La Jolla, CA). Oligonucleotides containing the mutated miR-106b binding site were designed using the PrimerX, a program that automate designs mutagenic PCR primers for site-direct mutagenesis (http://www.bioinformatics.org/primerx/). The oligonucleotides were designed as follow: sense: 5’ - TGTGCAATCTT CTTGTATGTGGGAAGGCTTTTTAATTTTG-3, antisense: 5’-CAAAATTAAAA AGCCTTCCCACATACAAGAAGATTGCACA-3’. Plasmid DNA was subsequently sequenced to confirm the presence of desired mutations and to exclude potential unwanted mutations.
Dual-luciferase reporter assay in PCCL3 cell line
Cells were seeded onto 24-well tissue culture plates at a cell density 8 x 10⁴. Transient co-transfection with either the wild type (wt) or mutated (mut) constructs and miR-106b or negative control mimics were performed using siPORT neoFX (Ambion). Forty-eight hours after transfections, cells were washed with PBS and incubated with Passive Lysis Buffer. Firefly and Renilla luciferase activities were measured using Dual-Luciferase Reporter Assay System (Promega Corp.) using a luciferase multi-well plate reader Wallac Victor III (PerkinElmer, Waltham, MA), according to manufacturer protocol. Results are expressed as Firefly/Renilla luciferase ratios.
Apoptosis assay
We tested whether knockdown of C1orf24, by transfection of cells with miR-106b, would induce apoptosis. About 6.6 x 10⁴ WRO and 105 TPC1 cells were transiently transfected either with miR-106b mimic, si-C1orf24 or respective scramble negative controls using siPORT neoFX transfection agent, according to manufacturer’s instructions (Ambion), and cell electroporation (150 V, 900 µF), respectively. After 72 hours of WRO transfection and 48 hours of TPC1, cells were double-stained with Annexin V and Nexin 7-AAD according to manufacturer’s recommendations (Millipore Corp., Billerica, MA). Cell-associated fluorescence was analyzed by Guava EasyCyte Mini flow cytometer (Millipore Corp.). Results are expressed as percentage of apoptotic positive cells. Both early apoptotic (annexin V-positive) and late apoptotic (annexin V- and 7 AAD-positive) cells were included in the analysis. Experiments were performed in quintuplicates.
Scratch wound healing assay
Scratch assay was used to investigate the effects of miR-106b expression on cell migration. Briefly, 6.6 x 10⁴ WRO and 1.9 x 10⁵ TPC1 cells were transiently transfected with miR-106b mimic, si-C1orf24 or respective scramble negative controls using siPORT neoFX transfection agent to WRO cells according to manufacturer’s instructions (Ambion) and cell electroporation (150 V, 900 µF) to TPC1 cells. After 24 hours of transfection, the “wound gap” was introduced, by scraping the cell monolayer with a pipette tip, into WRO and TPC1 cultures. Then, the medium was replaced and incubated in a humidified chamber at 37o C with 5% CO2, integrated with Zeiss Axio Observer Z1 inverted phase microscope system and equipped with a MRc camera (Carl Zeiss, Göttingen, Germany). Images at time zero were captured to record the initial area of wounds. Subsequently, images were taken every one hour, over the course of 72 h, at 5x magnification. Cell migration toward the wounds was expressed as percentage of wound closure. Area of the wound was quantified using CorelDraw Graphics Suite X5 (Ottawa, Canada). Experiments were performed in quintuplicates.
Cell cycle analysis
WRO (4 x 10⁴) and TPC1 (105) cells were seeded in 24-well dishes. After synchronization of the cells by serum starvation for 24 h, cells were replaced with DMEM medium, in WRO cell line, and RPMI medium, in TPC1 cell line, supplemented with 10% FBS for next 24 h. Cells were fixed in 70% ethanol for 1 h, labeled with Guava Cell Cycle Assay reagent and analyzed using Guava PCA flow cytometer (Guava Technologies) according to manufacturer’s recommendation. Experiments were performed in quintuplicate.
Statistical analysis
Relative expression levels and band intensities were compared using Mann-Whitney U test. Firefly and Renilla Luciferase activities ratio was calculated by One-Way ANOVA (Bonferroni post-hoc test). Differences in apoptotic rate, wound closure and cell cycle assay were analyzed by student’s T-test and by its non-parametric analysis of Mann-Whitney U test, when data were not found to be normally distributed. All statistics were calculated using GraphPad PRISM (Version 5.0; San Diego, CA). P value < 0.05 was considered statistically significant.
Acknowledgments AND FUNDING
We thank Professor Dr. Adriana Carmona and Dr. Thaysa Paschoalin for using the Axio Observer Z1 inverted microscope system equipped with an MRc camera, which is multi-user equipment, acquired with resources from a FAPESP, grant number 2009/53840-0.
Financial information
This research was supported by research grants from The São Paulo State Research Foundation (FAPESP), grant number 2012/02902-9, and Brazilian Research Council (CNPq), grant number 470441/2013, for JMC. BHN is FAPESP scholar. JMC is investigator with the CNPq.
Conflicts of interest
The authors have no conflicts of interest to declare.
REFERENCES
1. Ezzat S, Sarti DA, Cain DR and Braunstein GD. Thyroid incidentalomas. Prevalence by palpation and ultrasonography. Arch Intern Med. 1994; 154:1838-1840.
2. Alexander EK, Heering JP, Benson CB, Frates MC, Doubilet PM, Cibas ES and Marqusee E. Assessment of nondiagnostic ultrasound-guided fine needle aspirations of thyroid nodules. J Clin Endocrinol Metab. 2002; 87:4924-4927.
3. Baloch ZW, LiVolsi VA, Asa SL, Rosai J, Merino MJ, Randolph G, Vielh P, DeMay RM, Sidawy MK and Frable WJ. Diagnostic terminology and morphologic criteria for cytologic diagnosis of thyroid lesions: a synopsis of the National Cancer Institute Thyroid Fine-Needle Aspiration State of the Science Conference. Diagn Cytopathol. 2008; 36:425-437.
4. Baloch ZW and LiVolsi VA. Fine-needle aspiration of the thyroid: today and tomorrow. Best Pract Res Clin Endocrinol Metabol. 2008; 22:929-939.
5. American Thyroid Association Guidelines Taskforce on Thyroid N, Differentiated Thyroid C, Cooper DS, Doherty GM, Haugen BR, Kloos RT, Lee SL, Mandel SJ, Mazzaferri EL, McIver B, Pacini F, Schlumberger M, Sherman SI, Steward DL and Tuttle RM. Revised American Thyroid Association management guidelines for patients with thyroid nodules and differentiated thyroid cancer. Thyroid. 2009; 19:1167-1214.
6. Cerutti JM, Delcelo R, Amadei MJ, Nakabashi C, Maciel RM, Peterson B, Shoemaker J and Riggins GJ. A preoperative diagnostic test that distinguishes benign from malignant thyroid carcinoma based on gene expression. J Clin Invest. 2004; 113:1234-1242.
7. Cerutti JM, Latini FR, Nakabashi C, Delcelo R, Andrade VP, Amadei MJ, Maciel RM, Hojaij FC, Hollis D, Shoemaker J and Riggins GJ. Diagnosis of suspicious thyroid nodules using four protein biomarkers. Clin Cancer Res. 2006; 12:3311-3318.
8. Cerutti JM, Oler G, Delcelo R, Gerardt R, Michaluart P, Jr., de Souza SJ, Galante PA, Huang P and Riggins GJ. PVALB, a new Hurthle adenoma diagnostic marker identified through gene expression. J Clin Endocrinol Metab. 2011; 96:E151-160.
9. Carvalheira GM, Nozima BH, Riggins GJ and Cerutti JM. DDIT3, STT3A (ITM1), ARG2 and FAM129A (Niban, C1orf24) in diagnosing thyroid carcinoma: variables that may affect the performance of this antibody-based test and promise. Mod Pathol. 2013; 26:611-613.
10. Majima S, Kajino K, Fukuda T, Otsuka F and Hino O. A novel gene “Niban” upregulated in renal carcinogenesis: cloning by the cDNA-amplified fragment length polymorphism approach. JPN J Cancer Res. 2000; 91:869-874.
11. Adachi H, Majima S, Kon S, Kobayashi T, Kajino K, Mitani H, Hirayama Y, Shiina H, Igawa M and Hino O. Niban gene is commonly expressed in the renal tumors: a new candidate marker for renal carcinogenesis. Oncogene. 2004; 23:3495-3500.
12. Matsumoto F, Fujii H, Abe M, Kajino K, Kobayashi T, Matsumoto T, Ikeda K and Hino O. A novel tumor marker, Niban, is expressed in subsets of thyroid tumors and Hashimoto’s thyroiditis. Hum Pathol. 2006; 37:1592-1600.
13. Ito S, Fujii H, Matsumoto T, Abe M, Ikeda K and Hino O. Frequent expression of Niban in head and neck squamous cell carcinoma and squamous dysplasia. Head Neck. 2010; 32:96-103.
14. Hammond SM, Caudy AA and Hannon GJ. Post-transcriptional gene silencing by double-stranded RNA. Nat Rev Genet. 2001; 2:110-119.
15. Carrington JC and Ambros V. Role of microRNAs in plant and animal development. Science. 2003; 301:336-338.
16. Chen CZ, Li L, Lodish HF and Bartel DP. MicroRNAs modulate hematopoietic lineage differentiation. Science. 2004; 303:83-86.
17. Yu SL, Chen HY, Yang PC and Chen JJ. Unique MicroRNA signature and clinical outcome of cancers. DNA Cell Biol. 2007; 26:283-292.
18. Calin GA, Sevignani C, Dumitru CD, Hyslop T, Noch E, Yendamuri S, Shimizu M, Rattan S, Bullrich F, Negrini M and Croce CM. Human microRNA genes are frequently located at fragile sites and genomic regions involved in cancers. Proc Natl Acad Sci USA. 2004; 101:2999-3004.
19. Lu J, Getz G, Miska EA, Alvarez-Saavedra E, Lamb J, Peck D, Sweet-Cordero A, Ebert BL, Mak RH, Ferrando AA, Downing JR, Jacks T, Horvitz HR and Golub TR. MicroRNA expression profiles classify human cancers. Nature. 2005; 435:834-838.
20. de la Chapelle A and Jazdzewski K. MicroRNAs in thyroid cancer. J Clin Endocrinol Metab. 2011; 96:3326-3336.
21. Nikiforova MN, Tseng GC, Steward D, Diorio D and Nikiforov YE. MicroRNA expression profiling of thyroid tumors: biological significance and diagnostic utility. J Clin Endocrinol Metab. 2008; 93:1600-1608.
22. Kannangai R, Diehl AM, Sicklick J, Rojkind M, Thomas D and Torbenson M. Hepatic angiomyolipoma and hepatic stellate cells share a similar gene expression profile. Hum Pathol. 2005; 36:341-347.
23. Weber F, Teresi RE, Broelsch CE, Frilling A and Eng C. A limited set of human MicroRNA is deregulated in follicular thyroid carcinoma. J Clin Endocrinol Metab. 2006; 91:3584-3591.
24. Leone V, D’Angelo D, Rubio I, de Freitas PM, Federico A, Colamaio M, Pallante P, Medeiros-Neto G and Fusco A. MiR-1 is a tumor suppressor in thyroid carcinogenesis targeting CCND2, CXCR4, and SDF-1alpha. J Clin Endocrinol Metab. 2011; 96:E1388-1398.
25. He H, Jazdzewski K, Li W, Liyanarachchi S, Nagy R, Volinia S, Calin GA, Liu CG, Franssila K, Suster S, Kloos RT, Croce CM and de la Chapelle A. The role of microRNA genes in papillary thyroid carcinoma. Proc Natl Acad Sci USA. 2005; 102:19075-19080.
26. Pallante P, Battista S, Pierantoni GM and Fusco A. Deregulation of microRNA expression in thyroid neoplasias. Nat Rev Endocrinol. 2014; 10:88-101.
27. Rossing M, Borup R, Henao R, Winther O, Vikesaa J, Niazi O, Godballe C, Krogdahl A, Glud M, Hjort-Sorensen C, Kiss K, Bennedbaek FN and Nielsen FC. Down-regulation of microRNAs controlling tumourigenic factors in follicular thyroid carcinoma. J Mol Endocrinol. 2012; 48:11-23.
28. Sun GD, Kobayashi T, Abe M, Tada N, Adachi H, Shiota A, Totsuka Y and Hino O. The endoplasmic reticulum stress-inducible protein Niban regulates eIF2alpha and S6K1/4E-BP1 phosphorylation. Biochem Biophys Res Commun. 2007; 360:181-187.
29. Ni X, Xia T, Zhao Y, Zhou W, Wu N, Liu X, Ding Q, Zha X, Sha J and Wang S. Downregulation of miR-106b induced breast cancer cell invasion and motility in association with overexpression of matrix metalloproteinase 2. Cancer Sci. 2014; 105:18-25.
30. Peled A, Zipori D, Rotter V. Cooperation between p53-dependent and p53-independent apoptotic pathways in Myeloid cells. Cancer Res. 1996; 56: 2148-2156.
31. Ji H, Ding Z, Hawke D, Xing D, Jiang BH, Mills GB and Lu Z. AKT-dependent phosphorylation of Niban regulates nucleophosmin- and MDM2-mediated p53 stability and cell apoptosis. EMBO Rep. 2012; 13:554-560.
32. Latini FR, Hemerly JP, Oler G, Riggins GJ and Cerutti JM. Re-expression of ABI3-binding protein suppresses thyroid tumor growth by promoting senescence and inhibiting invasion. Endocr Relat Cancer. 2008; 15:787-799.
33. Liles LC, Kumar MA and Weinshenker D. Use of Gene-Specific Primer Cocktails for First-Strand cDNA Synthesis With a Reverse Transcriptase Kit. Am Biotechnol Lab. 2004: 20-21.
34. Hemerly JP, Bastos AU and Cerutti JM. Identification of several novel non-p.R132 IDH1 variants in thyroid carcinomas. Eur J Endocrinol. 2010; 163:747-755.