
Introduction
Thyroid neoplasm is the one of the commonest endocrine tumors worldwide with an overall malignant risk of 5~10%, and is mostly present in thyroid nodules with different pathological forms [1]. Malignant types include papillary thyroid carcinoma (PTC, 88.0%), follicular thyroid carcinoma (FTC, 5.5%), Hűrthle cell (2.3%), medullary thyroid carcinoma (MTC, 1.8%), and anaplastic thyroid carcinoma (ATC, 0.9%) [2-3]. Researchers have observed a rapid global rise in thyroid cancer incidence over the past few decades [4-6]. In developed countries, the newly diagnosed patients with thyroid cancer gradually increased from 4.9 per 100,000 in 1975 to 12.0 per 100,000 in 2011 (9.1 per 100,000 females and 2.9 per 100,000 males, respectively) [7]. It is also observed that the overwhelming rise in the incidence of thyroid cancer parallels the increasing detection rate of malignant thyroid nodules [8-9]. However, the mortality of thyroid cancer remains the same [10-12]. Therefore, some researchers propose that excessive attention to thyroid cancer may give rise to the misdiagnosis and overtreatment of thyroid cancer, which discourages the effort on the early detection [13-14].
There are various pathological types of thyroid cancers with large differences in prognosis. As National Comprehensive Cancer Network (NCCN) revealed in 2014, ATC is almost uniformly lethal, but most deaths from thyroid carcinoma occur in patients with differentiated carcinoma (e.g., PTC, FTC, or Hűrthle), which accounts for over 90% of all cases with thyroid malignancy [5]. Thus, when properly treated, most patients, especially those cases with differentiated types, can be cured or at least their life expectancy could be extended with a 5-year survival rate of 97.8% [15]. Obviously, early detection and accurate differential diagnosis are critical.
Individualized or appropriate treatment depends on the nature of the lesion. The current focus of diagnosis is to distinguish malignancies from benign growths. Fine-needle aspiration biopsy (FNAB) is the best first-line procedure for differential diagnosis of a thyroid nodule, and pathological examination is considered as the gold standard. However, up to one-third of those FNAB results are inconclusive [16-18]. Sonography is another option for screening unknown thyroid nodule and lymph node structure, but this procedure has a relatively low capacity for differential diagnosis [19]. Conventional diagnostic methods including sonography and FNAB cannot provide definitive diagnoses in many cases [20-23]. Therefore, there is an urgent need for the selection of highly accurate tests and differential diagnostic approaches to identify thyroid malignancies.
In the present study, we used a different computational approach to distinguish the thyroid cancer. We collected and analyzed the clinical information of nearly 14,000 patients and established a database including demographic characteristics, preoperative clinical manifestations, serological results, ultrasound results, and pathologic examination. The preoperative predictors for nodular nature were also investigated. In addition, we established and validated a risk prediction model named thyroid malignancy risk scoring system (TMRS) for the differential preoperative diagnosis for thyroid cancers (Figure 1). Our results also showed that the TMRS was a highly reliable and discriminative panel to screen predictors for thyroid cancer, and could also provide a new means of differentiating this common type of endocrine cancer.
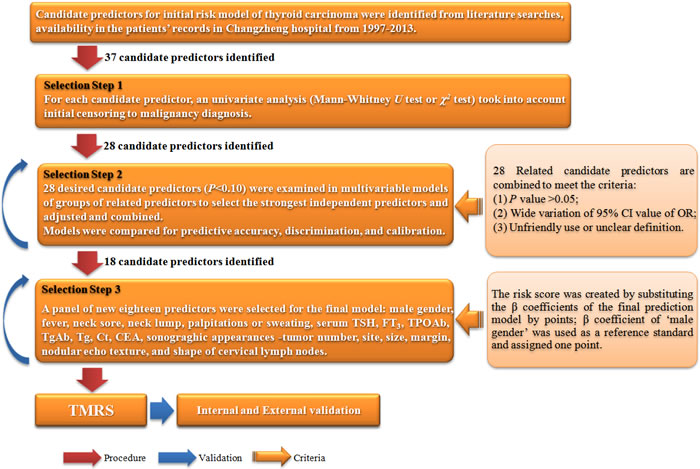
Figure 1: Flow chart of analytic steps in the establishment of TMRS.
Results
Characterization of the patients with thyroid tumor
A total of 13,980 thyroid tumor patients with complete medical record on the preoperative examination and thyroid surgery were included.
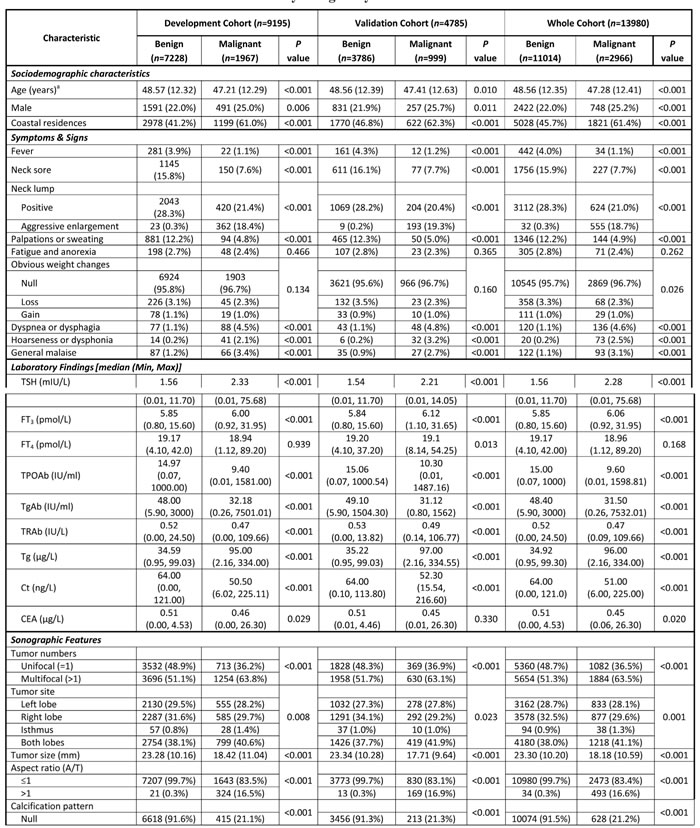
The mean age in the study (n = 13,980) was 48.28 years, 77.30% were women, and 2,966 (21.22%) patients were diagnosed with thyroid carcinoma after surgery. All the participants were randomly divided into development (n = 9,195) and validation (n = 4,785) cohorts. In the development and validation cohort, the mean age was 48.75 and 48.32 years, female ratio was 77.35% and 77.26%, and 1,967 (21.39%) and 999 (20.88%) patients were diagnosed as thyroid cancer, respectively. No significant differences were found on characteristics between the two cohorts. Table 1 illustrates the detailed baseline characteristics of the patients.
Table 1: Baseline characteristics of the cohorts by malignancy status.
A panel of 28 candidate predictors for a differential diagnostic model of thyroid malignancy
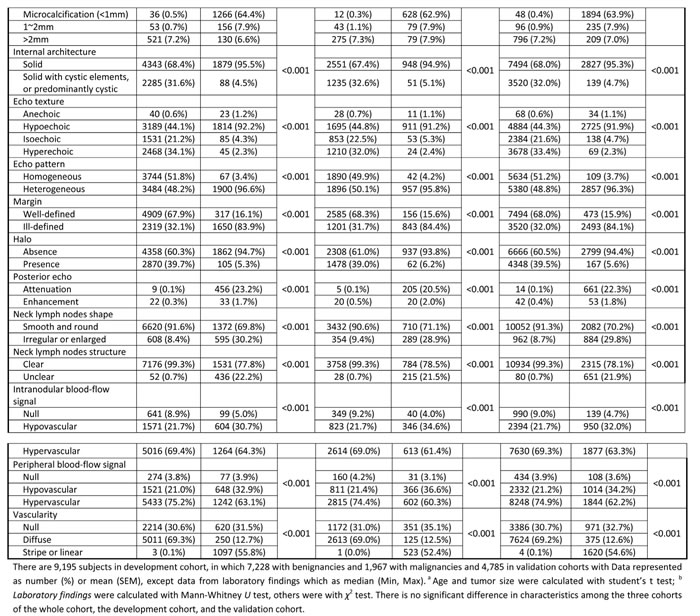
Twenty-eight of the 46 candidate predictors met the selection criteria (P < 0.10) for both prevalence and incidence of thyroid malignancies. The 28 selected candidate predictors were all significantly associated with diagnosis of thyroid malignancy in multiple logistic regression analysis (P < 0.01, Table 2), and were included in the second selection step. The receiver operating characteristic (ROC) curve showed a discrimination of the area under the ROC curve (AUC) was 0.997 (Figure 2A), demonstrating that the 28 predictors had excellent diagnostic performance. But the Hosmer-Lemeshow χ2 test showed a calibration of 20.639 (df = 8, P = 0.008), indicating a significant difference between the actual and predicted malignancy diagnoses.
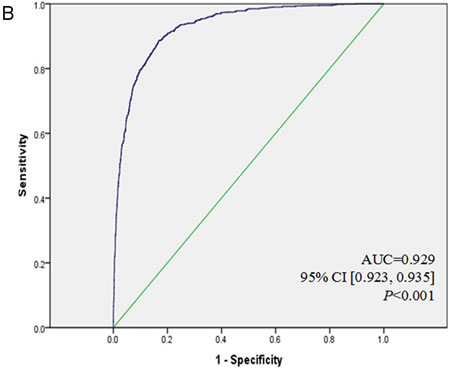
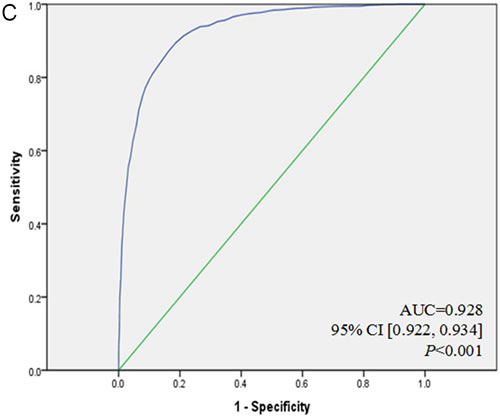
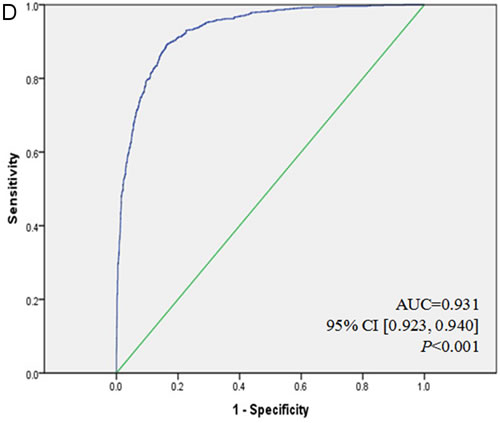
Figure 2: ROC curves for TMRS in development and validation cohort. A. ROC curve for 28 candidate predictors of thyroid malignancy in the development cohort was with a very excellent discrimination (AUC = 0.997). B. ROC curve for the final multivariable model with 18 candidate predictors for thyroid malignancy according to Q.C.[23] and P.H.[25], still exhibited an excellent discrimination (AUC = 0.929). C. ROC curve for TMRS in the development cohort showed a stable and excellent discrimination (AUC = 0.928). D. ROC curve for TMRS in the validation cohort was with an excellent discrimination (AUC = 0.931), and there is no statistical difference between C. and D. (P = 0.622).
Table 2: Initial multivariable model for the thyroid malignancy with 28 predictors in the development cohort
Characteristic |
Odds Ratio (OR) value |
95% CI |
P value |
Gender |
|||
Male |
1 |
||
Female |
1.78 |
1.15, 2.77 |
0.010 |
Symptoms & Signs |
|||
Fever |
|||
No |
1 |
||
Yes |
0.09 |
0.02, 0.33 |
<0.001 |
Neck Sore |
|||
No |
1 |
||
Yes |
0.11 |
0.06, 0.23 |
<0.001 |
Neck Lump |
<0.001 |
||
No |
1 |
||
Yes |
0.81 |
0.51, 1.28 |
0.361 |
Aggressive enlargement |
231.81 |
69.45, 773.72 |
<0.001 |
Palpations & sweating |
|||
No |
1 |
||
Yes |
0.15 |
0.06, 0.35 |
<0.001 |
Dyspnea or dysphagia |
|||
No |
1 |
||
Yes |
2.94 |
0.98, 8.84 |
0.055 |
Laboratory Findings |
|||
TSH (mIU/L) |
1.84 |
1.50, 2.26 |
<0.001 |
FT3 (pmol/L) |
2.18 |
1.83, 2.60 |
<0.001 |
TPOAb (IU/ml) |
1.005 |
1.003, 1.006 |
<0.001 |
TgAb (IU/ml) |
1.002 |
1.001, 1.002 |
<0.001 |
TRAb (IU/L) |
1.51 |
1.36, 1.68 |
<0.001 |
Tg (μg/L) |
1.96 |
1.95, 1.97 |
<0.001 |
Ct (ng/L) |
2.25 |
1.76, 2.87 |
<0.001 |
CEA (μg/L) |
1.06 |
1.05, 1.07 |
<0.001 |
Sonographic Features |
|||
Tumor numbers |
|||
Unifocal |
1 |
||
Multifocal |
3.89 |
2.24, 6.76 |
<0.001 |
Tumor site |
|||
Left lobe |
1 |
0.83, 2.45 |
0.202 |
Right lobe |
1.43 |
0.38, 13.86 |
0.365 |
Isthmus |
2.30 |
0.19, 0.53 |
<0.001 |
Both lobes |
0.32 |
0.92, 0.96 |
<0.001 |
Tumor size (mm) |
0.94 |
0.92, 0.96 |
<0.001 |
A/T |
|||
≤1 |
1 |
||
>1 |
54.73 |
25.46, 117.65 |
<0.001 |
Calcifications |
<0.001 |
||
Null |
1 |
||
Microcalcification (<1mm) |
127.39 |
62.14, 261.13 |
<0.001 |
1~2mm |
3.91 |
1.62, 9.46 |
0.002 |
>2mm |
1.7 |
1.00, 2.91 |
0.051 |
Internal architecture |
|||
Solid |
20.41 |
11.05, 37.71 |
<0.001 |
Solid with cystic elements, or predominantly cystic |
1 |
||
Echo texture |
<0.001 |
||
Anechoic |
43.74 |
10.86, 176.11 |
<0.001 |
Hypoechoic |
7.58 |
3.47, 16.56 |
<0.001 |
Isoechoic |
1.32 |
0.51, 3.45 |
0.566 |
Hyperechoic |
1 |
||
Echo pattern |
|||
Homogeneous |
1 |
||
Heterogeneous |
12.17 |
6.68, 22.16 |
<0.001 |
Margin |
|||
Well-defined |
1 |
||
Ill-defined |
9.01 |
0.64, 82.21 |
0.009 |
Posterior echo |
<0.001 |
||
Normal |
1 |
||
Attenuation |
57.9 |
20.65, 162.35 |
<0.001 |
Enhancement |
0.34 |
0.08, 1.43 |
0.141 |
Neck lymph nodes shape |
|||
Smooth and round |
1 |
||
Irregular or enlarged |
0.38 |
0.20, 0.71 |
0.002 |
Neck lymph nodes structure |
|||
Clear |
1 |
||
unclear |
6.7 |
2.66, 16.87 |
<0.001 |
Intranodular blood-flow signal |
<0.001 |
||
Null |
1 |
||
Hypovascular |
9.94 |
3.18, 31.05 |
<0.001 |
Hypervascular |
14.24 |
4.05, 50.07 |
<0.001 |
Peripheral blood-flow signal |
<0.001 |
||
Null |
1 |
||
Hypovascular |
0.07 |
0.02, 0.24 |
<0.001 |
Hypervascular |
0.10 |
0.03, 0.38 |
0.001 |
*The laboratory findings and tumor sizes are continuous variables. |
|||
Selection of the prediction TMRS model with 18 differential diagnostic predictors
In order to improve the discrimination of the previous logistic regression model and make it convenient to use, we reduced the number of predictors in our model as much as possible, without compromising the diagnostic accuracy. Nine of the 28 candidate predictors were excluded for any of the following reasons: (1) P value > 0.05, (2) wide variation of 95% CI value of OR, or (3) difficult to use or unclear definition. We also converted all continuous variables into binary variables using the cutoff of their median values (Table 3a). Some candidate predictors that did not meet the criteria but were associated with thyroid malignancy were integrated into a single predictor (Table 3b, e.g., left lobe, right lobe and isthmus were merged into one lobe). These procedures were repeated in the second selection and logistic regression analysis to recreate and adjust the new prediction model.
Table 3: Final multivariable model for the thyroid malignancy risk score with 18 predictors in the development cohort
Characteristic |
Odds Ratio (95% CI) |
P value |
β coefficient |
Risk score c |
Gender |
||||
Male |
1.22 (1.03, 1.44) |
0.024 |
0.197 |
1 |
Female |
1 |
0 |
||
Symptoms & Signs |
||||
Fever |
||||
No |
4.70 (2.82, 7.83) |
<0.001 |
1.547 |
9 |
Yes |
1 |
0 |
||
Neck Sore |
||||
No |
3.73 (2.96, 4.71) |
<0.001 |
1.316 |
7 |
Yes |
1 |
0 |
||
Neck Lump b |
||||
No |
1 |
0 |
||
Yes |
1.64 (1.40, 1.92) |
<0.001 |
0.494 |
3 |
Palpations & sweating |
||||
No |
3.18 (2.35, 4.29) |
<0.001 |
1.156 |
6 |
Yes |
1 |
0 |
||
Laboratory Findings a |
||||
TSH (mIU/L) |
||||
≤ 1.56 |
1 |
0 |
||
> 1.56 |
2.50 (2.09, 2.98) |
<0.001 |
0.915 |
5 |
FT3 (pmol/L) |
||||
≤ 5.85 |
1 |
0 |
||
> 5.85 |
1.66 (1.42, 1.93) |
<0.001 |
0.505 |
3 |
TPOAb (IU/ml) |
||||
≤ 14.97 |
1 |
0 |
||
> 14.97 |
2.83 (2.39, 3.36) |
<0.001 |
1.041 |
6 |
TgAb (IU/ml) |
||||
≤ 48.00 |
1 |
0 |
||
> 48.00 |
1.20 (1.02, 1.42) |
0.033 |
0.202 |
1 |
Tg (μg/L) |
||||
≤ 34.585 |
1 |
0 |
||
> 34.585 |
7.63 (6.39, 9.10) |
<0.001 |
2.032 |
11 |
Calcitonin (ng/L) |
||||
≤ 64.00 |
1 |
0 |
||
> 64.00 |
1.33 (1.13, 1.55) |
<0.001 |
0.282 |
2 |
CEA (μg/L) |
||||
≤ 0.41 |
1 |
0 |
||
> 0.41 |
1.23 (1.07, 1.43) |
0.005 |
0.211 |
1 |
Sonographic Features |
||||
Tumor numbers |
||||
Unifocal |
1 |
0 |
||
Multifocal |
1.79 (1.46, 2.21) |
<0.001 |
0.585 |
3 |
Tumor site b |
||||
One lobe |
2.57 (2.11, 3.13) |
<0.001 |
0.943 |
5 |
Both lobes |
1 |
0 |
||
Tumor size (mm) a |
||||
≤ 23 |
5.07 (4.27, 6.02) |
<0.001 |
1.623 |
9 |
> 23 |
1 |
0 |
||
Echo texture b |
||||
No or low |
8.79 (7.09, 10.89) |
<0.001 |
2.173 |
12 |
Equal or high |
1 |
0 |
||
Margin |
||||
Well-defined |
1 |
0 |
||
Ill-defined |
4.61 (3.89, 5.47) |
<0.001 |
1.528 |
8 |
Neck lymph nodes shape |
||||
Smooth and round |
1 |
0 |
||
Irregular or enlarged |
3.37 (2.75, 4.12) |
<0.001 |
1.214 |
7 |
a Laboratory findings and tumor size were derived into binary variables by their median values; b In the characteristic of ‘Neck lump’, aggressive enlargement was merged into Yes, ‘Tumor site’ was divided into one or both lobes according to the locations of thyroid cancer in the patient, ‘Echo texture’ was combined into two values, No or low and Equal or high; c risk scores of each predictor were calculated by the β coefficient that they matched (i.e., predictor ‘male gender’ equals 1 point). |
||||
The new model used 18 selected candidate predictors, which were all significantly associated with differential diagnosis of thyroid malignancy in multiple logistic regression analysis. The prediction model included male gender, fever, neck sore, neck lump, palpitations or sweating, laboratory findings (TSH, FT3, TPOAb, TgAb, Tg, Ct, CEA), and sonographic appearances (tumor number, site, size, margin, nodular echo texture, and shape of cervical lymph nodes). This model was strongly predictive of an individual’s thyroid malignancy risk, with excellent diagnostic performance (AUC = 0.929, Figure 2B) and good calibration of 7.961 (df = 8, P = 0.437).
Table 3 showed the β coefficients, odds ratio (OR), and 95% CI for the final model. Gender was used as the standard reference for assigning points for the TMRS, with the β coefficient for male gender (0.197 point) equaling one point. The points for all predictors were relative to this β coefficient (Table 3). Finally, we established this multivariable model of the TMRS and gave the involved predictors certain values (Table 3c), which was a scoring system with a scale from 0 to 99.
Internal and external validation of the TMRS
As shown in Figure 2C, the substitution of the β coefficients with points in the TMRS only slightly decreased the AUC to 0.928. Figure 3A shows the risk of malignancy, which is reported for each summed score. The malignancy risk increased linearly with the scores. Summed scores of less than 40 (i.e., 0~39) and greater than 91 (i.e., 92~99) were fairly rare. Consequently, risk estimates and accuracy power were less stable for these score ranges. Therefore, scores ≤39 and ≥92 were collapsed into two separate categories. There was a substantial difference in thyroid malignancy risk between the lowest summed score at 39 (0%, sensitivity = 1, 1-specificity = 0.994) and the highest summed score of at least 92 (100%, sensitivity = 0.007, 1-specificity < 0.001). The detailed data were shown in Supplementary Table 1.
In the external validation cohort, all predictors in the TMRS had high differential diagnostic power in the validation cohort (P < 0.001, Table 4). In the validation cohort, the Hosmer-Lemeshow χ2 test showed a stable calibration of 5.047 (df = 8, P = 0.753), and the AUC of 0.931 (Figure 2D). The TMRS had similar discriminations in the two cohorts (P = 0.622, Figure 2C vs. Figure 2D). Figure 3B showed the risk of malignancy, which was reported for each summed score in the validation cohort (The detailed data were shown in Supplementary Table 2).
Table 4: Characteristics of the external validation cohort with the diagnosis of thyroid malignancy with TMRS
Characteristic |
OR value |
95% CI |
P value a |
Gender |
|||
Male |
1 |
||
Female |
1.64 |
1.29-2.09 |
<0.001 |
Symptoms & Signs |
|||
Fever |
|||
No |
4.23 |
2.06-8.67 |
<0.001 |
Yes |
1 |
||
Neck Sore |
|||
No |
3.78 |
2.73-5.24 |
<0.001 |
Yes |
1 |
||
Neck Lump |
|||
No |
1 |
||
Yes |
1.98 |
1.58-2.48 |
<0.001 |
Palpations & sweating |
|||
No |
3.13 |
2.05-4.80 |
<0.001 |
Yes |
1 |
||
Laboratory Findings |
|||
TSH (mIU/L) |
|||
≤ 1.56 |
1 |
||
> 1.56 |
3.00 |
2.32-3.87 |
<0.001 |
FT3 (pmol/L) |
|||
≤ 5.85 |
1 |
||
> 5.85 |
2.03 |
1.64-2.53 |
<0.001 |
TPOAb (IU/ml) |
|||
≤ 14.97 |
1 |
||
> 14.97 |
2.11 |
1.68-2.67 |
<0.001 |
TgAb (IU/ml) |
|||
≤ 48.00 |
1 |
||
> 48.00 |
1.73 |
1.37-2.18 |
<0.001 |
Tg (μg/L) |
|||
≤ 34.585 |
1 |
||
> 34.585 |
8.19 |
6.40-10.49 |
<0.001 |
Ct (ng/L) |
|||
≤ 64.00 |
1 |
||
> 64.00 |
1.49 |
1.20-1.86 |
<0.001 |
CEA (μg/L) |
|||
≤ 0.41 |
1 |
||
> 0.41 |
1.21 |
0.98-1.49 |
0.072 |
Sonographic Features |
|||
Tumor numbers |
|||
Unifocal |
1 |
||
Multifocal |
1.57 |
1.17-2.11 |
0.003 |
Tumor site |
|||
One lobe |
2.53 |
1.91-3.34 |
<0.001 |
Both lobes |
1 |
||
Tumor size (mm) |
|||
≤ 23 |
7.02 |
5.48-8.99 |
<0.001 |
> 23 |
1 |
||
Echo texture |
|||
No or low |
8.30 |
6.18-11.15 |
<0.001 |
Equal or high |
1 |
||
Margin |
|||
Well-defined |
1 |
||
Ill-defined |
5.16 |
4.0-6.59 |
<0.001 |
Neck lymph nodes shape |
|||
Smooth and round |
1 |
||
Irregular or enlarged |
3.01 |
2.28-3.99 |
<0.001 |
a Calculated with χ2 test. |
|||
In the two cohorts, summed scores that were less than 65 (i.e., 0~64) occurred more frequently (Figure 3A and 3B). Consequently, risk estimates were more stable for these highest scores. Members with scores equal to and over 65 were considered a high risk population, with a higher malignancy detection rate (59.4% and 60.2%), while the others (0~64) were considered a low-risk population with a lower malignancy detection rate (4.0% and 3.7%). With the cutoff value of 65 points, the results of the χ2 test showed that, compared with patients with the low summed scores (0~64), those with high summed scores (65~99) were 15~17 times more likely to be diagnosed with thyroid malignancy (P < 0.001, Table 5). The accuracy evaluations of the TMRS in development and validation cohorts were listed in Table 5. The sensitivity (SEN), specificity (SPE), accuracy, positive predictive value (PPV), negative predictive value (NPV), positive likelihood ratio (PLR), and negative likelihood ratio (NLR) of the TMRS in the development cohort were 87.0%, 83.5%, 84.5%, 59.4%, 96.0%, 5.27, and 0.16; And in the validation cohort were 87.5%, 84.8%, 85.3%, 60.2%, 96.3%, 5.76, and 0.15.
Table 5: Diagnostic accuracy in different risk levels of the risk score in the development and validation cohorts
Summed Scores a |
Development Cohort b |
Validation Cohort c |
||||
Malignancy (n=1967) |
Benignancy (n=7228) |
Total (n=9195) |
Malignancy (n=999) |
Benignancy (n=3786) |
Total (n=4785) |
|
0~64 |
255 (4.0%) |
6059 (96.0%) |
6314 |
125 (3.7%) |
3209 (96.3%) |
3334 |
65~99 |
1712 (59.4%) |
1169 (40.6%) |
2881 |
874 (60.2%) |
577 (39.8%) |
1451 |
a There were 1,967 patients with thyroid malignancy and 7,228 with benignancy in the development cohort (n=9,195); 999 with malignancy and 3,786 with benignancy in the validation cohort (n=4,785). The low risk population (0~64) and high risk population (65~99) were calculated with χ2 test: b χ2=3608.810, df=1, P<0.001; c χ2=1952.703, df=1, P<0.001. |
||||||
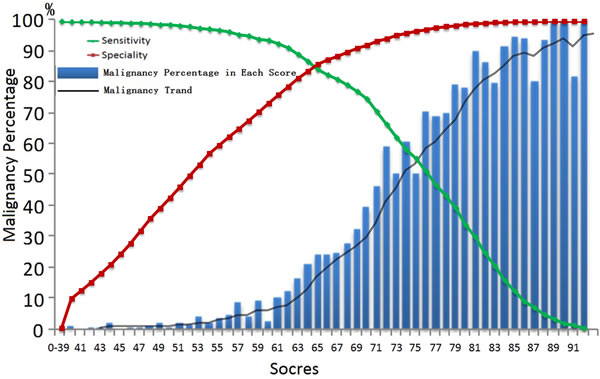
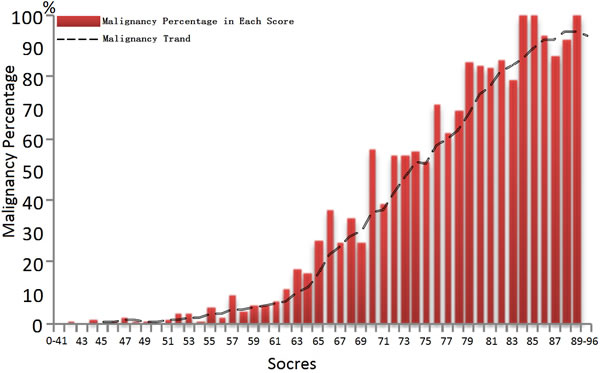
Figure 3: Summed score in TMRS system could predict the risk for thyroid malignancy in the development cohort (A), the green line down and the red line up with the increasement of summed scores.At cuttoff of 65, the TMRs boosts high sensitivity (84.5%) and high specificity (86.0%) relatively.
Discussion
Among human malignancies, thyroid cancer is rare, accounting for approximately 1% of all cancers. However, it is the commonest endocrine malignancy, comprising over 90% of all endocrine cancers [24]. Early accurate detection of thyroid cancer and appropriate treatment for this disease are very important in clinical practice.
Interestingly, the Republic of Korea experienced a fifteen-fold increase in the rate of diagnosed thyroid cancer from 1993 to 2011, although the thyroid cancer mortality rate remained stable [14]. Some believe that excessive attention to thyroid cancer gives rise to overtreatment, while the other researchers suggest that the problem is not actually thyroid malignancy, but the over-diagnosis is attributable to over-screening for this type of cancer [13-14]. Welch in particular suggests that attention from the popular mass media encourages over-diagnosis and inappropriately aggressive treatment [25]. The current issue is how to best weigh the benefits of diagnosis and treatment against their harms [26].
To identify the optimal strategy for well standardized differential diagnosis for thyroid carcinoma, we evaluated the clinical significance of the specific characteristics of thyroid nodules. The TMRS presented in this study is a comprehensive analysis of an individual’s absolute risk of thyroid malignancy based on a panel of predictors including thyroid-related examinations and other clinical information. The diagnostic accuracy of the TMRS was similar in the development and validation cohorts (Figure 2C vs. Figure 2D, Table 5). The TMRS stratifies individuals from scores of 0 to 99. Using the cut-off score of 65 (scores ≥65), the malignancy risk population is shown with a nearly 17 times difference in malignancy risk between the lower (0~64) and the higher summed scores (65~99). It performs well for all age categories and genders. For the higher risk population, they should receive further targeted FNAB with histological diagnosis or thyroid surgery. Individuals with scores < 65 appear to have lower risk of malignancy.
All markers included in the TMRS are easy to access and reading-friendly. We selected the most direct, simplest and objective measures, including demographic characteristics, clinical symptoms and serological examinations. Meanwhile, we also introduced thyroid sonography because it is widely used, but excluded some potentially confounding subjective evaluations like internal architecture, echo pattern, calcification pattern, A/T, posterior echo, neck lymph node structure, and intranodular and peripheral blood-flow signals. In contrast, some commonly used predictors were not included in the final scoring system because of their low differential diagnostic value. In this study, the identification of new predictors specific to thyroid malignancies focuses on the importance of creating a current risk score for patients with suspected thyroid nodules. More importantly, no additional technical-intensive expensive tests or invasive examinations were required, because this TMRS was mainly based on physical examinations, ultrasound imaging, FNA or other histological biopsy. A successful physical examination reveals the clinical manifestation of thyroid growths, and is a promising initiating step as effective screening method for thyroid cancer in primary care settings [1], [27]. Sonography is regarded as another optimal thyroid screening method, with lower costs and easier operation than other imaging exams [9], [19]. FNAB is the most reliable and important means for thyroid diseases worldwide, providing specimen for pathological diagnosis as the gold standard, which had been widely acknowledged by the public [28].
Our TMRS model is established by analyzing and summarizing the detailed data on preoperative clinical information including socio-demographics, clinical manifestations, serum findings and ultrasound features, and postoperative pathological diagnosis in a large diverse cohort of patients with thyroid cancers. We had the opportunity to validate the detection efficacy of this model using a large external cohort of patients, and the results exhibited a similar diagnostic accuracy of the TMRS to that in the development cohort.
Besides, the application of the TMRS may help the clinicians administrate the targeted invasive examinations or further operations for the patients with appropriate indications, which could significantly decrease the chance of over-treatment together with additional mental and economic costs. TMRS score before FNAB can prevent 66.3% of unnecessary procedure-related trauma in contrast with that by using FNAB alone. Thirty-one percentages of the population possessed high risk for malignancy. And in the other two-thirds population with lower malignant risk, about 96.5% were shown to have benign nodules after surgical treatments. The TMRS permits us to prevent as much as 84.1% of patients with benign growths from receiving excessive diagnostic procedures or treatments. On the opposite, 3.9% of patients in the low-risk cohort (TMRS < 65) had false-negative malignant nodules. A cost-benefit analysis for these patients will be conducted soon to evaluate their quality of life and economic burden.
Compared with previous studies including the thyroid nodule ultrasound forecasting model set up by Domínguez [29-31], the TMRS is the only risk score system that is specifically designed for the differential diagnosis of thyroid cancer based on comprehensive and common indicators with relatively high sensitivity and specificity. The TMRS may be useful in the selection of malignant high risk patients for early intervention especially individualized therapy in the future. Clinicians could apply this new model and scoring system to quantify the risk for malignancy, which might guide their decisions in clinical strategy and follow-up screening for such patients with thyroid cancer.
Materials and methods
Patients and study design
We identified patients with suspected thyroid tumor who were diagnosed and had surgery in Changzheng Hospital from June 1997 to December 2013, and collected their clinical information. Overall, we enrolled 13,980 cases meeting inclusion criteria. Patients who had received radiation therapy were excluded from the analysis, since radiation therapy usually interferes with the laboratory results and physical examinations. A total of 10,934 subjects were excluded from the study for any of the following reasons: (1) incomplete or missing medical records (n = 7,012); (2) treated thyroid tumor including local injection (n = 1,103), radiation therapy (n = 955), or thyroidectomy (n = 4,197) or (3) unclear treatment history (n = 728).
This study has been approved by the institution review board at the Second Military Medical University affiliated to Changzheng hospital. And all methods were carried out in accordance with approved guidelines. The informed consent was obtained from all subjects involved.
Grouping and definition
Among all patients in the database, two-thirds (n = 9,195) were randomly selected for the development of the prediction model. The rest (n = 4,785) were used as the validation cohort. All cases were pathologically confirmed by thyroidectomy. For statistical purposes, we categorized patients with ‘Benignancy’ into thyroid Adenoma (TA), simple nodular goiter (SNG), chronic lymphocytic thyroiditis (CLT), painless thyroiditis (PPT), toxic nodular goiter (TNG), and thyroid cyst (TC). Patients with ‘Malignancy’ were categorized into PTC, FTC, MTC, ATC, uncertain malignant potential (UMP), thyroid lymphoma and other metastatic tumor.
Socio-demographic and clinical records
The following characteristics were retrieved from the socio-demographic records: age, gender, and residence. We retrieved information regarding the clinical manifestations of thyroid conditions, including fever, neck sore, neck lump, palpitations or sweating, fatigue and anorexia, obvious weight changes (over 5 kg within 6 months), dyspnea or dysphagia, hoarseness or dysphonia, and general malaise. Serological examinations included examinations of (1) thyroid function: thyroid stimulating hormone (TSH), free three triiodothyronine (FT3), free thyroxine (FT4); (2) thyroid antibodies: thyroglobulin antibody (TgAb), thyroid peroxidase antibody (TPOAb), and thyroid stimulating hormone receptor antibody (TRAb); and (3) specific tumor biomarkers: thyroglobulin (Tg), calcitonin (Ct), and carcinoembryonic antigen (CEA).
We retrospectively reviewed the sonographic features of all cases. Real-time sonography of thyroids was performed with Acuson Sequoia and 128XP sonographic scanners (Siemens Medical Solutions, Mountain View, CA), equipped with commercially available 7-MHz to 14-MHz linear probes. Color Doppler imaging and power Doppler imaging were performed with the linear array transducers. Each case was evaluated for 16 characteristics of sonography: tumor number, tumor site, tumor size, aspect ratio, calcification pattern, internal architecture, echo texture, echo pattern, margin, halo, posterior echo, shape and structure of neck lymph nodes (LN), intranodular and peripheral blood-flow signals, and vascularity. In each case, ‘tumor number’ was categorized as unifocal or multifocal, and ‘tumor site’ was categorized as left lobe, right lobe, isthmus, or both lobes. ‘Tumor size’ was recorded by taking the maximum value of the three diameters of anteroposterior, transverse, and vertical sections. ‘Aspect ratio’ (the anteroposterior and transverse diameter ratio, A/T) was noted as ≤1 or > 1. ‘Calcification pattern’ was documented in accordance with persistence and size, for instance, null, < 1mm (microcalcification), 1-2mm, or > 2mm. ‘Internal architecture’ was defined as solid (cystic components > 75% of the lesion), predominantly cystic ( > 75%), or solid with cystic elements. The ‘echo texture’ of each lesion was classified as anechoic, hypoechoic, hyperechoic, or isoechoic in comparison with the background thyroid tissue. ‘Echo pattern’ was divided into homogeneous or heterogeneous. ‘Margins’ of lesions were categorized as well-defined when lesions had clear demarcation with normal thyroid surrounding over 50% of a nodule, or ill-defined when > 50% of the nodular border was demarcated unclearly. The presence of a hypoechoic ‘halo’ around each lesion was also recorded as presence (complete) or absence (incomplete). ‘Posterior echo’ was grouped into normal, attenuation, or enhancement. Furthermore, the overall ‘shape of neck lymph node’ was classified as either smooth and round or irregular or enlarged, and ‘structure of neck lymph node’ was classified as clear or unclear. The predominant pattern of blood flow was classified as ‘intranodular blood flow’ (intrinsic to the lesion) and ‘peripheral blood flow’. Blood flow seen on color Doppler within a lesion was defined as ‘intranodular’, while flow surrounding the immediate margins of the lesion was considered ‘peripheral’. These categories were further classified as hypovascular or hypervascular with respect to lateral thyroid tissue. Additionally, ‘vascularity’ was also defined as diffuse, striped, or linear.
Statistical analysis
We selected predictors for the prediction scoring system in three sequential steps (Figure 1). The 46 candidate predictors available in the registry and records were identified from the results of previous epidemiological and etiological studies. These predictors were evaluated against two main criteria: (1) the predictor must be significantly associated with thyroid malignancy risk in univariate analyses (continuous variables with Student’s t test and Mann-Whitney U test, categorical variables with χ2 test, P < 0.10); and (2) the remaining candidate predictors were evaluated in multivariable logistic regression models with the OR and its 95% CI (P < 0.05) [24]. The continuous variables in the initial model were converted into categorical variables and then repeated.
Discrimination and calibration were used to assess the predictive accuracy of the models. Discrimination refers to the model’s ability to distinguish between individuals with and without thyroid malignancy, and was assessed by using the ROC curve and AUC [32-33]. Calibration refers to the agreement between predicted and actual risk, and was calculated with the Hosmer-Lemeshow χ2 test [34]. Well-fitted models show non-significance on the Hosmer-Lemeshow χ2 test, indicating that the modeled and actual prediction are not significantly different, and a perfect ROC test of AUC close to 1 (0.90~1 as ‘excellent’, 0.80~0.90 as ‘good’, 0.70~0.80 as ‘fair’, 0.60~0.70 as ‘poor’, and 0.50~0.60 as ‘fail’) [24], [33], [35].
The TMRS was created by substituting the β coefficients of each variable in the final prediction model with points. The β coefficient of male was used as a reference standard and assigned one point. ROC estimates were used to calculate the actual thyroid malignancy diagnosis per summed score. The accuracy estimates were evaluated by the SEN, SPE, accuracy, PPV, NPV, PLR, and NLR [24],[35].
For external validation, we used a cohort of the remaining 4,785 patients in the database. All of the variables in the prediction model were included in the new logistic regression model to calculate the OR value of each variable and its 95% CI. We then assessed the discrimination and calibration power of the model and its risk scoring system. Additionally, AUCs of model and risk scores in the development and validation cohorts were compared by U test to see whether they are consistent. With the same cutoff value, we calculated the SEN, SPE, accuracy, PPV, NPV, PLR, and NLR of the risk scoring system in the validation cohort.
We employed SPSS 19.0 Statistical Product and Service Solutions Software (release 19.0, SPSS Inc., USA) for Windows to analyze the data. Associations were judged to be significant at the 0.05 level in multivariable analyses.
Author contributions
T.L. collected clinical information, analyzed data and wrote the paper. J.S. performed ultrasound examinations and collected ultrasound information, and J.Z. confirmed the ultrasound results. X.Z. and X.C. collected and processed preoperative blood specimens for clinical chemistry, and postoperative pathological specimens. W.L. collected pathologic diagnosis, and H.Y. confirmed the pathologic diagnosis. Q.C. designed experiments, analyzed data and wrote the paper. Z.L. and Y. S. designed experiments and revised paper. All the authors reviewed the manuscript.
Conflicts of interest
The authors declare that they have no competing financial interests.
Funding
The work was supported by Changzheng Hospital Fund for Young Scholars in Science Start-ups (T.L.) (2015CZQN12) and Shanghai Municipal Commission of Health and Family Planning (T.L.) (201440518).
References
1. Xing M, Haugen BR, Schlumberger M. Progress in molecular-based management of differentiated thyroid cancer. Lancet. 2013; 381: 1058–1069.
2. Howlader N. et al, SEER Cancer Statistics Review (CSR) 1975-2011. National Cancer Institute. (2013) Available at: http://seer.cancer.gov/csr/1975_2011/. (Accessed: April 2014)
3. Torino F, Paragliola RM, Barnabei A, Corsello SM. Medullary thyroid cancer: a promising model for targeted therapy. Curr Mol Med. 2010; 10: 608-625.
4. American Cancer Society, Global Cancer Facts & Figures 3rd Edition. American Cancer Society. (2015) Available at: http://www.cancer.org/research/cancerfactsstatistics/global. (Accessed: 2015).
5. Tuttle RM. et al, NCCN Clinical Practice Guidelines in Oncology. Thyroid carcinoma: Version 2.2014. National Comprehensive Cancer Network. (2014) Available at: http://www.nccn.org (Accessed: 22 September 2014).
6. Sipos JA, Mazzaferri EL. Thyroid cancer epidemiology and prognostic variables. Clin Oncol. (R Coll Radiol). 2010; 22: 395-404.
7. Jemal, A. Bray F, Center MM, Ferlay J, Ward E, Forman D. Global cancer statistics. CA Cancer J Clin. 2011; 61: 69–90.
8. Mazzaferri EL. Management of a solitary thyroid nodule. N Engl J Med. 1993; 328: 553–559.
9. Guth S, Theune U, Aberle J, Galach A, Bamberger CM. Very high prevalence of thyroid nodules detected by high frequency (13 MHz) ultrasound examination. Eur J Clin Invest. 2009; 39: 699–706.
10. Liu, Y. et al. Trend of incidence and mortality on thyroid cancer in China during 2003-2007. Zhonghua Liu Xing Bing Xue Za Zhi. 2012; 33: 1044-1048.
11. Siegel RL, Miller KD, Jemal A. Cancer statistics, 2015. CA Cancer J Clin. 2015; 65: 5-29.
12. Costa V, Esposito R, Ziviello C, Sepe R, Bim LV, Cacciola NA, Decaussin-Petrucci M, Pallante P, Fusco A,Ciccodicola A. New Somatic mutations and WNK1-B4GALNT3 gene fusion in papillary thryoid carcinoma. Oncotarget. 2015; [Epub ahead of print]
13. Davies L, Welch HG. Davies and Welch draw unfounded conclusions about thyroid cancer from epidemiological data-reply. JAMA Otolaryngol Head Neck Surg. 2014; 140: 679.
14. Ahn HS, Kim HJ, Welch HG. Korea’s Thyroid-Cancer “Epidemic”-Screening and Overdiagnosis. N Engl J Med. 2014; 371: 1765-1767.
15. Sherman SI. Thyroid carcinoma. Lancet. 2003; 361: 501-511.
16. Boufraqech M, Patel D, Xiong Y, Kebebew E. Diagnosis of thyroid cancer: state of art. Expert Opin Med Diagn. 2013; 7: 331-342.
17. Lo Gerfo P, Colacchio T, Caushaj F, Weber C, Feind C. Comparison of fine-needle and coarse-needle biopsies in evaluating thyroid nodules. Surgery. 1982; 92: 835-838.
18. Harazono Y, Kho DH, Balan V, Nakajima K, Zhang T, Hogan V, Raz A. Galectin-3 leads to attenuation of apoptosis through Bax heterodimerization in human thyroid carcinoma cells. Oncotarget. 2014; 5: 9992-10001.
19. Poehls JL, Chen H, Sippel RS. Preoperative ultrasonography findings predict the need for repeated surgery in papillary thyroid cancer. Endocr Pract. 2012; 18: 403-409.
20. Hong YR, Yan CX, Mo GQ, Luo ZY, Zhang Y, Wang Y, Huang PT. Conventional US, elastography, and contrast enhanced US features of papillary thyroid microcarcinoma predict central compartment lymph node metastases. Sci Rep. 5, 7748 (2015).
21. McCombe PA, Greer JM, Mackay IR. Sexual dimorphism in autoimmune disease. Curr Mol Med. 2009; 9: 1058-1079.
22. Reis CF, Carneiro AP, Vieira CU, Fujimura PT, Morari EC, Silva SJ, Goulart LR, Ward LS. An antibody-like peptide that recognizes malignancy among thyroid nodules. Cancer Lett. 2013; 335: 306-313.
23. Cooper DS, Doherty GM, Haugen BR, Kloos RT, Lee SL, Mandel SJ, Mazzaferri EL, McIver B, Pacini F, Schlumberger M, Sherman SI, Steward DL, Tuttle RM. Revised American Thyroid Association management guidelines for patients with thyroid nodules and differentiated thyroid cancer. Thyroid. 2009; 19: 1167–1214.
24. Cai QC, Yu ED, Xiao Y, Bai WY, Chen X, He LP, Yang YX, Zhou PH, Jiang XL, Xu HM, Fan H, Ge ZZ, Lv NH, Huang ZG, et al. Derivation and verification of a prediction rule for estimating advanced colorectal neoplasm risk in average-risk Chinese. Am J Epidemiol. 2012; 175: 584-593.
25. Fan J, Upadhye S, Worster A. Understanding receiver operating characteristic (ROC) curves. CJEM. 2006; 8: 19-20.
26. Minna E, Romeo P, De Cecco L, Dugo M, Cassinelli G, Pilotti S, Degl’Innocenti D, Lanzi C, Casalini P, Pierotti MA, Greco A, Borrello MG. miR-199a-3p displays tumor suppressor functions in papillary thyroid carcinoma. Oncotarget. 2014; 5: 2513-2528.
27. Sim MW, Cohen MS. The discovery and development of vandetanib for the treatment of thyroid cancer. Expert Opin Drug Discov. 2014; 9: 105-114.
28. Welch HG. [Ch 8, We look harder for another cancers] Overdiagnosed: Making People Sick in the Pursuit of Health [Welch HG, Schwartz L, Woloshin S. (ed.)] [105-119] (Beacon Press, Boston, 2012).
29. Chuang SC, Hashibe M, Yu GP, Le AD, Cao W, Hurwitz EL, Rao JY, Neugut AI, Zhang ZF.. Radio therapy for primary thyroid cancer as a risk factor for second primary cancers. Cancer lett. 2006; 238: 42-52.
30. Shimura H, Haraguchi K, Hiejima Y, Fukunari N, Fujimoto Y, Katagiri M, Koyanagi N, Kurita T, Miyakawa M, Miyamoto Y, Suzuki N, Suzuki S, Kanbe M. et al. Distinct diagnostic criteria for ultrasonographic examination of papillary thyroid carcinoma: a multicenter study. Thyroid. 2005; 15: 251-258.
31. Domínguez JM, Baudrand R, Cerda J, Campusano C, Fardella C, Arteaga E, Cruz F, Solar A, Arias T, Mosso L. An ultrasound model to discriminate the risk of thyroid carcinoma. Acad Radiol. 2011; 18: 242-245.
32. Park SH, Goo JM, Jo CH. Receiver operating characteristic (ROC) curve: practical review for radiologists. Korean J Radiol. 2004; 5: 11-18.
33. Fawcett Tom. An introduction to ROC analysis. Pattern Recognition Letters. 2006; 27: 861–874.
34. Hosmer DW, Lemeshow S. [Ch 8.1.3, Model-building strategies for multinomial Logistic regression] Applied logistic regression 2nd edition, [Hosmer DW, Lemeshow S. (ed.)] [273-279] (John Willey & Sons, New York, 2000).
35. Exalto LG, Biessels GJ, Karter AJ, Huang ES, Katon WJ, Minkoff JR, Whitmer RA. Risk score for prediction of 10 year dementia risk in individuals with type 2 diabetes: a cohort study. Lancet Diabetes Endocrinol. 2013; 1: 183-190.