
Introduction
Hepatocellular carcinoma (HCC) is the fifth most frequently diagnosed cancer and the third most common cause of cancer-related mortality in the world; therefore, HCC is a serious global health problem [1]. The incidence of HCC has been increasing in recent decades [2]. Despite improvements in HCC diagnosis and treatments, only 30% to 40% of HCC patients undergo curative therapy [3-5]. Intermediate- to advanced-stage HCC tumors are highly aggressive and either respond poorly to common therapies or do not respond at all. Therefore, new therapeutic strategies that are effective and well-tolerated are urgently required.
Targeted therapy, a newly emerging research area, has significantly changed the traditional treatment of cancer, including HCC, over the past 15 years [6-9]. Sorafenib, an oral multikinase inhibitor of the VEGF and PDGF receptors, has been confirmed in clinical trials to be effective and safe in patients with advanced HCC [2, 8, 10, 11]. Although all of these clinical trials were adjusted for advanced-stage tumors, the results were still not promising. Tumor cell stemness has been frequently investigated as an emerging new area of focus. A large number of studies have indicated that cancer stem cells (CSCs), which are present in the original tumor, have the capacity to self-renew and give rise to a variety of differentiated cells [12]. CSCs play key roles in tumorigenesis, recurrence and metastasis. Therefore, inhibiting CSC functions will reduce tumor proliferation and likely cure malignant tumors. Signaling pathways such as the Wnt, Notch, Shh and PI3K/AKT/mTOR pathways play important roles in the regulation of HCC stem cells [13-16]. Thus, identifying factors that block one or more of these signaling pathways might lead to the inhibition of cancer stem-like capabilities.
Transforming acidic coiled-coil protein (TACC) family members are characterized by a highly conserved C-terminal coiled-coil domain and comprise centrosome- and microtubule-associated proteins. To date, TACCs have been considered adapters that interact with the spindle and centrosome apparatus to promote centrosome integrity, microtubule assembly and spindle stability during mitosis [17-21]. In addition to their function in mitosis, TACCs are involved in controlling cell growth, differentiation and transcriptional regulation [19, 20, 22-24]. As a member of the TACC family, TACC3, located on chromosome 4p16.3, also stabilizes and organizes the mitotic spindle to allow for proper chromosomal segregation [25, 26]. Phosphorylation of the TACC3-chTOG complex on Ser-558 by Aurora and integrin-linked kinase (ILK) is the key mechanism involved in maintaining spindle microtubule growth and stability [18, 27-33]. Clathrin heavy chain (CHC) serves as an adaptor protein to recruit phosphorylated TACC3 to the spindle during mitosis [34]. Angelica et al recently discovered an FGFR-TACC fusion protein in a small subset of glioblastoma multiforme (GBM) tumors. The fusion protein, which localizes to mitotic spindle poles, has constitutive kinase activity, induces mitotic and chromosomal segregation defects and triggers aneuploidy [35]. The fusion gene, which has been defined as an oncogene, has also been identified in nasopharyngeal carcinoma, lung adenocarcinoma and bladder cancer [36-38]. TACC3 may also interact with the signal transducer and activator of transcription 5 (STAT5), aryl hydrocarbon receptor nuclear translocator (ARNT) and Friend of GATA-1 (FOG-1) [24, 39, 40], suggesting a potential role in the regulation of gene transcription. TACC3 inhibits Notch signaling by interacting with Notch4/Int3 [22]. TACC3 also promotes ERK and PI3K/AKT signaling, which induces the epithelial-mesenchymal transition (EMT), leading to cervical cancer initiation [41]. Considerable evidence exists supporting the involvement of TACC3 dysregulation in tumorigenesis. However, TACC3 expression varies in different cancers. For example, TACC3 expression is increased in GBM, non-small cell lung cancer (NSCLC), and breast cancer but decreased in ovarian and thyroid cancers [31, 42-45]. To date, the role of TACC3 in HCC has remained elusive. In the present study, we first assessed TACC3 expression in HCC and then elucidated the molecular mechanisms underlying the TACC3-mediated regulation of CSC-like characteristics. Taken together, these data suggest that TACC3 might be a new therapeutic target for HCC.
Results
TACC3 expression was increased in HCC cells and tumor tissues
To investigate TACC3 expression in HCC, TACC3 mRNA and protein levels were analyzed by qRT-PCR assays and western blot analysis in the immortalized liver cell line LO2 and in a panel of HCC cell lines (SK-Hep-1, SMMC-7721, Bel-7402, MHCC-97L, QGY-7703, and Huh7). TACC3 expression was clearly higher in the HCC cell lines than in the immortalized liver cell line LO2 (Figure 3A, 3B). We further examined TACC3 expression in HCC patients. TACC3 protein expression (92.2%, 12/13) was increased in the HCC tumor tissues compared with the non-cancerous samples (Figure 1A). TACC3 mRNA levels (95.2%, 21/23) were also elevated in the tumor tissues compared with the counterpart non-cancerous tissues (Figure 1B). To further examine TACC3 expression in fresh HCC tissues in situ, IHC staining was employed. As shown in Figure 1C, TACC3 protein was expressed predominantly in the plasma membrane of HCC cells in the tumor regions (T), whereas TACC3 was only occasionally expressed in the liver cells of the adjacent non-cancerous tissue (N). Taken together, these data demonstrated that TACC3 expression was increased in HCC tumor tissues.
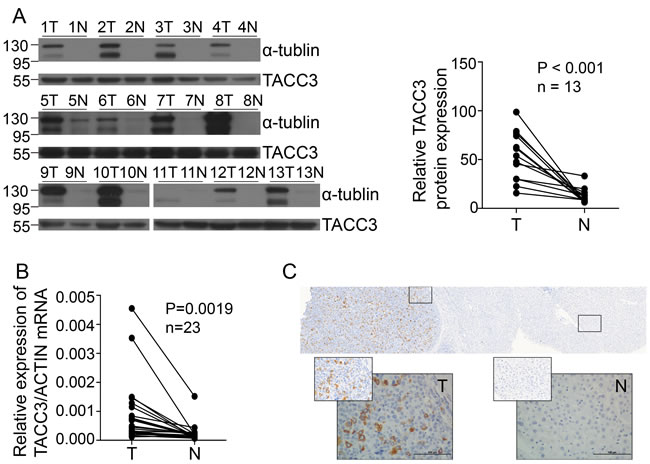
Figure 1: TACC3 expression is increased in HCC patients. A. TACC3 and α-tubulin expression in tumor tissues (T) compared with adjacent matched normal tissues (N), as assessed by western blotting. (n = 13 paired, p < 0.001, paired Wilcoxon signed-rank test). B. TACC3 mRNA levels were analyzed using qRT-PCR assays and normalized to the housekeeping gene β-actin (n = 23 paired, p = 0.0019). N, matched normal tissue; T, tumor tissue. C. TACC3 expression in 237 HCC patients’ tissues analyzed by IHC. The left image shows TACC3 expression in the tumor tissue and adjacent non-tumor tissue. The right two images show the different intensities of expression. All images were magnified 200× and 400×.
High TACC3 levels were correlated with a poor prognosis in HCC patients
To identify the relationship between TACC3 expression and clinicopathological variables, 237 HCC specimens were subjected to IHC staining (Figure 1C). High TACC3 expression was correlated with poorly differentiated HCC tissues (Table 1). The median follow-up period of the entire studied cohort was 49 months, and the median OS was 40 months. The 1-, 3-, and 5-year OS rates were 76.8%, 64.1%, and 59.5%, respectively. According to the ROC curve analysis, the TACC3 expression cut-off value was 0.4 (Figure 2A); a score exceeding 0.4 was defined as high expression. Of the 237 HCC tumors, 74 (31.2%) had high TACC3 expression. Tumor size showed the most significant correlation with TACC3 expression (Table 1, p < 0.001).
According to the Kaplan-Meier analysis, patients with higher TACC3 expression suffered from decreased OS and DFS (p < 0.001, Figure 2B, 2C). Stratification analysis based on the TNM staging revealed that higher TACC3 levels suggested a poorer prognosis in early-intermediate stages (Figure 2D, 2E). No correlation was found between TACC3 expression and stage IV HCC (Supplementary Figure 2). According to the multivariate analysis, TACC3 expression (HR = 2.267, P < 0.001), tumor size (HR = 2.358, p = 0.003), microvascular invasion (HR = 2.527, p < 0.001), and TNM staging (HR = 1.272, P = 0.035) were independent predictors of survival.
Table 1: Correlation between TACC3 and clinicopathological features
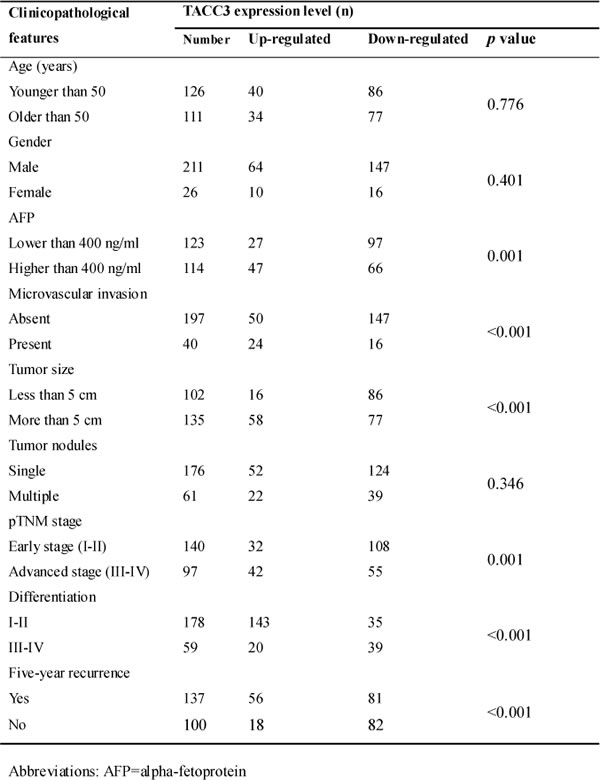
Table 2: Analyses of prognostic factors for overall survival
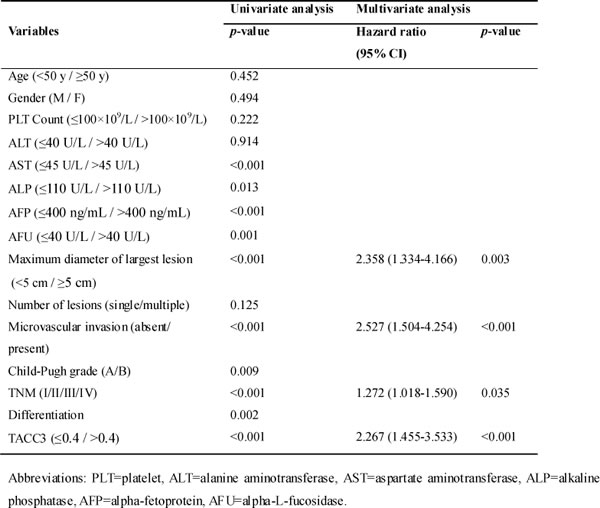
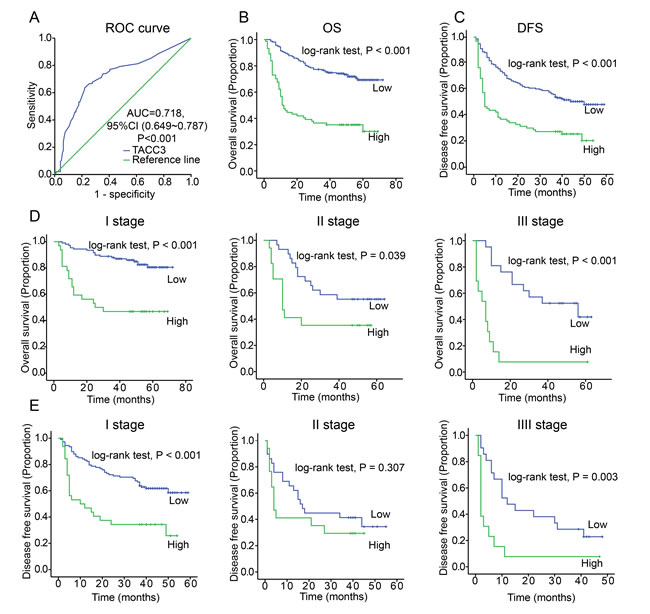
Figure 2: Increased TACC3 expression is correlated with a poor prognosis of HCC. A. The Youden’s index threshold was calculated by ROC curve analysis. (AUC = 0.718, threshold = 0.4). B. TACC3 expression was associated with OS according to Kaplan-Meier analysis. (n = 237, p < 0.001). C. TACC3 expression was associated with DFS according to Kaplan-Meier analysis. (n = 237, p < 0.001). D. Subgroup analysis for OS based on TNM staging (Stage I, p < 0.001; Stage II, p = 0.039; Stage III, p < 0.01) E. Subgroup analysis for DFS based on TNM staging (Stage I, p < 0.001; Stage II, p = 0.307; Stage III, p = 0.003).
TACC3 knockdown suppresses the proliferation and clonogenicity of HCC cells
To explore the potential role of TACC3 in HCC tumorigenesis, TACC3 expression was knocked down in SMMC-7721, SK-Hep-1, Bel-7402 and Huh-7 cells with two distinct siRNA duplexes. Western blotting was used to validate the knockdown efficiency. As depicted in Figure 3C, TACC3 expression was nearly abolished in the siTACC3 transfectants. Viability was assessed at the indicated times with an MTT assay. Compared with the control, the siTACC3 transfectants displayed significantly decreased proliferation (Figure 3C and Supplementary Figure 1). A clonogenicity assay was then performed to evaluate the effect of TACC3 knockdown on the clonogenicity of the HCC cells. Both the size and number of siTACC3 transfectants were dramatically decreased compared with the SiNC cells (Figure 3D and Supplementary Figure 1).
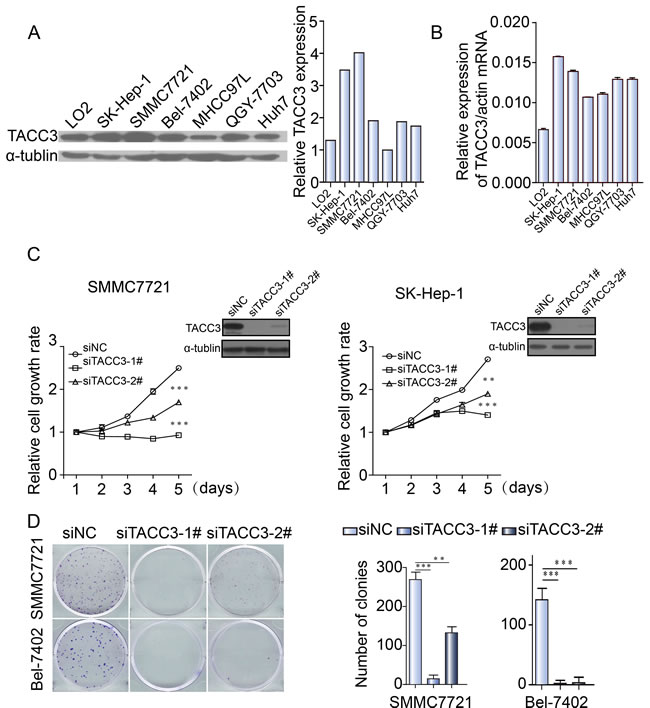
Figure 3: TACC3 knockdown suppresses the proliferation and clonogenicity of HCC cells A. TACC3 protein expression in different HCC cell lines, as assessed by western blotting. B. TACC3 mRNA levels in different HCC cell lines, as assessed by qRT-PCR. C. The effect of TACC3 knockdown with siRNA and NC was verified by western blotting 48 hours after transfection (right top corner), and cell viability was assessed with an MTT assay at the indicated times. D. Colony formation assays of SMMC-7721 and SK-Hep-1 cells infected with NC or TACC3-targeted siRNAs (*p < 0.05, **p < 0.01, ***p < 0.001).
TACC3 knockdown suppressed sphere formation and stem cell markers in vitro
To investigate the effect of TACC3 on stem cell-like capabilities, a sphere formation assay was performed. After transfection with the siRNA duplexes, SMCC-7721 and SK-Hep-1 cells were cultured in specific sphere-forming medium containing EGF and β-FGF for 2 weeks. The numbers and sizes of spheres in the siTACC3-knockdown cells were significantly decreased compared with the NC-transfected cells (Figure 4A). Western blot and qRT-PCR assays were used to assess whether TACC3 down-regulation was associated with changes in stem cell transcription factors (SCTFs). Bmi1, c-Myc and Nanog were decreased concurrently with TACC3 down-regulation (Figure 4B, 4C). SOX2 was undetectable by both qRT-PCR and western blotting. TACC3 is involved in the Wnt/β-catenin and AKT pathways [41], which are involved in the EMT in cervical cancer. TACC3 knockdown suppressed tumor stem cell-like characteristics through the Wnt/β-catenin and PI3K/AKT signaling pathways. We therefore examined whether TACC3 participated in Wnt/β-catenin pathway activation in the HCC cell lines. Compared with the negative control, TACC3 down-regulation led to decreased GSK3β (Ser-9) phosphorylation and β-catenin down-regulation, whereas total GSK3β-levels remained unchanged (Figures 4C and 5). β-catenin/TCF activation leads to the increased expression of downstream target genes such as c-Myc and cyclin D1 [47-50]. Accordingly, TACC3 knockdown led to decreased c-Myc and cyclin D1 expression (Figures 4C and 5). These data suggested that the knockdown of TACC3 suppressed the Wnt/β-catenin signaling pathway, possibly contributing to the inhibition of stem cell processes. Accumulating evidence indicates that GSK3β is a downstream target of the PI3K/AKT signaling pathway [51]. Therefore, we examined whether TACC3 down-regulation inhibited AKT activity. As shown in Figure 5, TACC3 down-regulation reduced AKT phosphorylation at Ser-308, whereas total AKT levels remained stable. These results indicated that TACC3 down-regulation reduced AKT activation. Together, these data suggested that TACC3 down-regulation reduced stem cell-like traits at least in part through inhibition of the PI3K/AKT and Wnt/β-catenin signaling pathways (Figure 5).
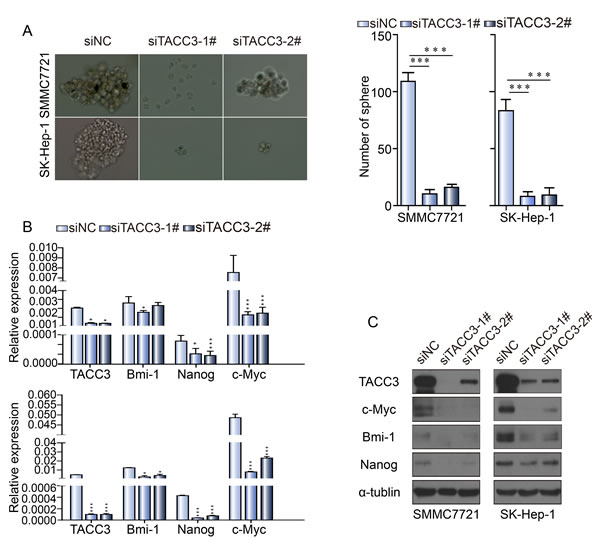
Figure 4: TACC3 knockdown suppresses sphere formation and stem cell marker expression by HCC cells. A. TACC3 knockdown suppressed sphere formation by SMMC-7721 and SK-Hep-1 cells. SMMC-7721 and SK-Hep-1 cells transfected with siRNAs or NC were grown in tumor sphere-forming medium for 7 days. Colonies were photographed at 200× magnification and were counted at 40× magnification. B. The effect of TACC3 knockdown on SCTF expression normalized to β-actin. C. The effect of TACC3 knockdown on stem cell-related protein expression, as assessed by western blotting (*p < 0.05, **p < 0.01, ***p < 0.001).
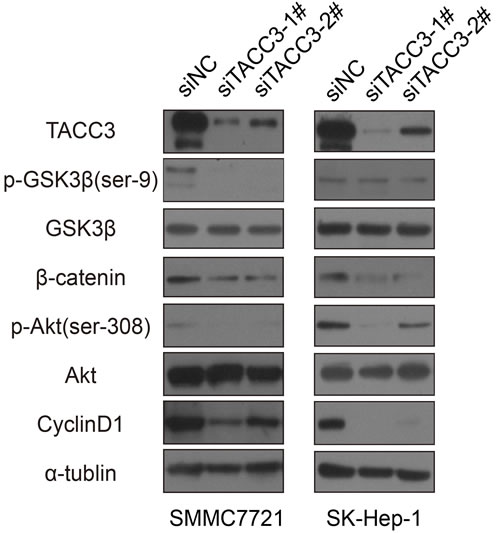
Figure 5: Potential mechanism for the stem cell-suppressing activity of TACC3. The activity of downstream signaling molecules was analyzed by western blotting; α-tubulin was used as a loading control.
The TACC3 protein inhibitor KHS101 suppressed cell proliferation and the stem-like phenotype in vitro
KHS101, a small molecule known for its role in neuronal differentiation, binds to the TACC3 protein. Likely through a functional link between KHS101 and the TACC3-ARNT2 axis, KHS101-mediated interference with TACC3 accelerates neurogenesis and concomitantly suppresses proliferation. However, whether KHS101 suppresses liver CSC-like characteristics is unknown. SMMC-7721 and SK-Hep-1 cells were cultured with different KHS101 concentrations (40 µM and 20 µM, respectively, Figure 6A) to determine the IC50 values. The IC12.5 and IC25 concentrations were then used to test the interference in HCC cell lines. After KHS101 treatment, SMCC-7721 and SK-Hep-1 cells were cultured in specific F12 sphere-forming medium for 1 week. The number and size of spheres were significantly decreased after treatment with KHS101 compared with the control (DMSO) treatment (Figure 6B). As illustrated in Figure 6B, sphere formation was dependent on the KHS101 concentration. qRT-PCR and western blot assays were used to assess whether KHS101 was associated with changes in SCTFs. Bmi1, c-Myc, and Nanog were all decreased in the presence of KHS101 (Figure 6D). Western blot analysis was performed to investigate the mechanism by which KHS101 inhibits sphere formation. Compared with the control (DMSO), KHS101 decreases the expression of p-AKT, p-GSK3β and β-catenin, as well as the expression of the downstream markers c-Myc and cyclin D1 (Figure 6E). Thus, TACC3 may mediate the development of liver CSC-like characteristics through the PI3K/AKT and Wnt/β-catenin signaling pathways.
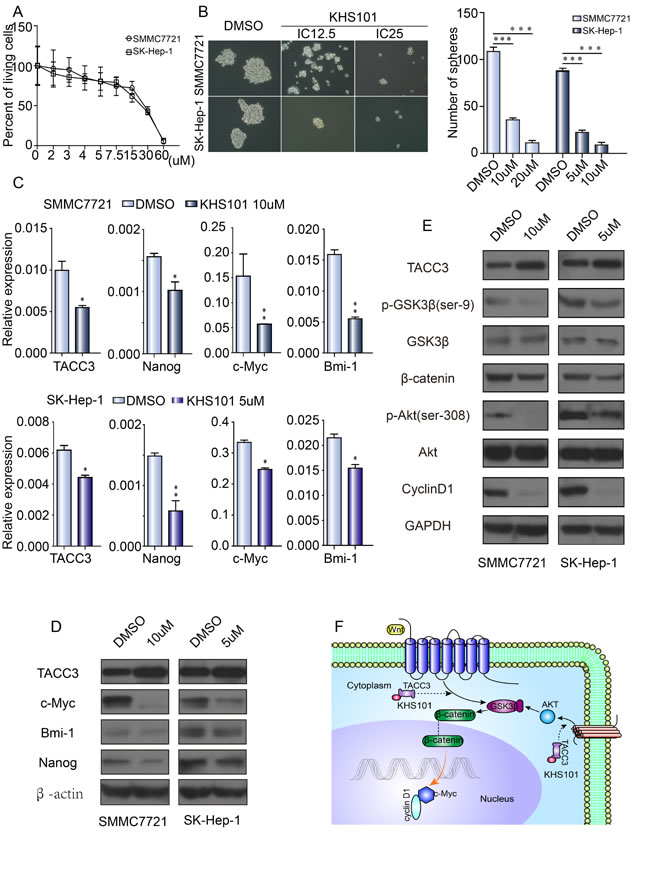
Figure 6: KHS101, a TACC3 inhibitor, suppresses stemness. A. The IC50 of KHS101 in SMMC-7721 (40 µM) and SK-Hep-1 (20 µM) cells. B. KHS101 suppressed sphere formation by HCC cells. SMMC-7721 and SK-Hep-1 cells treated with DMSO or KHS101 were grown in tumor sphere-forming medium for 7 days. Colonies were photographed at 200× magnification and counted at 40× magnification. C. The effect of KHS101 on SCTF expression, normalized to β-actin. D. The effect of KHS101 on stem cell-related protein expression, as determined by western blotting. E. The effect of KHS101 on the expression of Wnt/β-catenin and PI3K/AKT signaling pathway proteins, assayed by western blotting and normalized to GAPDH (*p < 0.05, **p < 0.01, ***p < 0.001). F. Diagram depicting upstream and downstream signals of TACC3 that might contribute to Wnt/β-catenin and PI3K/AKT signaling pathway activation.
Discussion
The clinical complexity, genetic diversity and molecular heterogeneity of HCC make this cancer a worldwide health problem and hamper the progress of therapeutic development. This study explored increased TACC3 expression in HCC and the dynamic interplay between stem cell-like characteristics and signaling pathways to assess whether TACC3 is a novel target for HCC therapy.
As discussed above, TACC3 levels in various cancers are controversial and are correlated with the type of cell, organ or carcinoma [52], and the molecular mechanisms of TACC3 remain elusive. In the present study, we determined that TACC3 might be an oncogene that plays an important role in tumorigenesis, differentiation, amplification and metastasis in HCC. Based on our data, TACC3 expression was increased, as measured by both western blotting and qRT-PCR assays. As assessed by IHC staining, TACC3 expression in HCC specimens was clearly higher than that in non-cancerous tissue (Figure 1C). Furthermore, according to univariate and multivariate analyses, TACC3 was an independent predictor of prognosis because higher TACC3 expression corresponded with a poorer OS and DFS. The subgroup analysis based on TNM staging revealed that TACC3 only accurately predicted the prognosis in early- to intermediate-stage tumors. There are three likely reasons for this phenomenon: (1) stage IV patients accounted for only a small proportion of the total patient population (17/237), which might skew the results; (2) stage IV tumors usually occur with hepatic dysfunction, which may affect the prognosis; and (3) TACC3 levels were absolutely correlated to the stage of carcinoma. Additionally, high TACC3 expression was positively correlated with poor differentiation, microvascular invasion, and, in particular, tumor size. Taken together, our data revealed that TACC3 might serve as an oncogene in HCC. High TACC3 levels predicted a poor prognosis, highlighting the potential use of a TACC3 inhibitor as an HCC therapy.
An interesting phenomenon was observed in the IHC analysis. The distribution of TACC3 expression was sporadic; this protein accumulated at the border of neoplastic cell nests and was sometimes present in normal tissues. TACC3 expression might correlate with the EMT, as suggested by Geun [41]. In addition to the EMT, TACC3 may also affect tumor stem cell-like capabilities. Based on this hypothesis, a sphere formation assay and related experiments were performed. TACC3 down-regulation prominently suppressed CSC phenotypes and critical SCTFs such as Bmi1, c-Myc, and Nanog. The polycomb-group (PcG) gene Bmi1 plays a critical role in the self-renewal of a range of somatic stem cells, including hepatic stem cells [53, 54]. The transcription factor Nanog is essential for ESC self-renewal, protein expression, differentiation and tumorigenesis [55, 56]. Nanog also predicts prognosis and regulates human tumor development [57, 58]. c-Myc is a key factor for stem cell self-renewal and differentiation during tumor development and oncogenic processes; additionally, c-myc regulates cell cycle progression and apoptosis [59, 60]. Notably, the PTEN/PI3K pathway can directly repress c-Myc. Specifically, p53 represses c-Myc transcription by directly binding the c-Myc promoter [61], whereas the downstream PI3K pathway components inhibit c-Myc translation and promote protein degradation [62, 63]. In the present study, both western blot and qRT-PCR assays demonstrated that TACC3 knockdown suppressed stem cell-like markers, indicating that TACC3 may be involved in certain signaling pathways that promote stem cell-like traits.
c-Myc and cyclin D1 are two key downstream targets of the Wnt/β-catenin pathway. The expression of these two markers decreased in conjunction with decreased TACC3 expression, indicating that the Wnt/β-catenin signaling pathway might be the molecular mechanism by which TACC3 promotes stem cell traits. Wnt/β-catenin signaling is a crucial stem cell regulator and plays various important roles in many cancers. Aberrant Wnt/β-catenin signaling leads to a wide range of human pathologies. When the receptors of the Frizzled and LRP families (Lrp5/6) are bound to ligands on the cell surface, the signal is transduced to β-catenin, which is the central player located in cytoplasm. Mutant forms of β-catenin are associated with many cancers, including HCC. β-catenin stability is regulated by the destruction complex, which includes the tumor suppressors adenomatous polyposis coli (APC) and axin. If the receptor is not bound to Wnt, then CKI and GSK3, two kinases residing in the complex, phosphorylate a set of conserved Ser and Thr residues at the amino terminus of β-catenin, thereby recruiting a b-TrCP-containing E3 ubiquitin ligase, which targets β-catenin for proteasomal degradation. If the receptor binds Wnt, GSK3 is phosphorylated, leading to β-catenin accumulation. Activated β-catenin travels into the nucleus, where it activates the N termini of Tcf/Lef family DNA-binding proteins. The c-myc gene has been identified as a direct target of LEF-1/TCF proteins, which are repressed by wild-type APC and activated by β-catenin in colon cancer cells [48]. Cyclin D1, which is regulated by β-catenin, contributes to tumor progression. In this study, knocking down TACC3 increased p-GSK3β levels, which then suppressed β-catenin activation, leading to reduced c-Myc and cyclin D1 levels. Finally, stem cell-like capabilities were decreased. β-catenin activation by the PI3K/AKT pathway has also been reported in HepG2 and HeLa cells. We obtained consistent results by verifying the expression of AKT. Taken together, these results indicate that TACC3 can affect stem cell-like traits, partially by affecting the Wnt/β-catenin and PI3K/AKT signaling pathways.
The small molecule KHS101 was recently found to bind to the TACC3 protein. By interacting with the TACC3-ARNT2 axis, KHS101 inhibited cell cycle progression in a similar manner as TACC3 siRNA. However, the molecular mechanisms downstream of TACC3 have not been determined. In this study, KHS101 significantly suppressed the proliferation and stem cell-like traits, as well as the expression of stem cell markers, of both SMMC-7721 and SK-Hep-1 cells via the Wnt/β-catenin and PI3K/AKT pathways. Notably, TACC3 expression was slightly increased. Mechanistically, KHS101 likely binds to TACC3 in the cytoplasm to increase TACC3 protein synthesis. Taken together, these results indicate that TACC3 might be a molecular target for clinical HCC therapy.
In summary, we investigated the expression and potential role, as well as the underlying molecular mechanisms, of TACC3 in HCC. Our data revealed that TACC3 up-regulation was correlated with a poor prognosis and highlighted the potential use of a TACC3 inhibitor in clinical HCC therapy.
Materials and methods
Patients and tissue specimens
Paraffin-embedded HCC specimens (n = 237) and fresh frozen HCC tissues (n = 23) from cases that were histologically confirmed and did not undergo neo-adjuvant treatment were obtained from the Cancer Center of Sun Yat-sen University in Guangzhou. Written informed consent was obtained from each patient, and the study was approved by the Institute Research Ethics Committee at the Cancer Center.
Cell culture
The HCC cell lines (LO2, SK-Hep-1, SMMC-7721, Bel-7402, MHCC-97L, QGY-7703, and Huh7) were cultured in Dulbecco’s modified Eagle’s medium (DMEM; Gibco, Carlsbad, CA, USA) supplemented with 10% fetal bovine serum (FBS; Gibco) in a humidified 5% CO2 incubator at 37°C.
Quantitative RT-PCR analysis
RNA was extracted from fresh tissue specimens and HCC cell lines using TRIzol reagent (Invitrogen, Grand Island, NY, USA). Complementary DNA (cDNA) was synthesized using a reverse transcriptase kit (Invitrogen). Primers for the quantitative RT-PCR (qRT-PCR) assays are presented in Supplementary Table 1. Three independent experiments were performed to verify the quantitation of the data.
Western blot analysis
Western blotting was performed as previously described [46]. The primary and conjugated secondary antibodies used are listed in Supplementary Table 2.
Immunohistochemical analysis
The paraffin-embedded HCC samples were cut into 4-µm-thick sections. Immunohistochemical staining was performed as previously described [46]. Briefly, after deparaffinizing and rehydrating the sections and blocking endogenous peroxidase activity, the sections were boiled in a citrate antigen retrieval solution (pH = 6.0) for 2 min in an electric pressure cooker for antigen retrieval. The sections were then incubated overnight with a rabbit polyclonal anti-TACC3 antibody (diluted 1:800, Abcam, USA) at 4ºC, followed by incubation with a secondary antibody for 30 min at 37ºC. Finally, the sections were dehydrated and mounted.
Each section was evaluated with an automated image analyzer by a pathologist who was blinded to the clinical status of the patients. TACC3 expression was evaluated according to the intensity and extent of staining. The staining intensity was scored using the following system: 0, negative staining; 1, weak staining; 2, moderate staining; and 3, strong staining. The extent of staining was scored as the percentage of positive cells. A final immunoreactivity score (IRS) was given for each sample, defined as the intensity score multiplied by the extent score.
siRNA transfection
siRNA oligo-ribonucleotides were purchased from RiboBio (RiboBio, Guangzhou, China); detailed information is presented in Supplementary Table 3. The negative control (NC) RNA duplex for the siRNA was not homologous to any human genome sequences. SMMC-7721 and SK-Hep-1 cells (2×10⁵) were seeded into 6-well plates, incubated for 24 h and then transfected with 12.5 nM of the RNA duplex and 5 μL of Lipofectamine RNAiMAX (Invitrogen, Grand Island, NY, USA) according to the manufacturer’s instructions. The cells were harvested for further experiments after 48 or 72 h.
MTT assay
An MTT [3-(4,5-dimethyl-2-thiazolyl)-2,5-diphenyl-2-H-tetrazolium] assay was used to measure cell viability. After transfection with siNC, siTACC3-1#, or siTACC3-2# for 48 h, SMMC-7721 and SK-Hep-1 cells (3,000 cells/well) were plated in sextuplicate in a 96-well plate and cultured with DMEM containing 10% FBS. At the indicated time points, 20 μL of 5 mg/mL MTT was added to each well, and the cells were incubated for 4 h at 37°C. Then, 150 μL of 100% dimethylsulfoxide (DMSO) was used to dissolve the precipitates. The absorbance was measured at 490 nm with a SpectraMax M5 (Molecular Devices, Sunnyvale, USA) plate reader.
Colony formation assay
Forty-eight hours after transfection with siNC, siTACC3-1#, or siTACC3-2#, SMCC-7721, Bel-7402 (each at 500 cells/well) and SK-Hep-1 (2,000 cells/well) cells were plated in triplicate in 6-well plates and cultured for 10 days. After fixation with methanol for 15 min, the colonies were stained with 0.5% crystal violet in 20% methanol for 15 min and counted. Data were acquired from three independent experiments.
Sphere formation assay
After transfection with either siNC, siTACC3-1#, or siTACC3-2# for 48 h and treatment with various concentrations of KHS101 (10 μM, 20 μM) for 48 h, SMCC-7721 and SK-Hep-1 cells (500 cells/well) were plated in triplicate in 6-well plates with tumor sphere medium containing serum-free DMEM/F-12, 10 ng/mL human recombinant bFGF and 10 ng/mL EGF for 7 days. Colonies were photographed at 200× magnification and were counted at 40× magnification
Statistical analysis
A two-tailed Mann-Whitney U test was used to analyze the differences between groups. Receiver operating characteristic (ROC) curve analysis was used to identify the cut-off value for TACC3. A chi-squared test was used to analyze the relationship between TACC3 expression and clinicopathological characteristics. The Kaplan-Meier method was used to calculate the OS and DFS and to conduct sub-analyses according to the TNM staging, and comparisons were performed using the log-rank test. The prognostic variables used in predicting the OS were assessed by multivariate Cox proportional hazards regression analysis. Variables that were significant in the univariate analysis were subsequently tested with the multivariate Cox proportional hazard model. All of the statistical tests were two-sided, and differences with p < 0.05 was considered statistically significant. All of the statistical tests were performed using SPSS 19.0 statistical software (SPSS Company, Chicago, Illinois, USA).
Acknowledgments and Funding
This study was supported by grants from the National Natural Science Foundation of China (81230045, 91440106, 81402252, 81371866), the Guangdong Academy of Medical Science and Technology Research Foundation (No. B2012137), and the Health Medical Collaborative Innovation Program of Guangzhou (201400000001-3).
conflictS of interest
There is no conflict of interest.
References
1. Kamangar F, Dores GM and Anderson WF. Patterns of cancer incidence, mortality, and prevalence across five continents: defining priorities to reduce cancer disparities in different geographic regions of the world. Journal of clinical oncology : official journal of the American Society of Clinical Oncology. 2006; 24:2137-2150.
2. Adnane L, Trail PA, Taylor I and Wilhelm SM. Sorafenib (BAY 43-9006, Nexavar), a dual-action inhibitor that targets RAF/MEK/ERK pathway in tumor cells and tyrosine kinases VEGFR/PDGFR in tumor vasculature. Methods in enzymology. 2006; 407:597-612.
3. Forner A, Llovet JM and Bruix J. Chemoembolization for intermediate HCC: is there proof of survival benefit? Journal of hepatology. 2012; 56:984-986.
4. Armengol C, Boix L, Bachs O, Sole M, Fuster J, Sala M, Llovet JM, Rodes J and Bruix J. p27(Kip1) is an independent predictor of recurrence after surgical resection in patients with small hepatocellular carcinoma. Journal of hepatology. 2003; 38:591-597.
5. Du S, Li Y, Mao Y, Sang X, Lu X, Wang W, Zhang Q, Xue H, Yang X, Li S, Chi T, Zhong S and Huang J. Diagnosis and treatment of hepatic angiomyolipoma. Hepatobiliary surgery and nutrition. 2012; 1:19-24.
6. Keefe DM and Bateman EH. Tumor control versus adverse events with targeted anticancer therapies. Nature reviews Clinical oncology. 2012; 9:98-109.
7. Keefe D and Stringer A. The potential successes and challenges of targeted anticancer therapies. Current opinion in supportive and palliative care. 2010; 4:16-18.
8. Llovet JM, Ricci S, Mazzaferro V, Hilgard P, Gane E, Blanc JF, de Oliveira AC, Santoro A, Raoul JL, Forner A, Schwartz M, Porta C, Zeuzem S, Bolondi L, Greten TF, Galle PR, et al. Sorafenib in advanced hepatocellular carcinoma. The New England journal of medicine. 2008; 359:378-390.
9. He VJ. Professor Pierce Chow: neo-adjuvant and adjuvant therapy for hepatocellular carcinoma-current evidence. Hepatobiliary surgery and nutrition. 2013; 2:239-241.
10. Wilhelm SM, Carter C, Tang L, Wilkie D, McNabola A, Rong H, Chen C, Zhang X, Vincent P, McHugh M, Cao Y, Shujath J, Gawlak S, Eveleigh D, Rowley B, Liu L, et al. BAY 43-9006 exhibits broad spectrum oral antitumor activity and targets the RAF/MEK/ERK pathway and receptor tyrosine kinases involved in tumor progression and angiogenesis. Cancer research. 2004; 64:7099-7109.
11. Cheng AL, Kang YK, Chen Z, Tsao CJ, Qin S, Kim JS, Luo R, Feng J, Ye S, Yang TS, Xu J, Sun Y, Liang H, Liu J, Wang J, Tak WY, et al. Efficacy and safety of sorafenib in patients in the Asia-Pacific region with advanced hepatocellular carcinoma: a phase III randomised, double-blind, placebo-controlled trial. The Lancet Oncology. 2009; 10:25-34.
12. Vermeulen L, Sprick MR, Kemper K, Stassi G and Medema JP. Cancer stem cells--old concepts, new insights. Cell death and differentiation. 2008; 15:947-958.
13. Clevers H, Loh KM and Nusse R. Stem cell signaling. An integral program for tissue renewal and regeneration: Wnt signaling and stem cell control. Science. 2014; 346:1248012.
14. Koch U, Lehal R and Radtke F. Stem cells living with a Notch. Development. 2013; 140:689-704.
15. Androutsellis-Theotokis A, Leker RR, Soldner F, Hoeppner DJ, Ravin R, Poser SW, Rueger MA, Bae SK, Kittappa R and McKay RD. Notch signalling regulates stem cell numbers in vitro and in vivo. Nature. 2006; 442:823-826.
16. Bleau AM, Hambardzumyan D, Ozawa T, Fomchenko EI, Huse JT, Brennan CW and Holland EC. PTEN/PI3K/Akt pathway regulates the side population phenotype and ABCG2 activity in glioma tumor stem-like cells. Cell stem cell. 2009; 4:226-235.
17. Schuendeln MM, Piekorz RP, Wichmann C, Lee Y, McKinnon PJ, Boyd K, Takahashi Y and Ihle JN. The centrosomal, putative tumor suppressor protein TACC2 is dispensable for normal development, and deficiency does not lead to cancer. Molecular and cellular biology. 2004; 24:6403-6409.
18. Gergely F. Centrosomal TACCtics. BioEssays : news and reviews in molecular, cellular and developmental biology. 2002; 24:915-925.
19. Schneider L, Essmann F, Kletke A, Rio P, Hanenberg H, Wetzel W, Schulze-Osthoff K, Nurnberg B and Piekorz RP. The transforming acidic coiled coil 3 protein is essential for spindle-dependent chromosome alignment and mitotic survival. The Journal of biological chemistry. 2007; 282:29273-29283.
20. Sadek CM, Pelto-Huikko M, Tujague M, Steffensen KR, Wennerholm M and Gustafsson JA. TACC3 expression is tightly regulated during early differentiation. Gene expression patterns : GEP. 2003; 3:203-211.
21. Yao R, Natsume Y and Noda T. TACC3 is required for the proper mitosis of sclerotome mesenchymal cells during formation of the axial skeleton. Cancer science. 2007; 98:555-562.
22. Bargo S, Raafat A, McCurdy D, Amirjazil I, Shu Y, Traicoff J, Plant J, Vonderhaar BK and Callahan R. Transforming acidic coiled-coil protein-3 (Tacc3) acts as a negative regulator of Notch signaling through binding to CDC10/Ankyrin repeats. Biochemical and biophysical research communications. 2010; 400:606-612.
23. Angrisano T, Lembo F, Pero R, Natale F, Fusco A, Avvedimento VE, Bruni CB and Chiariotti L. TACC3 mediates the association of MBD2 with histone acetyltransferases and relieves transcriptional repression of methylated promoters. Nucleic acids research. 2006; 34:364-372.
24. Garriga-Canut M and Orkin SH. Transforming acidic coiled-coil protein 3 (TACC3) controls friend of GATA-1 (FOG-1) subcellular localization and regulates the association between GATA-1 and FOG-1 during hematopoiesis. The Journal of biological chemistry. 2004; 279:23597-23605.
25. Hood FE and Royle SJ. Pulling it together: The mitotic function of TACC3. Bioarchitecture. 2011; 1:105-109.
26. Kiemeney LA, Sulem P, Besenbacher S, Vermeulen SH, Sigurdsson A, Thorleifsson G, Gudbjartsson DF, Stacey SN, Gudmundsson J, Zanon C, Kostic J, Masson G, Bjarnason H, Palsson ST, Skarphedinsson OB, Gudjonsson SA, et al. A sequence variant at 4p16.3 confers susceptibility to urinary bladder cancer. Nature genetics. 2010; 42:415-419.
27. Gergely F, Karlsson C, Still I, Cowell J, Kilmartin J and Raff JW. The TACC domain identifies a family of centrosomal proteins that can interact with microtubules. Proceedings of the National Academy of Sciences of the United States of America. 2000; 97:14352-14357.
28. Pascreau G, Delcros JG, Cremet JY, Prigent C and Arlot-Bonnemains Y. Phosphorylation of maskin by Aurora-A participates in the control of sequential protein synthesis during Xenopus laevis oocyte maturation. The Journal of biological chemistry. 2005; 280:13415-13423.
29. Conte N, Delaval B, Ginestier C, Ferrand A, Isnardon D, Larroque C, Prigent C, Seraphin B, Jacquemier J and Birnbaum D. TACC1-chTOG-Aurora A protein complex in breast cancer. Oncogene. 2003; 22:8102-8116.
30. Mori D, Yano Y, Toyo-oka K, Yoshida N, Yamada M, Muramatsu M, Zhang D, Saya H, Toyoshima YY, Kinoshita K, Wynshaw-Boris A and Hirotsune S. NDEL1 phosphorylation by Aurora-A kinase is essential for centrosomal maturation, separation, and TACC3 recruitment. Molecular and cellular biology. 2007; 27:352-367.
31. Ulisse S, Baldini E, Toller M, Delcros JG, Gueho A, Curcio F, De Antoni E, Giacomelli L, Ambesi-Impiombato FS, Bocchini S, D’Armiento M and Arlot-Bonnemains Y. Transforming acidic coiled-coil 3 and Aurora-A interact in human thyrocytes and their expression is deregulated in thyroid cancer tissues. Endocrine-related cancer. 2007; 14:827-837.
32. Fielding AB, Lim S, Montgomery K, Dobreva I and Dedhar S. A critical role of integrin-linked kinase, ch-TOG and TACC3 in centrosome clustering in cancer cells. Oncogene. 2011; 30:521-534.
33. LeRoy PJ, Hunter JJ, Hoar KM, Burke KE, Shinde V, Ruan J, Bowman D, Galvin K and Ecsedy JA. Localization of human TACC3 to mitotic spindles is mediated by phosphorylation on Ser558 by Aurora A: a novel pharmacodynamic method for measuring Aurora A activity. Cancer research. 2007; 67:5362-5370.
34. Lin CH, Hu CK and Shih HM. Clathrin heavy chain mediates TACC3 targeting to mitotic spindles to ensure spindle stability. The Journal of cell biology. 2010; 189:1097-1105.
35. Singh D, Chan JM, Zoppoli P, Niola F, Sullivan R, Castano A, Liu EM, Reichel J, Porrati P, Pellegatta S, Qiu K, Gao Z, Ceccarelli M, Riccardi R, Brat DJ, Guha A, et al. Transforming fusions of FGFR and TACC genes in human glioblastoma. Science. 2012; 337:1231-1235.
36. Yuan L, Liu ZH, Lin ZR, Xu LH, Zhong Q and Zeng MS. Recurrent FGFR3-TACC3 fusion gene in nasopharyngeal carcinoma. Cancer biology & therapy. 2014; 15:1613-1621.
37. Capelletti M, Dodge ME, Ercan D, Hammerman PS, Park SI, Kim J, Sasaki H, Jablons DM, Lipson D, Young L, Stephens PJ, Miller VA, Lindeman NI, Munir KJ, Richards WG and Janne PA. Identification of recurrent FGFR3-TACC3 fusion oncogenes from lung adenocarcinoma. Clinical cancer research : an official journal of the American Association for Cancer Research. 2014; 20:6551-6558.
38. Cancer Genome Atlas Research N. Comprehensive molecular characterization of urothelial bladder carcinoma. Nature. 2014; 507:315-322.
39. Piekorz RP, Hoffmeyer A, Duntsch CD, McKay C, Nakajima H, Sexl V, Snyder L, Rehg J and Ihle JN. The centrosomal protein TACC3 is essential for hematopoietic stem cell function and genetically interfaces with p53-regulated apoptosis. The EMBO journal. 2002; 21:653-664.
40. Sadek CM, Jalaguier S, Feeney EP, Aitola M, Damdimopoulos AE, Pelto-Huikko M and Gustafsson JA. Isolation and characterization of AINT: a novel ARNT interacting protein expressed during murine embryonic development. Mechanisms of development. 2000; 97:13-26.
41. Ha GH, Park JS and Breuer EK. TACC3 promotes epithelial-mesenchymal transition (EMT) through the activation of PI3K/Akt and ERK signaling pathways. Cancer letters. 2013; 332:63-73.
42. Duncan CG, Killela PJ, Payne CA, Lampson B, Chen WC, Liu J, Solomon D, Waldman T, Towers AJ, Gregory SG, McDonald KL, McLendon RE, Bigner DD and Yan H. Integrated genomic analyses identify ERRFI1 and TACC3 as glioblastoma-targeted genes. Oncotarget. 2010; 1:265-277.
43. Jung CK, Jung JH, Park GS, Lee A, Kang CS and Lee KY. Expression of transforming acidic coiled-coil containing protein 3 is a novel independent prognostic marker in non-small cell lung cancer. Pathology international. 2006; 56:503-509.
44. Ma XJ, Salunga R, Tuggle JT, Gaudet J, Enright E, McQuary P, Payette T, Pistone M, Stecker K, Zhang BM, Zhou YX, Varnholt H, Smith B, Gadd M, Chatfield E, Kessler J, et al. Gene expression profiles of human breast cancer progression. Proceedings of the National Academy of Sciences of the United States of America. 2003; 100:5974-5979.
45. Lauffart B, Vaughan MM, Eddy R, Chervinsky D, DiCioccio RA, Black JD and Still IH. Aberrations of TACC1 and TACC3 are associated with ovarian cancer. BMC women’s health. 2005; 5:8.
46. Zhang JP, Zhang H, Wang HB, Li YX, Liu GH, Xing S, Li MZ and Zeng MS. Down-regulation of Sp1 suppresses cell proliferation, clonogenicity and the expressions of stem cell markers in nasopharyngeal carcinoma. Journal of translational medicine. 2014; 12:222.
47. Michaelson JS and Leder P. beta-catenin is a downstream effector of Wnt-mediated tumorigenesis in the mammary gland. Oncogene. 2001; 20:5093-5099.
48. He TC, Sparks AB, Rago C, Hermeking H, Zawel L, da Costa LT, Morin PJ, Vogelstein B and Kinzler KW. Identification of c-MYC as a target of the APC pathway. Science. 1998; 281:1509-1512.
49. Shtutman M, Zhurinsky J, Simcha I, Albanese C, D’Amico M, Pestell R and Ben-Ze’ev A. The cyclin D1 gene is a target of the beta-catenin/LEF-1 pathway. Proceedings of the National Academy of Sciences of the United States of America. 1999; 96:5522-5527.
50. Tetsu O and McCormick F. Beta-catenin regulates expression of cyclin D1 in colon carcinoma cells. Nature. 1999; 398:422-426.
51. Cross DA, Alessi DR, Cohen P, Andjelkovich M and Hemmings BA. Inhibition of glycogen synthase kinase-3 by insulin mediated by protein kinase B. Nature. 1995; 378:785-789.
52. Ha GH, Kim JL and Breuer EK. TACC3 is essential for EGF-mediated EMT in cervical cancer. PloS one. 2013; 8:e70353.
53. Chiba T, Zheng YW, Kita K, Yokosuka O, Saisho H, Onodera M, Miyoshi H, Nakano M, Zen Y, Nakanuma Y, Nakauchi H, Iwama A and Taniguchi H. Enhanced self-renewal capability in hepatic stem/progenitor cells drives cancer initiation. Gastroenterology. 2007; 133:937-950.
54. Iwama A, Oguro H, Negishi M, Kato Y, Morita Y, Tsukui H, Ema H, Kamijo T, Katoh-Fukui Y, Koseki H, van Lohuizen M and Nakauchi H. Enhanced self-renewal of hematopoietic stem cells mediated by the polycomb gene product Bmi-1. Immunity. 2004; 21:843-851.
55. Boyer LA, Lee TI, Cole MF, Johnstone SE, Levine SS, Zucker JP, Guenther MG, Kumar RM, Murray HL, Jenner RG, Gifford DK, Melton DA, Jaenisch R and Young RA. Core transcriptional regulatory circuitry in human embryonic stem cells. Cell. 2005; 122:947-956.
56. Wang J, Rao S, Chu J, Shen X, Levasseur DN, Theunissen TW and Orkin SH. A protein interaction network for pluripotency of embryonic stem cells. Nature. 2006; 444:364-368.
57. Liedtke S, Enczmann J, Waclawczyk S, Wernet P and Kogler G. Oct4 and its pseudogenes confuse stem cell research. Cell stem cell. 2007; 1:364-366.
58. Cantz T, Key G, Bleidissel M, Gentile L, Han DW, Brenne A and Scholer HR. Absence of OCT4 expression in somatic tumor cell lines. Stem cells. 2008; 26692-697.
59. Patel JH, Loboda AP, Showe MK, Showe LC and McMahon SB. Analysis of genomic targets reveals complex functions of MYC. Nature reviews Cancer. 2004; 4:562-568.
60. Takahashi K and Yamanaka S. Induction of pluripotent stem cells from mouse embryonic and adult fibroblast cultures by defined factors. Cell. 2006; 126:663-676.
61. Ho JS, Ma W, Mao DY and Benchimol S. p53-Dependent transcriptional repression of c-myc is required for G1 cell cycle arrest. Molecular and cellular biology. 2005; 25:7423-7431.
62. Gera JF, Mellinghoff IK, Shi Y, Rettig MB, Tran C, Hsu JH, Sawyers CL and Lichtenstein AK. AKT activity determines sensitivity to mammalian target of rapamycin (mTOR) inhibitors by regulating cyclin D1 and c-myc expression. The Journal of biological chemistry. 2004; 279:2737-2746.
63. Sears R, Nuckolls F, Haura E, Taya Y, Tamai K and Nevins JR. Multiple Ras-dependent phosphorylation pathways regulate Myc protein stability. Genes & development. 2000; 14:2501-2514.