
INTRODUCTION
The BimC subfamily of kinesin-1 (bmk-1) gene belongs to a large super family of motor proteins that participate in various critical biological processes, including mitosis and intracellular transport of vesicles and organelles [1]. Kinesin consists of a long coiled-coil stalk with a cargo binding tail at one end, and a globular tail domain at the other end. The highly conserved motor domain, 320 residues in size, contains both microtubule and nucleotide binding sites. Kinesin proteins are localized to centrosomes, spindle microtubules, and the spindle midzone, and act during the early stages of mitosis to facilitate centrosome separation and bipolar spindle assembly. These processes are essential for accurate chromosome segregation and progress through the cell cycle [2]. In C. elegans, bmk-1 has also been reported to serve a novel function as a “brake” that slows down the rate of anaphase spindle-pole separation [3–5]. The bmk-1 homolog in Drosophila contributes to a range of functions in mitosis, all of which are consistent with it exerting outward forces on spindle poles by sliding microtubules relative to a static spindle matrix, or by crosslinking and sliding apart adjacent pairs of antiparallel interpolar microtubules [6].
KIF11, the mouse and human equivalent of the C. elegans bmk-1, is one out of 14 kinesin subfamilies which are classified by the phylogenetic analysis for the motor domain. They normally play two major functions in eukaryotic cells, since they participate in all stages of cell division, as well as in intracellular vesical and organelle transport [7–10]. KIF11 normally functions as a mitotic cell cycle and checkpoint regulator [11]. Timely and accurate assembly of the mitotic spindle is critical for the faithful segregation of chromosomes, and centrosome separation is a key step in this process. Premature separation of centrosomes decreases the requirement for KIF11 in spindle assembly, accelerates mitosis, and decreases the rate of chromosome mis-segregation [12]. Tao and colleagues reported that induction of apoptosis in cells treated with a kinesin protein inhibitor (KSP-I) occurs after long-term mitotic arrest [13]. In their studies, KSP-IA, a dihydropyrrole small molecule, arrests cells in mitosis and induces apoptosis by a caspase-dependent pathway [14]. Moreover, KSP-IA was able to induce apoptotic cell death in a p53-independent manner, suggesting that KSP inhibitors could be active in p53-deficient tumors [15]. However, neither bmk-1 nor KIF11 has ever been linked to aging or to lifespan in either mammals or lower organisms. In studies where we modulated expression of bmk-1 in C. elegans, we found evidence indicating that bmk-1 may play an important role in lifespan determination, and that bmk-1 may be acting via hsp-16 for this effect.
RESULTS
Bmk-1/KIF11 is an evolutionarily conserved gene, and the expression of bmk-1/KIF11 declines with mammalian tissue aging
To understand the evolutionary conservation of the bmk-1 gene, we examined the homology of bmk-1 protein sequences among various species using the NCBI RefSeq database (http://www.ncbi.nlm.nih.gov/refseq/). We then performed a phylogenetic analysis using EMBL-EBI Clustal Omega [16] to assess the protein sequence alignment of bmk-1 and its homologs. Bmk-1, similar to pch-2 [17], is an evolutionarily conserved gene with a Myosin and Kinesin motor domain, which belongs to the P-loop_NTPase family and is found across species including yeast (S. cerevisiae), worm (C. elegans), fly (D. melanogaster), zebrafish (D. rerio), rodent (R. novegicus, M. musculus) and human (H. sapiens) (Figure 1a & Supplementary Table S1). As a mitotic cell cycle and checkpoint regulator, bmk-1 is critical for the faithful segregation of chromosomes. This requires an evolutionarily conserved function for bmk-1 in both recombination and in the formation of more complex chromosome structures [18]. Hence bmk-1 provides a basic function across the animal kingdom.
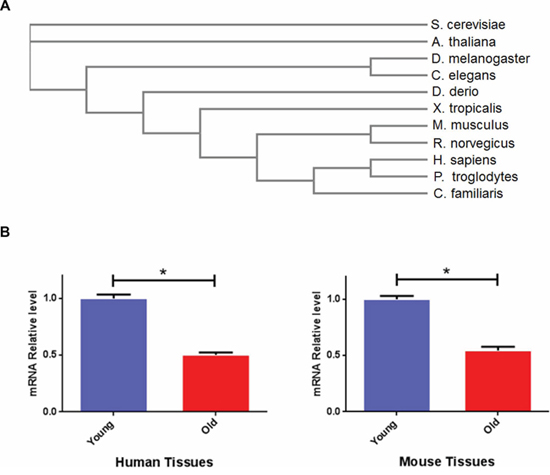
Figure 1: Bmk-1 is an evolutionarily conserved gene and its expression declines with tissue aging across species. A. Sequences alignment of bmk-1 protein across species ranging from yeast to human. B. KIF11 mRNA expression changes with age in human and mouse. Y-axis represents the relative expression level of KIF11 was normalized to ß-actin, and n > 3 for each age group. * indicates p < 0.05.
To determine the pattern of expression of bmk-1/KIF11 across species and as a function of age, we examined gonadal and brain tissues from mouse and human samples. We measured expression levels of KIF11 mRNA by affymetrix array analysis in murine and human specimens as described previously10. We quantified gene expression in young subjects: 3-month old mice (N = 5) from two aging colonies, C57B/6 and DBA2, as well as in 18–25 year-old humans (male and female, N = 8). We also examined aged subjects: 22-month old for mice from two aging colonies (N = 5 for each colony), and humans >60 years old (N = 10). We found that the expression of KIF11 declines significantly with physiological aging in gonadal and brain tissues of both human and mouse (Figure 1B). This was judged by both fold change in mRNA expression, as well as by p values (p < 0.01). This observation suggests an evolutionarily conserved loss of expression of this bmk-1 homolog with tissue aging across mammalian species. Based upon these observations, we asked whether KIF11 plays a role in longevity. Given that lifespan in C. elegans is only 3–4 weeks, as opposed to approximately 2–3 years in mice [19–20], we elected to examine the impact of the bmk-1 gene expression on lifespan in C. elegans.
Expression of bmk-1 regulates lifespan of C. elegans
We first generated bmk-1 over-expressing C. elegans lines that co-expressed green fluorescent protein (GFP) by a microinjection method (Supplementary Figure S1), and studied the functional impact of bmk-1 on worm longevity. To identify over-expressing bmk-1 lines, we selected those animals co-expressing GFP by direct visualization. In GFP-expressing lines, we also measured the expression levels of bmk-1 using quantitative reverse transcription polymerase reaction (qRT-PCR). We distinguished between the expression of endogenous and exogenous bmk-1 by using an expression vector-specific primer and a bmk-1-specific primer (Supplementary Figure S2). In GFP-positive over-expressing lines, the level of exogenous bmk-1 expression was ten times higher than the level of endogenous bmk-1 in the wild-type (WT, GFP-expressing) controls (Figure 2A). After confirming over-expression of bmk-1 in worm lines, we then subjected Bmk-1 over-expressing worms and WT worms to lifespan measurement 13. The median lifespans of WT and bmk-1 over-expressers were 18 days and 22 days, respectively, with maximum lifespans of 28 days and 34 days, respectively (Figure 2B). Hence, bmk-1 over-expressing lines extended both median and maximum lifespan by approximately 25% as compared to WT (log rank test, N = 126/161, p < 0.001).
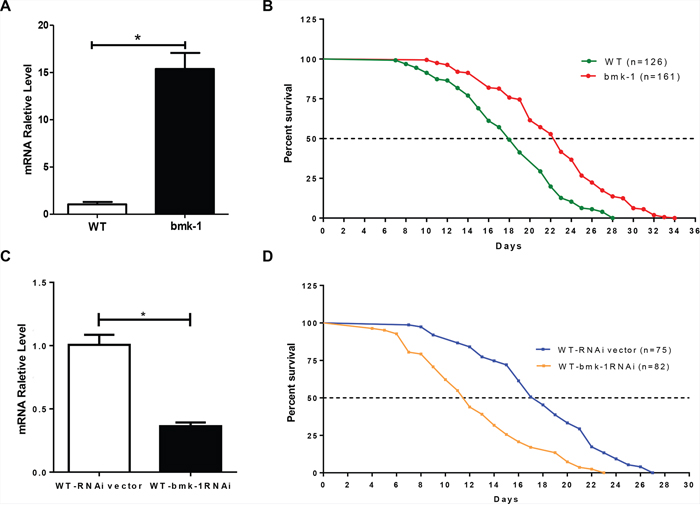
Figure 2: Bmk-1 over-expression extends lifespan and bmk-1 inhibition by RNAi shortens lifespan in C. elegans. A. qRT-PCR validation of bmk-1 over-expression worm lines shows increased bmk-1 gene expression (* indicates p < 0.01). Y-axis represents the relative expression level of bmk-1 normalized to act-1, and n ≥ 10 for each group. B. lifespan measurement for both WT (GFP-expressing, n = 126) and bmk-1 over-expressing (n = 161) animals. Both median lifespan and maximum lifespan of bmk-1 over-expressing lines show a 25% extension when compared to WT lines (p < 0.001, p values were derived from student t-test and log-rank test). C. qRT-PCR validated the RNAi effect, indicating a significant reduction (~64%) of bmk-1 transcripts in WT worms treated with bmk-1 RNAi. Y-axis represents the relative expression level of bmk-1 normalized to act-1, and n ≥ 10 for each group. * indicates p < 0.01. D. A shortened lifespan, both median (32%) and maximum (15%), was induced by bmk-1-specific RNAi in C. elegans (n = 82), as compared to RNAi vector lines (n = 75) (p < 0.0001).
We next examined lifespan after RNAi-induced bmk-1 knockdown in WT (with GFP) animals. A bmk-1 specific RNAi clone F10B5.5 was used to feed WT worms, thereby reducing bmk-1 expression. Only 36% expression levels of bmk-1 remained after bmk-1-RNAi treatment, as assessed by qRT-PCR (Figure 2C, p < 0.01). The median lifespan of WT animals was 17 days, but this was shortened to 11.5 days after bmk-1 RNAi treatment. Maximum lifespan shortened to 23 days from 27 days, and both median and maximum lifespan were significantly shortened by bmk-1 knockdown (p < 0.0001) (Figure 2D). Similar results were also observed from RNAi inhibition in bmk-1 over-expressing worm lines (Supplementary Figure S3).
Bmk-1 over-expressing lines have enhanced stress response
We then determined whether bmk-1 over-expressing lines could withstand various stressors better than WT (GFP-expressing) controls. Young adult worms that were bmk-1 over-expressors and WT controls were treated with the oxidative stressor paraquat at 4 mM for their lifespan duration. The median lifespan of bmk-1 over-expressing lines and the control lines were all about 4.0 days. However, the maximum lifespan of bmk-1 over-expression and WT lines were 13 days and 6 days, respectively, which is an increase of 120% in maximal lifespan for bmk-1 over-expressers (p < 0.001 maximal lifespans as compared to WT controls by log rank test) (Figure 3A).
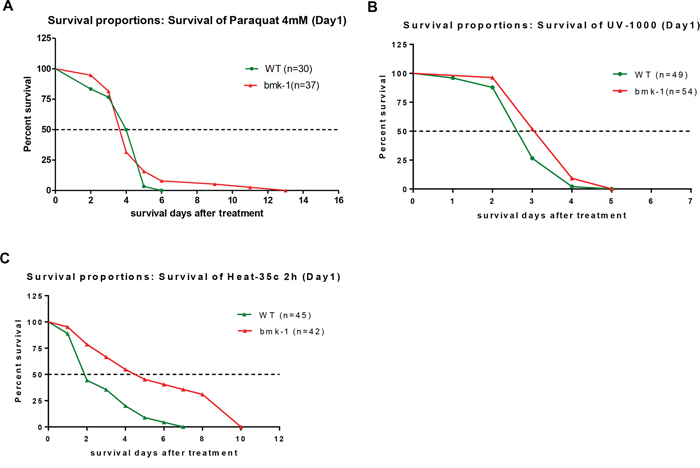
Figure 3: Bmk-1 over-expression lines enhances the stress response in C. elegans. A. After 4 mM paraquat treatment, the median survival of bmk-1 over-expressing lines (n = 37) was not changed as compared to WT (GFP-expressing) lines, but the maximum survival of bmk-1 over-expressing lines was increased 115% (n = 30) (p < 0.001). B. The median survival of bmk-1 over-expressing lines (n = 54) was increased 15% after UV radiation when compared to WT (n = 49) (p < 0.01). C. With heat shock, the median and maximum survivals of bmk-1 over-expressing lines (n = 42) were increased by 110% and 43%, respectively, when compared to WT (n = 45) (p < 0.001).
To provide a DNA damage stressor, worms were exposed on day 1 to UV radiation at 0.1 J/cm2. The median lifespan of bmk-1 over-expressing lines was 3.0 days and that of control lines was 2.6 days after UV radiation (20% higher for bmk-1 over-expressers, p < 0.01), while the maximum lifespans were 5 days for both (Figure 3B). Lastly, heat shock was administered at 35°C for 2 hours, after which animals were removed to routine conditions and their lifespans tallied. Intriguingly, the median lifespan of bmk-1 over-expression lines was 130.0% longer than that of control lines (4.4 days vs. 1.9 days) (p < 0.0001), and the maximum lifespan of Bmk-1 over-expression lines was increased by 43% as compared to that of control lines (10 days vs. 7 days) (Figure 3C). Hence, bmk-1 conferred some lifespan extension in the setting of multiple stressors which affected both DNA and protein integrity [21], but the response to heat-shock was greater than that observed for the other two stressors, and was highly significant. These results imply that bmk-1 enhances stress-coping capacities of worm, particularly with regard to heat-shock, and thereby extends the lifespan.
Hsp-16 is involved in the longevity function of bmk-1 in C. elegans
Since bmk-1 over-expression seemed to confer the greatest resistance to heat shock as compared to other stressors we tested, we speculated that key components of heat-shock proteins and/or apoptosis pathways may be involved in this beneficial survival effect. Therefore, we measured the expression of several well-known heat shock proteins (HSPs), as well as the cell death molecule in C. elegans - ced-3, the core apoptotic cell death executioner, after heat-shock. [22]. Among three measured HSPs, hsp-12, hsp-16 and hsp-70, we found that hsp-16 expression was significantly increased in bmk-1 over-expressing lines as compared to control lines, while the expression levels of hsp-12 and hsp-70 did not differ significantly (Figure 4). Furthermore, expression of ced-3 was reduced significantly in bmk-1 over-expressing lines under baseline conditions as compared to WT controls (Figure 4A–4D). Since over-expression of hsp-16 has been reported to extend lifespan in worms [23–24], and activation of caspases such as ced-3 promotes cell death [25], our results suggest that the hsp-16 pathway is affected by bmk-1 and may contribute to the lifespan extension observed in these studies.
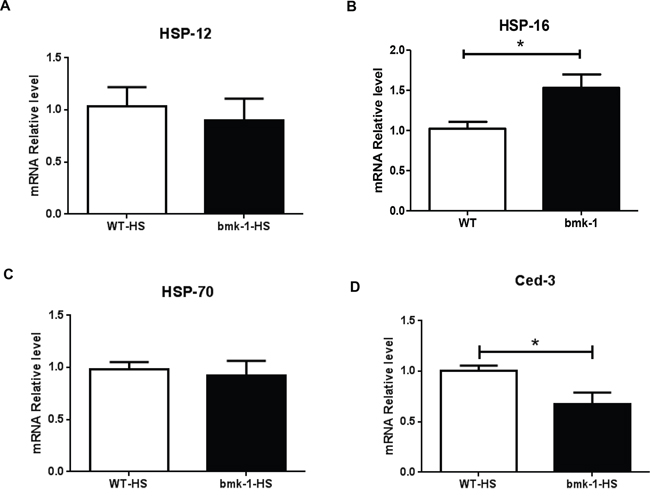
Figure 4: Hsp-16 expression was elevated after heat shock in bmk-1 over-expressing C. elegans. A. Expression of hsp-12 was not changed significantly between WT and bmk-1 over-expressing lines. B. Expression of hsp-16 increased significantly in bmk-1 over-expression lines when compared to WT control lines (p < 0.05). C. Expression of hsp-70 was not changed much between WT and bmk-1 over-expression lines. D. Expression of ced-3 decreased significantly bmk-1 over-expression lines when compared to WT control lines (* indicates p < 0.05). Y-axis represents the relative expression levels of hsp12, hsp16, hsp70, and ced-3 normalized to act-1, respectively; n ≥ 10 for each group.
To further investigate whether hsp-16 is a key mediator in bmk-1 effects on lifespan, we applied genetic epistasis studies with specific RNAis on hsp-16 in bmk-1 over-expressing worm lines and on bmk-1 in hsp-16 over-expressing lines. We first validated that the effectiveness of hsp-16 RNAi for in bmk-1 over-expressing worms. There was a significantly reduced expression of hsp-16 by over 80%, in bmk-1 overexpressors that were exposed to hsp-16 RNAi (Figure 5A). RNAi treatment for bmk-1 in hsp-16 over-expressing worms resulted in a decrease of 70% of expression levels for bmk-1. (Figure 5B). The genetic epistasis investigations showed that reducing hsp-16 expression in bmk-1 over-expressing worms significantly decreased both median and maximum lifespans of these animals (77% and 78%, respectively) (p < 0.0001). However, reducing bmk-1 expression by RNAi in hsp-16 longevity worms did not change either median or maximum lifespans of hsp-16 worms (Figure 5C). These results suggest that hsp-16 is essential for bmk-1's lifespan regulation in worms, and may work downstream of bmk-1. In contrast, in animals that already constitutively over-express hsp-16, the bmk-1 knockdown does not affect their lifespan (Figure 5C).
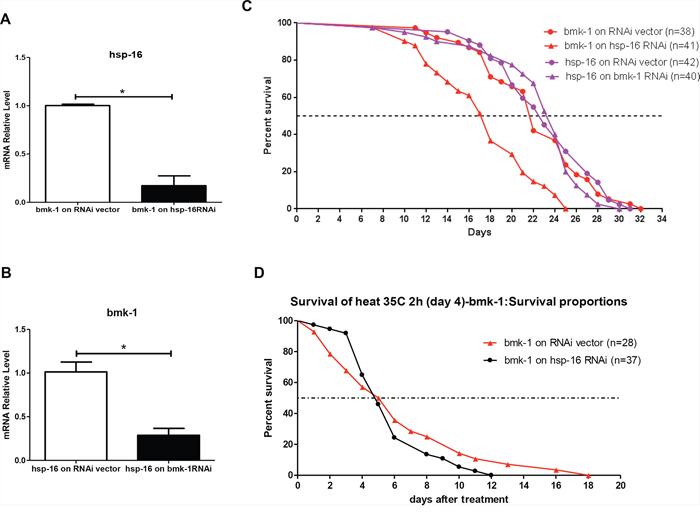
Figure 5: RNAi inhibition of hsp-16 in bmk-1 over-expressing worms shortens lifespan and weakens heat shock response. A. RNAi for hsp-16 in bmk-1 over-expression worms resulted in significantly reduced expression by over 80% as validated by qRT-PCR. Y axis represents the relative expression level of hsp-16 as it was normalized to act-1, and n ≥ 10 for each group (*p < 0.001). B. Similarly, RNAi for bmk-1 in hsp-16 over-expressing worms resulted in significantly reduced expression by over 70% as validated by qRT-PCR. Y axis represents the relative expression level of bmk-1 as it was normalized to act-1, and n ≥ 10 for each group (*p < 0.001). C. Red curves show lifespans of bmk-1 over-expression worms, while purple curves show lifespans of hsp-16 over-ex. pressing worms. In bmk-1 over-expressing worms, hsp-16 RNAi significantly decreased lifespan (77% and 78% decrease in median and maximum lifespan, respectively) (p < 0.0001 for both). However, in hsp-16 over-expressing worms, bmk-1 RNAi did not change either median or maximum lifespans. D. In bmk-1 over-expressing worms, hsp-16 RNAi significantly deteriorated worms response to heat shock with a shortening of 1/3 maximum lifespan (p < 0.0001, p values were derived from student t-test and log-rank test. n = 28 for RNAi vector group and n = 37 for hsp-16 RNAi group).
Lastly, we tested whether knocking-down hsp-16 by RNAi in bmk-1 over-expression lines would affect the stress coping capacity of this worm line. Heat shock was administered at 35°C for 2 hours, after which animals were removed to routine conditions and their lifespans tallied. The maximum survival of hsp-16 RNAi treated bmk-1 over-expression lines was 33% shorter than that of control lines (12 days vs. 18 days) (p < 0.0001) (Figure 5D). This indicates that the heat-shock resistance capacity that is acquired by bmk-1 over-expressing worms acquired heat-shock resistance capacity is indeed relying on the expression level of hsp-16. Taking together, hsp-16 is suggested the key mediator for bmk-1′s lifespan extension function by conferring a significant enhancement of stress-coping ability.
DISCUSSION
Genes that are essential for development and growth are highly conserved in evolution, and the evolutionary conserved genetic pathways such as Insulin/IGF-1 and TOR have been reported to determine normal lifespan in animals ranging from yeast, worm, and fly to rodents [26]. This suggests that both development and aging are essential for survival and evolution in animal kingdom. It is reasonable that some genes may play roles in both development process and aging or lifespan determination. Indeed, there are a few identified genes that are not only crucial for development, but also associated with lifespan determination. For instance, both daf-2 and daf-12 affect the dauer larva developmental formation, as well as adult lifespan, in an allele-specific manner in worms [27–28]. In early C. elegans embryonic stages, bmk-1 localizes to the region of overlapping interpolar microtubules and functions as a regulator that governs the rate of spindle elongation, as well as the chromosome segregation [4–6]. Our study is the first to suggest that bmk-1 also regulates the lifespan in worms, and that the expression of KIF11, the mammalian homolog of bmk-1, declines with mouse and human tissue aging.
The mechanism by which bmk-1 extends lifespan may possibly be through enhanced expression of hsp-16 and inhibition of ced-3 as suggested by the genetic epistasis study. It appears that hsp-16 is essential for bmk-1-induced the lifespan extension, and also accounts for the enhanced heat shock stress resistance of bmk-1 worms. Heat shock proteins, also called molecular chaperones, are well-known mediators of stress resistance [29]. A large body of evidence accumulated in senescence models at the cellular and whole animal level has consistently shown that heat shock gene expression, in response to various stressors, is poorly induced in aged subjects [30–31]. Hsp-16 is one of the small chaperone proteins and has been observed to have elevated expression in long-lived worms such as the daf-2 and age-1 mutants [32–34]. In addition, transgenic overexpression of hsp-16 in C. elegans increases worm life span [23–24]. These observations have already implicated a link between hsp-16 and lifespan regulation by protecting cells from stress. Ced-3, the equivalent of mouse and human caspase-1, is a key regulator that promotes cell apoptosis [22, 25]. The reduction of ced-3 expression in bmk-1 over-expressing worms suggested an inhibition of the cell apoptosis program, which may stem from increased cellular protection in the setting of increased hsp-16, and which may also contribute to a longer lifespan.
In brief, we have described bmk-1 as having a potential new role in lifespan extension in C. elegans. This gene effectively extends lifespan in over-expressing lines under a variety of stressors, and knockdown of the gene results in shortening of lifespan. The mechanism of action of bmk-1 is likely mediated by enhancing the expression hsp-16. The longevity effects of bmk-1 and its homologs should be studied in other mammalian systems with cutting-edge genetic approaches.
MATERIALS AND METHODS
Nematode strains and maintenance
The C. elegans nematode strain N2 used for all the experiments was a gift from the Reinke lab. All the C. elegans stocks, including constructed strains, were maintained at 25°C on nematode growth medium agar (NGM) plates seeded with E. coli strain OP50, as described in our previous study [17, 35]
Molecular cloning
Multiple DNA fragments were cloned by using Gateway three-fragment vector construction kit. (Invitrogen, Carlsbad, CA).
Step 1: Produce three fragments with flanking site by PCR:
Three fragments: promoter Myo-3 (gift from Koelle lab), gene GFP or bmk-1, and 3′-UTR were amplified by PCR using primers that incorporate flanking attB4 and attB1r sites in fragment myo-3, flanking attB1 and attB2 sites in the GFP or bmk-1 genes, and flanking attB2r and attB3 sites in 3′-UTR. Templates for amplifying Myo-3, GFP, and 3′-UTR are others’ plasmids (gift from Reinke lab), and the gene bmk-1 was amplified from C. elegans genomic DNA (gift from Reinke lab).
Step 2: Entry clones were generated by BP reaction:
Three PCR products from step 1 and three donor vectors P4-P1r, P1-P2, P2-P3 were used in three separated BP recombination reactions between an att B-flanked DNA fragment and an att P-containing donor vector to generate an entry clone. We generated three entry clones: pENTR™L4-R1-Myo-3, pENTR™L1-L2-GFP and pENTR™L1-L2-bmk-1, and pENTR™R2-L3-3′-UTR.
Step 3: Expression clones were generated by LR reaction:
Expression clones were generated by LR reactions between an att L-containing entry clone and an att R-containing destination vector. Three entry clones from step 2 and the destination vector pDEST™R4-R3 were used together in a single LR reaction to generate the expression clones pCFJ150 with 3 fragments, which were named pCFJ150-GFP and pCFJ150-bmk-1 Cloning primers.
Microinjection
A DNA mixture of 10 ng plasmid pCFJ150-GFP, and 10 ng plasmid pCFJ150-bmk-1, and 50 ng carrier plasmid pUC-19 was microinjected into the syncytial gonad of wild type N2 animals [17, 36]. After 48–72 hr, we scored the progeny of injected worms using a fluorescent stereomicroscope (Olympus S2 × 16). Each green transformed progeny was transferred to a separate NGM plate as an independent line by a worm pick. Only the lines for which the F1 progeny could pass the transgene to their progeny with efficiencies (green positive worms as a fraction of all progeny) greater than 50% were kept and used in further experiments. GFP alone with the carrier DNA were injected to obtain the control lines for these experiments. Each transgenic line was maintained by transferring 5–10 green worms to a new NGM plate every 3–4 days.
Genotyping
Single adult worms were picked and put into 10 ul lysis buffer (50 mM KCl, 10 mM Tris pH8.3, 2.5 mM MgCl2, 0.45% NP40, 0.45% Tween 20, 0.01% gelatin) with fresh 1.0 mg/ml Proteinase K. Worms were digested at 60°C for an hour and 95°C for 15 min. Digested lysate template was amplified by PCR using oligonucleotide primer sequences forward: 5′-ctatgaccatgattacgccaagc; and reverse: 5′-gatgatgaggattcacgacaca. The PCR product was indicated by a 3273bp band on a 1% agarose gel. The bmk-1 over-expressing lines were all genotyped to ensure the over-epxressors were really over-expressing bmk-1.
Lifespan assay
To quantify lifespan, L4 larvae from the age-synchronized population of worms were transferred to NGM plates supplied with 100 ug/ml Ampicillin and 500 nM 5-fluoro-20-deoxyuridine (FUDR) seeded with sufficient OP50 bacteria. Worms were monitored by tapping their head with a platinum worm pick every 1 or 2 days until they were dead. Worms were scored as dead if they did not respond by moving the head to tapping. Worms which had fled or crawled off the agar and died on the side were censored and removed from analysis. At least three individual experiments were performed in each group.
Paraquat treatment and heat shock
Age-synchronized L4 larvae were first transferred to FUDR plates. After 24 hr, for the paraquat assay young adults were moved to FUDR plates supplied with 4 mM paraquat for the duration of the experiment [17]. For heat shock, the plates with young adult worms were moved to a 35°C incubator for 2 hr, and then removed back to 25°C conditions [17]. All of the worms were subsequently monitored every day for lifespan, and survival curves were based on daily counting.
UV radiation
Young adult worms were irradiated on NGM plates without OP50 under a germicidal bulb (254 nm) at 0.1 J/cm2 by using an UV crosslinkers. (CL-1000 Ultraviolet Crosslinkers, LLC Upland, CA, US). Then the worms were transferred to FUDR plates that were seeded with OP50. Worms were checked daily through their lives to generate survival curves [21].
RNAi induction
Gene knock down by RNAi was performed by feeding the worms with bacteria which produced dsRNA against the gene of interest. RNAi for bmk-1 was a gift (Weidhaas lab). Briefly, on the first day, the RNAi clone in E. coli was incubated overnight at room temperature on RNAi agar plates with 25 μg/ml carbenicillin and 1 mM isopropylthiogalactosidase (IPTG) to induce dsRNA expression. On the second day, L4 larvae were transferred to the seeded plates to be monitored for their life spans. Bacteria containing RNAi empty vector were used as food for the control group [37].
RNA isolation and quantitative PCR
Total RNA extraction was performed by using RNeasy mini kit from QIAGEN. 10 worms were collected as one sample in M9 buffer then were washed three times and excess M9 was carefully removed. The pellets were resuspended in 350 ul lysis buffer with β-mercaptoethanol, mix with equal volume of 70% ethanol. The mixture was transferred to a spin column and followed by the manufacturer protocol. DNase digestion was performed in the column and RNA was eluted in 13 ul RNase-free water. Reverse transcription was performed by using Ominscript kit (QIAGEN). For real-time PCR, each 25 ul reaction containing 12.5 μl of 2x SybrGreen supermix (Bio-Rad), 0.4 μM of each primer, mRNA primers and 2 μl of template cDNA was performed on a C1600 Thermal Cycler (Bio-Rad). Relative gene expression level was normalized to act-1 and calculated using the ΔΔCt (cycle threshold) method [39–40].
Cloning primers |
|
attB1-bmk-1-F |
5′-ggggacaagtttgtacaaaaaagcaggctcgttggattcgacaatggcatcc |
attB2-bmk-1-R |
5′-ggggaccactttgtacaagaaagctgggtctgtgcgttagttttcgaaatc |
attB4-Pmyo3-F |
5′-ggggacaactttgtatagaaaagttgaacggctataataagttctt |
attB1r-Pmyo3-R |
5′-ggggactgcttttttgtacaaacttgttctagatggatctagtgg |
bmk-1-R |
5′-tcaacttgaatgtggttctcc |
Pmyo3-F |
5′-caaatttctcggcgatttgt |
mRNA primers |
|
bmk-1-F |
5′-cgaaagttgcggagaatcat |
bmk-1-R |
5′-ttcacatcgcaagtctccac |
hsp-16-F |
5′-ggctcagatggaacgtcaa |
hsp-16-R |
5′-gcttgaactgcgagacattg |
ced-3-F |
5′-cggagttcctgcatttcttc |
ced-3-R |
5′-acagacggcttgaatgaacc |
hsp-70-F |
5′-tgaaaaggcacttcgtgatg |
hsp-70-R |
5′-ccaaaggctactgcttcgtc |
hsp-12-F |
5′-gtgatggctgacgaaggaac |
hsp-12-R |
5′-gggaggaagttatgggcttc |
act-1-F |
5′-tgctgatcgtatgcagaagg |
act-1-R |
5′-tagatcctccgatccagacg |
Examination of the expression of Bmk-1 homologs in mouse and human tissues
Total RNA of mouse and human ovaries were isolated with the RNeasy mini kit (QIAGEN). Five young animals (3 months old) and 5 old animals (22 months old) were used for the gene expression analysis. Eight young humans (ages 18–25 yrs old) and 10 old humans (ages >60 yrs old) were included for this study. Gene expression was analyzed by Affymetrix gene array (version ST 1.0) and the differential expression of Bmk-1 homologs was judged by both fold change and by p value [17, 40].
ACKNOWLEDGMENTS
We thank Michelle Kudron and Guiling Wang in the Reinke lab, and Kevin Collins and Judy Pepper in the Koelle lab, and Sunitha Nallur in the Weidhaas lab at Yale for providing reagents, technical support and thoughtful technical discussions. This work was supported by Yale University.
Author contributions
X.X. and L.E.N. conceived the project. X.X. and H.Q. designed and performed experiments and data analysis. X.X., H.Q. and L.E.N. interpreted the results and wrote the manuscript.
Additional information
L.E.N. has a financial interest in Humacyte, Inc, a regenerative medicine company. Humacyte did not fund these studies, and Humacyte did not affect the design, interpretation, or reporting of any of the experiments herein.
REFERENCES
1. Bishop JD, Han Z, Schumacher JM. The Caenorhabditis elegans Aurora B kinase AIR-2 phosphorylates and is required for the localization of a BimC kinesin to meiotic and mitotic spindles. Mol Biol Cell. 2005 Feb; 16:742–56.
2. Hirokawa N, Tanaka Y. Kinesin superfamily proteins (KIFs): Various functions and their relevance for important phenomena in life and diseases. Exp Cell Res. 2015 Feb 24. pii: S0014-482700063-4.
3. Saunders AM, Powers J, Strome S, Saxton WM. Kinesin-5 acts as a brake in anaphase spindle elongation. Curr Biol. 2007 Jun 19; 17:R453–4.
4. Civelekoglu-Scholey G, Scholey JM. Mitotic motors: kinesin-5 takes a brake. Curr Biol. 2007 Jul 17; 17:R544–7.
5. Rozelle DK, Hansen SD, Kaplan KB. Chromosome passenger complexes control anaphase duration and spindle elongation via a kinesin-5 brake. J Cell Biol. 2011 Apr 18; 193:285–94.
6. Sharp DJ, Yu KR, Sisson JC, Sullivan W, Scholey JM. Antagonistic microtubule-sliding motors position mitotic centrosomes in Drosophila early embryos. Nat Cell Biol. 1999 May; 1:51–4.
7. Miki H, Okada Y, Hirokawa N. Analysis of the kinesin superfamily: insights into structure and function. Trends Cell Biol. 2005 Sep; 15:467–76.
8. Lawrence CJ, Dawe RK, Christie KR, Cleveland DW, Dawson SC, et al. A standardized kinesin nomenclature. J Cell Biol. 2004 Oct 11; 167:19–22.
9. Wordeman L. How kinesin motor proteins drive mitotic spindle function: Lessons from molecular assays. Semin Cell Dev Biol. 2010 May; 21:260–8.
10. Hirokawa N, Noda Y, Tanaka Y, Niwa S. Kinesin superfamily motor proteins and intracellular transport. Nat Rev Mol Cell Biol. 2009 Oct; 10:682–96.
11. Liu M, Li D, Sun L, Chen J, Sun X, Zhang L, Huo L, Zhou J. Modulation of Eg5 activity contributes to mitotic spindle checkpoint activation and Tat-mediated apoptosis in CD4-positive T-lymphocytes. J Pathol. 2014 Jun; 233:138–47.
12. Mardin BR, Isokane M, Cosenza MR, Krämer A, Ellenberg J, Fry AM, Schiebel E. EGF-induced centrosome separation promotes mitotic progression and cell survival. Dev Cell. 2013 May 13; 25:229–40.
13. Tao W, South VJ, Diehl RE, Davide JP, Sepp-Lorenzino L, Fraley ME, Arrington KL, Lobell RB. An inhibitor of the kinesin spindle protein activates the intrinsic apoptotic pathway independently of p53 and de novo protein synthesis. Mol Cell Biol. 2007 Jan; 27:689–98.
14. Kashina AS1, Baskin RJ, Cole DG, Wedaman KP, Saxton WM, Scholey JM. A bipolar kinesin. Nature. 1996 Jan 18; 379:270–2.
15. Sarli V, Giannis A. Targeting the kinesin spindle protein: basic principles and clinical implications. Clin Cancer Res. 2008 Dec 1; 14:7583–7.
16. Li W, Cowley A, Uludag M, Gur T, McWilliam H, Squizzato S, Park YM, Buso N, Lopez R. The EMBL-EBI bioinformatics web and programmatic tools framework. Nucleic Acids Res. 2015 Apr 6.
17. Qian H, Xu X, Niklason LE. PCH-2 regulates Caenorhabditis elegans lifespan. Aging (Albany NY). 2015 Jan; 7:1–13.
18. Vicente JJ, Wordeman L. Mitosis, microtubule dynamics and the evolution of kinesins. Exp Cell Res. 2015 Feb 20.
19. Kenyon C. The genetics of ageing. Nature. 2010; 464:504–12.
20. Fontana L, Partridge L, Longo VD. Extending healthy life span—from yeast to humans. Science. 2010; 328:321–6.
21. Sutphin GL, Kaeberlein M. Measuring Caenorhabditis elegans life span on solid media. J Vis Exp. 2009; 27; doi: 10.3791/1152.
22. Yuan J. Evolutionary conservation of a genetic pathway of programmed cell death. J Cell Biochem. 1996 Jan; 60:4–11.
23. Tatar M, Khazaeli AA, Curtsinger JW. Chaperoning extended life. Nature. 1997 Nov 6; 390:30.
24. Walker GA, Lithgow GJ. Lifespan extension in C. elegans by a molecular chaperone dependent upon insulin-like signals. Aging Cell. 2003 Apr; 2:131–9.
25. Hengartner MO, Horvitz HR. The ins and outs of programmed cell death during C. elegans development. Philos Trans R Soc Lond B Biol Sci. 1994 Aug 30; 345:243–6.
26. Guarente L, Kenyon C. Genetic pathways that regulate ageing in model organisms. Nature. 2000; 408:255–62.
27. Kenyon C, Chang J, Gensch E, Rudner A, Tabtiang R. A C. elegans mutant that lives twice as long as wild type. Nature. 1993 Dec 2; 366:461–4.
28. Gill MS, Held JM, Fisher AL, Gibson BW, Lithgow GJ. Lipophilic regulator of a developmental switch in Caenorhabditis elegans. Aging Cell. 2004 Dec 3:413–21.
29. Morley JF, Morimoto RI. Regulation of longevity in Caenorhabditis elegans by heat shock factor and molecular chaperones. Mol Biol Cell. 2004 Feb; 15:657–64.
30. Fargnoli J, Kunisada T, Fornace AJ Jr, Schneider EL, Holbrook NJ. Decreased expression of heat shock protein 70 mRNA and protein after heat treatment in cells of aged rats. Proc Natl Acad Sci U S A. 1990 Jan; 87:846–50.
31. Fawcett TW, Sylvester SL, Sarge KD, Morimoto RI, Holbrook NJ. Effects of neurohormonal stress and aging on the activation of mammalian heat shock factor 1. J Biol Chem. 1994 Dec 23; 269:32272–8.
32. Akerfelt M, Morimoto RI, Sistonen L. Heat shock factors: integrators of cell stress, development and lifespan. Nat Rev Mol Cell Biol. 2010 Aug; 11:545–55.
33. Hsu AL, Murphy CT, Kenyon C. Regulation of aging and age-related disease by DAF-16 and heat-shock factor. Science. 2003 May 16; 300:1142–5.
34. McElwee J, Bubb K, Thomas JH. Transcriptional outputs of the Caenorhabditis elegans forkhead protein DAF-16. Aging Cell. 2003 Apr; 2:111–21.
35. Murphy CT, McCarroll SA, Bargmann CI, Fraser A, Kamath RS, Ahringer J, Li H, Kenyon C. Genes that act downstream of DAF-16 to influence the lifespan of Caenorhabditis elegans. Nature. 2003 Jul 17; 424:277–83.
36. Guha S, Cao M, Kane RM, Savino AM, Zou S, Dong Y. The longevity effect of cranberry extract in Caenorhabditis elegans is modulated by daf-16 and osr-1. Age. 2013 5:1559–74.
37. Stiernagle T. Maintenance of C. elegans. WormBook. 2006 11:1–11.
38. Fraser AG, Kamath RS, Zipperlen P, Martinez-Campos M, Sohrmann M, Ahringer J. Functional genomic analysis of C. elegans chromosome I by systematic RNA interference. Nature. 2000; 408:325–30.
39. Xu X, Zhan M, Duan W, Prabhu V, Brenneman R, Wood W, Firman J, Li H, Zhang P, Ibe C, Zonderman AB, Longo DL, Poosala S, Becker KG, Mattson MP. Gene expression atlas of the mouse central nervous system: impact and interactions of age, energy intake and gender. Genome Biol. 2007; 8:R234.
40. Qian H, Xu X. Reduction in DNA methyltransferases and alteration of DNA methylation pattern associate with mouse skin ageing. Exp Dermatol. 2014 May; 23:357–9.