
INTRODUCTION
Rapamycin is a naturally occurring antifungal compound produced by bacteria. It forms a complex with FKBP12 that allosterically inhibits primarily mTORC1 [1, 2]. mTOR is a serine/threonine kinase found in two complexes, mTORC1 and mTORC2. mTORC1 coordinates cell growth and metabolism in response to environmental stresses, nutrient and energy levels, growth factors and other conditions [3]. Rapamycin extends life span of wild type mice [4], possibly through cancer suppression since mTORC1 signaling is often dysregulated in cancer cells [5]. In addition, rapamycin reduced cancer in kidney transplant patients [6, 7] and mouse cancer models [8-13]. Dietary rapamycin also ameliorated general aging in wild type mice for most [4, 14-17], but not all studies [18]. Rapamycin also extended life span for lower organisms that do not die from cancer suggesting that rapamycin suppresses general aging in addition to cancer [19]. Thus, rapamycin appears to suppress mTORC1-mediated oncogenesis and possibly general aging.
p53 is a transcription factor with broad biological function [20] that is best known for suppressing tumors in humans [21, 22] and mice [23, 24] by inducing cell cycle arrest, apoptosis and senescence in response to a variety of stresses [25]. In response to stress, p53 inhibits mTORC1 [26, 27] by inducing transcription of Sestrin 1 and Sestrin 2 that activates AMP-responsive protein kinase (AMPK) to phosphorylate the mTOR inhibitor, tuberous sclerosis 2 (TSC2) [28] and by negatively regulating the amino acid-sensing pathway through modulation of Gator2 [29] or as RagA/B guanine nucleotide dissociation inhibitors (GDIs) [30]. p53 also induced PTEN/PIP3/AKT to decease mTORC1 activity [31]. Thus, p53 suppresses mTORC1-driven cell growth in response to cellular stresses like DNA damage.
Rapamycin could have an additive effect with p53 to suppress mTORC1. This possibility is especially important since most cancers are dysfunctional for p53 [32]. In support, p53-mutant mice exhibited increased mTOR activity in some, but not all tissues [33]. Yet, rapamycin extended the life span of p53+/- [10] and p53-/- [11] mice when added to the drinking water or administered in nanoformulated micelles (Rapatar), respectively. These latter results are inconsistent with the notion that p53 regulates mTORC1. However, the impact p53 dose has on rapamycin activity was not assessed in these studies. p53 dose could be important since p53+/- mice exhibit haploinsufficiency as demonstrated by tumors that maintained wild type p53 function [34]. Furthermore, increasing the dose of enterically encapsulated rapamycin (eRapa) from 14 ppm to 42 ppm proportionately enhanced mouse life span [35] and suppressed intestinal adenomas [9]. Thus, the pharmacological concentration of rapamycin could be important with regard to p53 gene dose or p53 activity.
In this study, we report three observations that support an additive relationship between p53 and rapamycin in mammals. First, p53 enabled rapamycin-driven life span extension in mice. Second, p53 facilitated rapamycin-mediated SASP reduction in human cells that were made senescent by IR. Third, p53 enhanced rapamycin-induced elevation of amino acids and citric acid in mouse embryonic stem (ES) cells. Thus, p53 augments rapamycin.
RESULTS
p53 augments rapamycin-induced lifespan extension in mice
We tested the possibility that p53 and rapamycin would have an additive effect at influencing mouse life span since both suppress tumors to extend life span. Mice with varying p53 levels (p53-/-, p53+/-, p53+/+) were generated using p53+/- breeding pairs (129XC57Bl-6J) [23]. Same-sex littermates were housed together (5 per cage) independent of genotype. Mice were fed chow containing empty Eudragit capsules (control) or capsules containing 14 ppm eRapa, the concentration previously shown to extend lifespan, delay tumor-related death, retard a number of age-related pathologies, and improve cerebral function [4, 8, 9, 14, 16, 17, 36]. These treatments were started at approximately 8.5 weeks of age (median age 61 days) and continued until death. Mice either died naturally or were sacrificed when moribund (unresponsive, dehydrated and immobile). At the time of death, the serum rapamycin concentration was greater in eRapa-fed mice (range 0.59 – 7.13 ng/ml, mean 2.57 +/- 1.98 ng/ml, 25 mice observed) than control-fed mice (range 1 – 1.25 ng/ml, mean 1.19 +/- 0.11 ng/ml, 17 mice observed). Most likely some eRapa-fed mice had low serum rapamycin concentrations because they had stopped eating due to their moribund condition and since blood levels were higher in healthy mice fed 14 ppm eRapa in a previous study (32 - 51 ng/ml) [9].
p53 genotype influenced rapamycin-mediated life span extension. eRapa did not significantly benefit p53-/- mice (Figure 1), which had median survival times (male + female) of 198.5 and 192 days for control- and eRapa-fed mice, respectively (p=0.2410). By contrast, eRapa extended the median survival of p53+/- (520 to 582 days, p=0.0522) and p53+/+ mice (681 to 802.5 days, p=0.0013). eRapa improved median survival more for p53+/- females compared to p53+/- males (15.5% vs. 13.7% increase) and more for p53+/+ females compared to p53+/+ males (20.9% vs. 11.6% increase), similar to previous reports [4, 35]. The p53 gene dose appears to directly correlate with rapamycin’s effectiveness at extending mouse life span.
Chronic eRapa treatment did not significantly change tumor incidence in p53-deficient mice. Necropsies were performed on moribund mice after sacrifice or soon after natural death. Potential tumor masses and abnormal tissues were analyzed. Cancer, mostly lymphoma, was the major pathology identified at the time of death for all genotypes (Table 1). With control chow, p53-/- mice had a higher lymphoma incidence than p53+/- or p53+/+ mice (70% vs. 59% and 53%, respectively). With eRapa chow, there was a lower trend in the incidence of lymphoma in p53-/- mice but corresponding higher trend in the incidence of sarcomas (including leiomyoma, rhabdomyosarcoma, hemangiosarcoma and osteosarcoma); there was a similar but less pronounced trend in p53+/- mice. Very little change was observed in wild type p53+/+ mice, similar to a report that showed eRapa had only a minor effect on tumor multiplicity or burden in genetically heterogenous mice [35].
Table 1: Summary of histology
Female |
||||||
p53-/- |
p53+/- |
p53+/+ |
||||
observation |
eudragit |
eRapa |
eudragit |
eRapa |
eudragit |
eRapa |
lymphoma |
83.3% (5) |
33.3% (2) |
46.2% (6) |
63.6% (7) |
50% (4) |
10% (1) |
other cancer |
16.7% (1) |
66.7% (4) |
23.1% (3) |
9.1% (1) |
0% |
10% (1) |
liver defects |
0% |
0% |
30.8% (8) |
27.3% |
50% (4) |
80% (8) |
total cancer |
100% (6) |
100% (6) |
69.2% (9) |
72.7% (8) |
50% (4) |
20% (2) |
total histo samples |
6 |
6 |
13 |
11 |
8 |
10 |
total in cohort |
8 |
7 |
32 |
29 |
17 |
21 |
Male |
||||||
p53-/- |
p53+/- |
p53+/+ |
||||
observation |
eudragit |
eRapa |
eudragit |
eRapa |
eudragit |
eRapa |
lymphoma |
64.3% (9) |
44.4% (8) |
71.4% (10) |
20% (2) |
57.1% (4) |
70% (7) |
other cancer |
21.4% (3) |
55.6% (10) |
14.3% (2) |
40% (4) |
14.3% (1) |
10% (1) |
liver defects |
14.3% (2) |
0% |
14.3% (2) |
40% (4) |
28.6% (2) |
20% (2) |
total cancer |
85.7% (12) |
100% (18) |
85.7% (12) |
60% (6) |
71.4% (5) |
80% (8) |
total histo samples |
14 |
18 |
14 |
10 |
7 |
10 |
total in cohort |
15 |
23 |
28 |
22 |
19 |
21 |
Other cancers include sarcomas (leiomyo-, rhabdo-, hemangio-, and osteo-), hepatocellular carcinoma, carcinoma, primitive neuroectodermal tumor, malignant fibrous histiocytoma, and a few unidentified neoplasms. Liver defects include biliary duct hyperplasia, colangiohepatitis, hepatitis, cystic liver, lipidosis, necrosis, thrombus, and focal hepatocellular alteration. Low incidence of the following were also observed: extramedullary hematopoiesis/lymphoid hyperplasia, bladder cystitis with edema, nephritis, hydronephrosis, myocarditis, lung congestion, colitis, abdominal steatosis, and benign masses.
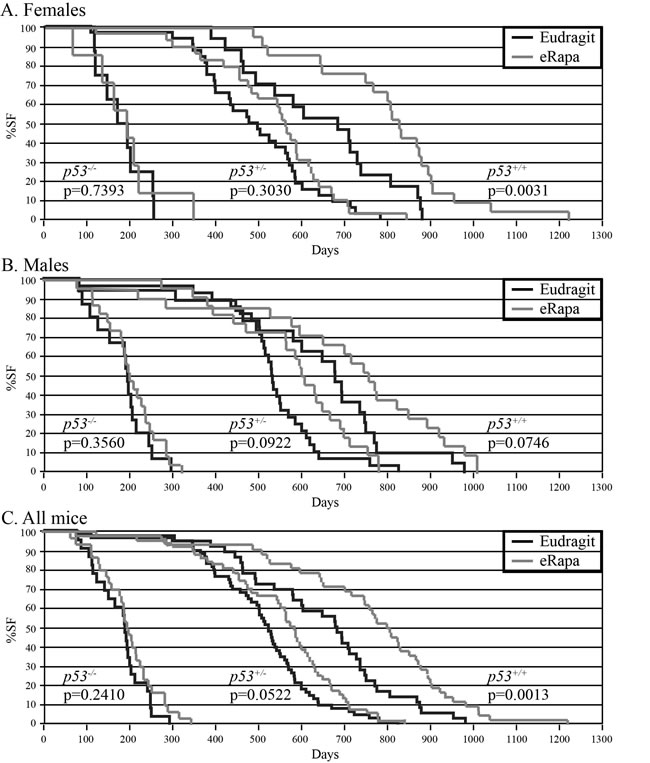
Figure 1: eRapa-mediated life span extension depends on p53 dose in mice. Mice were fed eRapa (14 ppm) or empty capsules (Eudragit) starting at approximately 8.5 weeks of age until death. (A) Females. Number of Eudragit-fed mice: 8 p53-/-, 32 p53+/-, 17 p53+/+. Number of eRapa-fed mice: 7 p53-/-, 29 p53+/-, 21 p53+/+. (B) Males. Number of Eudragit-fed mice: 15 p53-/-, 28 p53+/-, 19 p53+/+. Number of eRapa-fed mice: 23 p53-/-, 22 p53+/-, 21 p53+/+. (C) Females and males combined. Number of Eudragit-fed mice: 23 p53-/-, 60 p53+/-, 36 p53+/+. Number of eRapa-fed mice: 30 p53-/-, 51 p53+/-, 42 p53+/+.
p53 augments rapamycin-induced inhibition of SASP in normal human fibroblasts
We tested the possibility that p53 and rapamycin would have an additive effect at suppressing characteristics of cellular senescence, a process that limits cell growth [37]. Cellular senescence helps prevent the proliferation of potential cancer cells and is therefore, anti-oncogenic. Yet it also promotes the senescence-associated secretory phenotype (SASP) that can increase cancer risk. The SASP is a collection of secreted factors characteristic of senescent cells that accompanies growth arrest [38] and is conserved between human and mouse cells [39]. These factors include growth factors, proteases, cytokines and chemokines and together support cancer development and progression, and might also promote aging [40].
We examined the ability of p53 and rapamycin to influence the SASP in four different normal human diploid fibroblast cell strains. We assayed the levels of three different cytokines indicative of a SASP response (IL-6, IL-8 and IL-1α). For comparison we assayed levels of a cytokine that is not part of the SASP (IL-5). To study the effects of p53, we expressed in cells the genetic suppressor element 22 (GSE), a peptide that prevents p53 tetramerization and inactivates function [41]. Using this approach, we observed the impact of p53 on IR-induced geroconversion for cells exposed to rapamycin.
First we analyzed the impact of IR on these human cells. There was a very low level of expression of SASP-associated cytokines without IR exposure (Pre). As expected, IR increased the levels of SASP cytokines, but not IL-5, regardless of GSE22 expression (Figure 2, compare Pre vs IR). Thus, IR induced a SASP response as expected.
Second we analyzed the impact of p53 activity on the SASP. As expected [38], GSE22 significantly enhanced the SASP response for all cells and SASP cytokines (Figure 2, compare grey to pink bars) with a single possible exception (IL1α, HCA2 cells). Thus, p53 suppressed the SASP, consistent with the notion that p53 is a gerosuppressor under these conditions.
Third, we analyzed the impact of rapamycin on the SASP of irradiated cells without and with GSE22 expression. Rapamycin significantly suppressed the SASP for all cells, regardless of p53 status (Figure 2 compare grey vs black bars and pink vs red bars). Yet in every comparison, rapamycin suppressed the SASP to a greater extent in p53 competent cells (Figure 2, compare black and red bars). In most cases, rapamycin only decreased the SASP of GSE22-expressing cells to levels of irradiated untreated wild type cells. Thus, p53 augmented the effectiveness of rapamycin in reducing the SASP. This observation suggests p53 enables rapamycin and is consistent with the mouse life span studies.
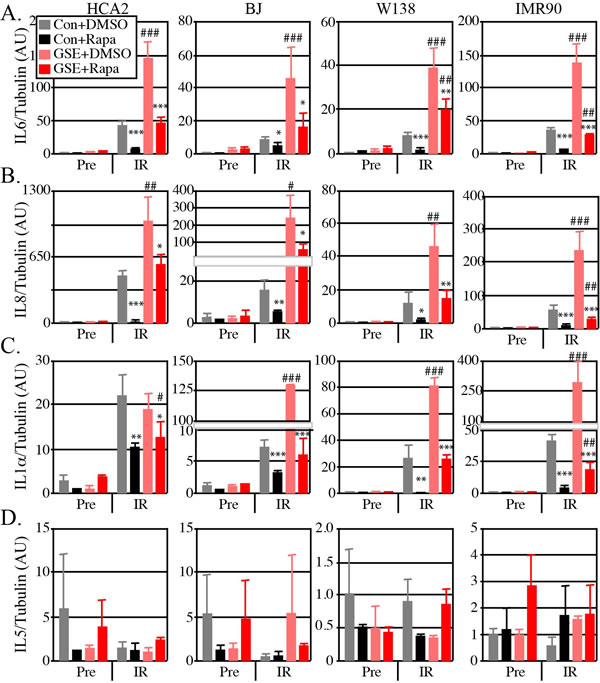
Figure 2: Rapamycin alters the SASP in normal human fibroblasts, and is more effective in cells with functional p53. Cells were infected with a lentiviral vector expressing GSE22 or an insertless vector. Irradiated and control cells were given Rapamycin (Rapa) or DMSO for 10 days. RNA was extracted from control and irradiated cells and quantified by qRT-PCR for mRNA levels of endogenous (A) IL6, (B) IL8, (C) IL1α and (D) IL5. Tubulin was used as internal control. Irradiated (IR) rapamycin treated cells compared to IR untreated cells N+4, data shown are the mean +/- SD: * p<0.05, ** p<0.01, ***<0.001. IR GSE cells compared to IR wild type cells: # p<0.05, ## p<0.01, ### p<0.001.
p53 augments rapamycin-induced elevation of amino acid levels in mouse ES cells
We tested the possibility that p53 and rapamycin would have an additive effect at altering cell metabolism since both the p53 and mTORC1 pathways are responsive to and influenced by the metabolic status of cells [3, 42]. Therefore, we measured metabolic parameters in p53+/+ and p53-/- mouse ES cells [43] exposed to rapamycin. We chose ES cells because they are similar to cancer stem cells. Even though ES cells are primary, they are also pluripotent and immortal [44]. As such, ES cells exhibit self-renewal and are oncogenic. Furthermore, like many cancer cells, they have a high mitotic index and exhibit enhanced glycolysis (the Warburg effect) [45-48]. In ES cells, p53 activates genes associated with differentiation but suppresses genes associated with ES/iPS cell status in response to ionizing radiation [43]. Therefore, ES cells were used to assess the potential additive effect of rapamycin dose in p53+/+ and p53-/- cells.
Metabolic profiling was performed on mouse ES cells exposed to physiologically relevant doses of rapamycin, as determined by a proliferation curve that determined the effect of rapamycin on ES cell proliferation (Figure 3A). Rapamycin elevated the cellular levels of eight amino acids and p53 augmented this enhancement (Figure 3B-3I). mTOR signaling is responsive to amino acid levels, which are critical for protein translation [49, 50]. Rapamycin can elevate amino acid levels by elevating autophagy and promoting amino acid import by regulating expression of amino acid transporters such as Snat3 [51]. A similar result was seen for citric acid (Figure 3J). Citric acid is important to the tricarboxylic acid cycle, consistent with a role for p53 in promoting mitochondrial respiration [42, 52]. Thus, p53 augments rapamycin-mediated elevation of amino acid and citric acid levels in ES cells.
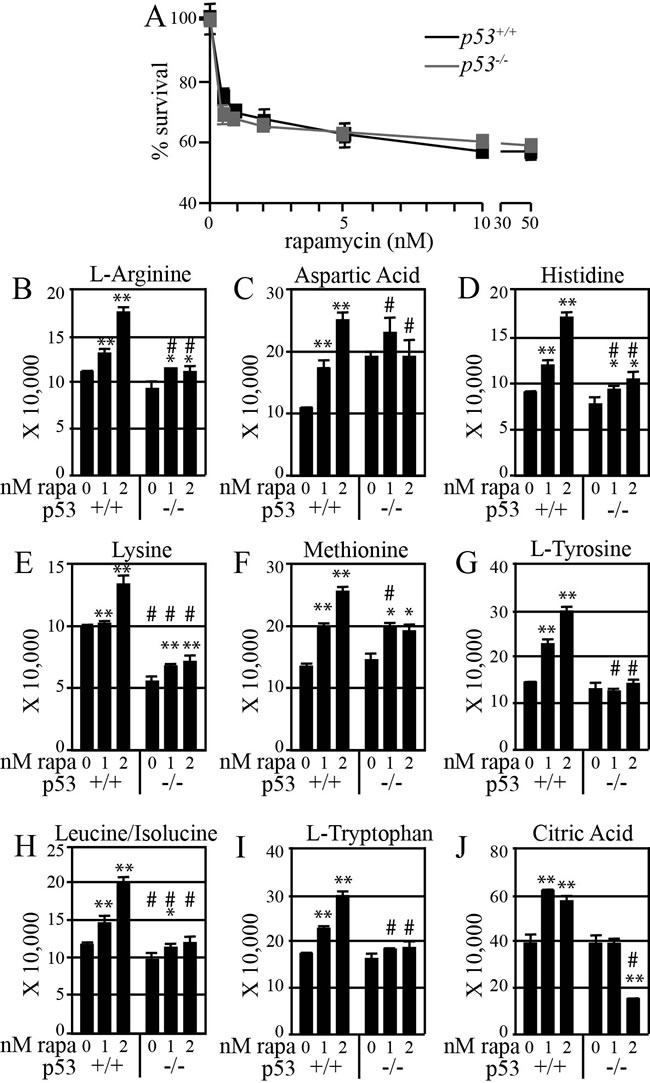
Figure 3: Rapamycin more effectively increases amino acid levels in mouse ES cells with functional p53. (A) Cell proliferation curve to find physiological rapamycin doses that are at the threshold concentration needed to impair cell proliferation. ES cells were treated for 48 hours with the indicated rapamycin concentrations (0-100 nM). Relative cell numbers were determined using MTT. In order to allow for the increased mitotic index in p53-/- cells, values are plotted as a percentage of the control (0 nM rapamycin) for each cell type. (B-I) Amino acids. Note that rapamycin at 1 and 2 nM progressively increased the level of all amino acids. (J) Citric acid. Rapamycin exposed cells compared to unexposed wild type cells: * p<0.05, ** p<0.01. Mutant cell compared to wild type cells at a given rapamycin dose: # p<0.05.
DISCUSSION
We provide three lines of evidence that support the notion that p53 and rapamycin are additive. First, p53 enabled eRapa to extend life span in mice. Second, p53 facilitated the ability of rapamycin to suppress the IR-induced SASP in human cells. Third, p53 enabled rapamycin to elevate amino acid and citric acid levels in mouse ES cells. Thus, there appears to be an augmentative relationship between p53 and rapamycin.
We suggest that p53 and rapamycin blunt mTORC1 activity through different pathways to result in this additive relationship (Figure 4). Previous publications support this possibility. Rapamycin/FKBP12 destabilizes the mTOR complex [1] while p53 induces transcription of Sestrin 1 and 2 to activate AMPK/TSC2 inhibition of mTOR [28]. Thus, our results are consistent with these separate modes of action to blunt mTORC1 since we find that p53 and rapamycin have an additive effect in three separate experiments. Even though p53 and rapamycin appear to suppress mTOR through distinct pathways, it still remains possible that rapamycin is partly dependent on p53 for its full effect on mTOR and therefore they are not strictly additive.
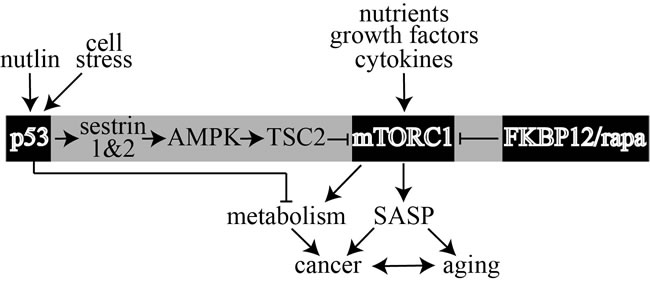
Figure 4: Model that shows rapamycin (rapa) and p53 separately antagonize mTORC1 through two distinct pathways to influence cancer, SASP and metabolism. This model supports the possibility that p53 agonists like nutlin can enable rapamycin to further suppress mTORC1.
p53 and rapamycin are integrated to affect mouse life span
Compared to wild type, mice deficient for p53 were cancer prone [23], whereas mice that overexpress p53 were cancer resistant [24]. Rapamycin could suppress oncogenesis to extend the life span of wild type mice. In support of this possibility, 14 ppm eRapa extended the life span of several cancer-prone mouse models with wild type p53 [8, 9]. In this study, 14 ppm eRapa extended the life span of p53+/+ mice, and to a lesser degree p53+/- mice, but failed to extend the life span of p53-/- mice. By contrast, Rapatar (rapamycin in nanoformulated micelles) extended the life span of p53-/- mice (p53+/- and p53+/+ mice were not reported) [11]. Mice exposed to Rapatar appeared to have higher serum levels than mice fed 14 ppm eRapa. For example, Rapatar exposure via IV or PO resulted in >100 ng/ml blood rapamycin for 4 hours after treatment or ~200 ng/ml blood rapamycin for 8 hours after treatment, respectively. By comparison, the mean blood rapamycin concentration for our mice fed 14 ppm eRapa was 2.57 +/- 1.98 ng/ml and the maximum concentration was 7.13 ng/ml. These values might be low since we analyzed only moribund mice but in another one of our studies using 14 ppm eRapa the blood concentration was typically 32 – 51 ng/ml for healthy mice [9]. Thus, increased rapamycin concentrations appeared to overcome a defect in p53 consistent with the notion that p53 and rapamycin are additive for extending mouse life span.
p53 and rapamycin are integrated to affect SASP
p53 appears to facilitate two distinct biological outcomes that first induce, but then suppress cellular senescence [27]. The first biological outcome is a temporary cell cycle arrest (a reversible quiescent state) in response to stress [27, 53]. For example, p53 rapidly arrests cells in response to DNA damage and p53 is necessary for cellular senescence in DNA repair-defective cells [54]. Thus, the p53 mediated DNA damage response appears to promote cellular senescence in response to genotoxic stress [55]. However, this arrest is not senescence [56], but likely an intermediate step to senescence [57, 58]. While cells are arrested or in a quiescent state, p53 might actually inhibit cellular senescence [59, 60]. This possibility is consistent with our observation that p53 suppressed IR-induced SASP. p53 could suppress SASP by negatively regulating mTORC1 in response to stress [26, 27]. To support this possibility, mTORC1 drives p53-arrested cells into a permanent senescent state [61] and our data are consistent with these results since rapamycin augmented p53 suppression of the IR-induced SASP. The p53 + rapamycin-mediated reduction of SASP could suppress cancer [62]. A reduced SASP could also impact aging since the elimination of senescent cells ameliorated a variety of age-related pathologies in an early aging mouse model [63] and since eRapa ameliorated aging in wild type mice [4, 14-17]. Rapamycin also extended life span of lower organisms that do not develop cancer [19]. Thus, p53 induces biological outcomes both necessary (cell cycle arrest) and antagonistic (reduced SASP) to cellular senescence that could impact cancer and aging.
p53 and rapamycin affect amino acid levels
Although the p53 DDR (growth arrest, senescence and apoptosis) has been extensively studied, recent results suggest that other p53 activities can suppress cancer, in particular those that affect cellular metabolism [64]. To that end, we performed metabolic profiling of p53+/+ and p53-/- ES cells exposed to rapamycin. Previously, removal of amino acids was shown to suppress mTORC1, whereas an autophagy-mediated increase in amino acids was shown to reactivate mTORC1, thus, establishing a feedback loop [49, 65, 66]. We found that p53 enabled rapamycin to increase amino acid levels in ES cells. These results are consistent with the cancer-suppressive role of autophagy [67] and p53’s influence on metabolism [42] with the general outcome of antagonizing mTORC1 activity and enhancing rapamycin effectiveness.
Autophagy also promotes recycling of damaged organelles in response to nutrient depletion, which is important for cell survival, and may be anti-aging owing to the degradation of damaged organelles [3]. The increase in amino acid levels promoted by rapamycin (and augmented by p53) might be the result of mTORC1 regulation of amino acid import via increased levels of transporters such as SNAT3 [51]. In this vein, p53 tumor suppression was shown to involve cell death via ferroptosis independent of its DNA damage response [68], which involved increased ROS that was controlled by expression of SLC7A11 (a cysteine/glutamate antiporter). Rapamycin-dependent alterations of citric acid levels might also be part of a similar cell survival response. Further unraveling the complex regulatory relationships between mTORC1 and p53 in cancer and aging will be an important goal of future studies.
Therapeutic potential
Our results support the previous observations that p53 and rapamycin antagonize mTORC1 through separate modes of action. As such p53 and rapamycin appear to have an additive effect to inhibit mTORC1. This contention is relevant to the use of mTORC1 inhibitors [69] as anti-cancer therapeutics since p53 is mutated or dysfunctional in most cancers [32]. Taking this into account, mTORC1 inhibitors might be most effective early in the oncogenic process, before p53 is mutated. Our previous results support this possibility since we found that eRapa suppressed the development of tumors with wild type p53 [8, 9]. High levels of mTORC1 inhibitor might be needed to overcome cancer with p53-null mutations. Yet for those p53-dysfunctional cancers that have a functional p53 protein, mTORC1 inhibitors coupled with p53 enablers such as nutlin [53] could be a powerful combination allowing a lower dose for each (Figure 4).
materials and Methods
Mice and lifespan determination
All mouse procedures were carried out in accordance with The Guide for the Care and Use of Laboratory Animals and approved by the institutional IACUC. p53+/- mice [23] were bred in-house to generate the p53+/+, p53+/- and p53-/- littermates for testing eRapa. Littermates or closely age-matched animals of the same sex were housed together regardless of genotype. Genotyping was done as previously described [23]. The mice were allowed to live their normal lifespan and were sacrificed only when moribund (immobile and unable to reach the water bottle).
Rapamycin and control diets
Mice were started on control chow or chow containing microencapsulated rapamycin at approximately 8.5 weeks of age (median age 61 days for eudragit and rapamycin with a range of 45-73 days for eudragit and 45-72 days for eRapa). Rapamycin chow contained microencapsulated rapamycin at a concentration of 14 mg/kg food (14 ppm), which provides a dose of approximately 2.24 mg of rapamycin per kg of body weight. The control diet was identical but with empty capsules. Diets were prepared by TestDiet, Inc. (Richmond, IN), using Purina 5LG6 as the base [4].
Rapamycin blood levels
Measurement of rapamycin levels in the blood was performed by HPLC-tandem MS as previously described [4]. Blood was obtained from moribund mice prior to sacrifice when possible.
Pathology
Fixed tissues (in 10% neutralized formalin) were embedded in paraffin, sectioned at 5 μm and stained with hematoxylin-eosin. Diagnosis was determined as previously described by the Pathology core of the Barshop Institute for Longevity and Aging Studies [70-73].
Cell culture and proliferation assays
Primary human fibroblasts HCA2, BJ, WI38 and IMR90 were cultured in DMEM supplemented with 10% FBS (Corning, CellGro). The GSE22 peptide was expressed and used to inhibit p53 function as previously described [41]. Cells were treated with 12.5 nmol of rapamycin (Sigma R0395) or equal volume of DMSO for 10 days and media were refreshed every 2 days. Four replicates were assayed for each cell type and each condition. Mouse p53+/+ and p53-/- embryonic stem cells were cultured on gelatinized plates without feeder cells, as previously described [74, 75]. For cell proliferation assays, cells were plated at 1x10⁴ cells per well in 24-well plates. After 24 hr, fresh medium with rapamycin (Sigma R0395) at the indicated concentrations was added to each well. Cells were allowed to grow for an additional 48 hr before harvest; relative cell number was determined using the MTT assay [76]. Six replicates were assayed for each rapamycin concentration.
SASP quantification
Human primary fibroblasts were exposed to 10 Gy X-ray or mock irradiation, as previously described [38]. Irradiated cells were cultured for 10 days and control cells for 48 hours. Cells were harvested and RNA was extracted. cDNA was synthesized and analyzed by qPCR using the UPL system (Roche), as previously described [77]. Primers and probes were as follow:
IL-6: #45 FW 5’-gcccagctatgaactccttct-3’;RV 5’-gaaggcagcaggcaacac-3’
IL-8: #72 FW 5’-agacagcagagcacacaagc-3’;RV 5’-atggttccttccggtggt-3’
IL-1α: #6 FW 5’- ggttgagtttaagccaatcca-3’;RV 5’- tgctgacctaggcttgatga-3’
IL-5: #6 FW 5’- cactgaagaaatctttcagggaat-3’;RV 5’- ccgtctttcttctccacacttt-3’
Metabolic profiling
p53+/+ and p53-/- cells [43] were grown in 10 cm plates and treated with 0, 1 or 2nM rapamycin for 24 hours before harvest. Cell number, viability and size were determined using the Countess Automated Cell Counter (Invitrogen). Equal numbers of cells were used for each assay; 6 independent plates were assayed for each cell type and condition. The cells were extracted with ice-cold 80% aqueous methanol and maintained at -20 °C for 1 h. Subsequently, the extracts were centrifuged at 13,800 × g for 10 minutes and the supernatants were transferred for HPLC electrospray ionization-mass spectrometry (HPLC-ESI-MS) analysis. HPLC-ESI-MS analyses were conducted on a Thermo Fisher Q Exactive mass spectrometer with on-line separation by a Thermo Fisher/Dionex Ultimate 3000 HPLC. HPLC conditions were: column, Luna NH2, 3 μm, 2 x 150 mm (Phenomenex); mobile phase A, 5% acetonitrile in water containing 20 mM ammonium acetate and 20 mM ammonium hydroxide, pH 9.45; mobile phase B, acetonitrile; flow rate, 400 μL/min; gradient, 85% B to 1% B over 10 minutes and held at 1% B for 10 minutes. Data-dependent MS/MS scans were performed with one full scan followed by 6 MS/MS scans in the HCD collision cell with normalized collision energy (NCE) of 35 arbitrary units. Both positive and negative ion detection were performed through at 70,000 resolution (m/z 300). Progenesis CoMet (Nonlinear Dynamics) was used to process the raw data files to detect the metabolites that exhibit significant differences in the intensity among the different groups. Peak alignment and integration was performed and the relative abundance was generated for each metabolite among different sample types. The metabolites were identified with accurate mass through Metlin databases searching using a 5-ppm mass tolerance and manual interpretation of the MS/MS fragment patterns. The comparison with the retention times with commercially available standards was also performed for further confirmation.
Acknowledgments
We thank Vanessa Soto and Vanessa Martinez for technical support. Animals are under the expert care of Vivian Diaz and her team in the Nathan Shock Aging Animal and Longevity Core directed by Dr. Jim Nelson. The Barshop Histology Core prepared tissues for pathology. Mass spectrometry analyses were conducted in the metabolomics component of the UTHSCSA Mass Spectrometry Laboratory, supported by UTHSCSA. The Metabolomics component of the UTHSCSA Mass Spectrometry Shared Resource performed the metabolic profiling.
Funding
This work was supported by NIH grants (RC2AG036613, Project 1, ZDS and PH, and P01AG017242, Core B and Project 3, PH and JC and 1S10RR031586-01 to STW and P30 CA054174 to STW.
Conflicts of interest
Under a licensing agreement between Rapamycin Holdings, Inc. and the University of Texas Health Science Center San Antonio, Z.D. Sharp, P. Hasty, and C.B. Livi, the University is entitled to milestone payments and royalty on sales of the rapamycin formulation used in this paper.
References
1. Yip CK, Murata K, Walz T, Sabatini DM and Kang SA. Structure of the human mTOR complex I and its implications for rapamycin inhibition. Mol Cell. 2010; 38:768-774.
2. Zhou H, Luo Y and Huang S. Updates of mTOR inhibitors. Anti-cancer agents in medicinal chemistry. 2010; 10:571-581.
3. Laplante M and Sabatini DM. mTOR signaling in growth control and disease. Cell. 2012; 149:274-293.
4. Miller RA, Harrison DE, Astle CM, Baur JA, Boyd AR, de Cabo R, Fernandez E, Flurkey K, Javors MA, Nelson JF, Orihuela CJ, Pletcher S, Sharp ZD, Sinclair D, Starnes JW, Wilkinson JE, et al. Rapamycin, but not resveratrol or simvastatin, extends life span of genetically heterogeneous mice. J Gerontol A Biol Sci Med Sci. 2011; 66:191-201.
5. Hasty P. Rapamycin: the cure for all that ails. J Mol Cell Biol. 2010; 2:17-19.
6. Piselli P, Serraino D, Segoloni GP, Sandrini S, Piredda GB, Scolari MP, Rigotti P, Busnach G, Messa P, Donati D, Schena FP, Maresca MC, Tisone G, Veroux M, Sparacino V, Pisani F, et al. Risk of de novo cancers after transplantation: Results from a cohort of 7217 kidney transplant recipients, Italy 1997-2009. Eur J Cancer. 2013; 49:336-44.
7. Salgo R, Gossmann J, Schofer H, Kachel HG, Kuck J, Geiger H, Kaufmann R and Scheuermann EH. Switch to a sirolimus-based immunosuppression in long-term renal transplant recipients: reduced rate of (pre-)malignancies and nonmelanoma skin cancer in a prospective, randomized, assessor-blinded, controlled clinical trial. American journal of transplantation : official journal of the American Society of Transplantation and the American Society of Transplant Surgeons. 2010; 10:1385-1393.
8. Livi CB, Hardman RL, Christy BA, Dodds SG, Jones D, Williams C, Strong R, Bokov A, Javors MA, Ikeno Y, Hubbard G, Hasty P and Sharp ZD. Rapamycin extends life span of Rb1+/- mice by inhibiting neuroendocrine tumors. Aging (Albany NY). 2013; 5:100-110.
9. Hasty P, Livi CB, Dodds SG, Jones D, Strong R, Javors M, Fischer KE, Sloane L, Murthy K, Hubbard G, Sun L, Hurez V, Curiel TJ and Sharp ZD. eRapa restores a normal life span in a FAP mouse model. Cancer Prev Res (Phila). 2014; 7:169-178.
10. Komarova EA, Antoch MP, Novototskaya LR, Chernova OB, Paszkiewicz G, Leontieva OV, Blagosklonny MV and Gudkov AV. Rapamycin extends lifespan and delays tumorigenesis in heterozygous p53+/- mice. Aging (Albany NY). 2012; 4:719-727.
11. Comas M, Toshkov I, Kuropatwinski KK, Chernova OB, Polinsky A, Blagosklonny MV, Gudkov AV and Antoch MP. New nanoformulation of rapamycin Rapatar extends lifespan in homozygous p53-/- mice by delaying carcinogenesis. Aging (Albany NY). 2012; 4:715-22.
12. Wu Q, Kiguchi K, Kawamoto T, Ajiki T, Traag J, Carbajal S, Ruffino L, Thames H, Wistuba I, Thomas M, Vasquez KM and DiGiovanni J. Therapeutic effect of rapamycin on gallbladder cancer in a transgenic mouse model. Cancer Res. 2007; 67:3794-3800.
13. Checkley LA, Rho O, Moore T, Hursting S and DiGiovanni J. Rapamycin is a potent inhibitor of skin tumor promotion by 12-O-tetradecanoylphorbol-13-acetate. Cancer Prev Res (Phila). 2011; 4:1011-1020.
14. Harrison DE, Strong R, Sharp ZD, Nelson JF, Astle CM, Flurkey K, Nadon NL, Wilkinson JE, Frenkel K, Carter CS, Pahor M, Javors MA, Fernandez E and Miller RA. Rapamycin fed late in life extends lifespan in genetically heterogeneous mice. Nature. 2009; 460:392-395.
15. Wilkinson JE, Burmeister L, Brooks SV, Chan CC, Friedline S, Harrison DE, Hejtmancik JF, Nadon N, Strong R, Wood LK, Woodward MA and Miller RA. Rapamycin slows aging in mice. Aging Cell. 2012; 11:675-682.
16. Halloran J, Hussong SA, Burbank R, Podlutskaya N, Fischer KE, Sloane LB, Austad SN, Strong R, Richardson A, Hart MJ and Galvan V. Chronic inhibition of mammalian target of rapamycin by rapamycin modulates cognitive and non-cognitive components of behavior throughout lifespan in mice. Neuroscience. 2012; 223:102-113.
17. Lin AL, Zheng W, Halloran JJ, Burbank RR, Hussong SA, Hart MJ, Javors M, Shih YY, Muir E, Solano Fonseca R, Strong R, Richardson AG, Lechleiter JD, Fox PT and Galvan V. Chronic rapamycin restores brain vascular integrity and function through NO synthase activation and improves memory in symptomatic mice modeling Alzheimer’s disease. Journal of cerebral blood flow and metabolism : official journal of the International Society of Cerebral Blood Flow and Metabolism. 2013; 33:1412-1421.
18. Neff F, Flores-Dominguez D, Ryan DP, Horsch M, Schroder S, Adler T, Afonso LC, Aguilar-Pimentel JA, Becker L, Garrett L, Hans W, Hettich MM, Holtmeier R, Holter SM, Moreth K, Prehn C, et al. Rapamycin extends murine lifespan but has limited effects on aging. J Clin Invest. 2013; 123:3272-3291.
19. Kapahi P, Chen D, Rogers AN, Katewa SD, Li PW, Thomas EL and Kockel L. With TOR, less is more: a key role for the conserved nutrient-sensing TOR pathway in aging. Cell Metab. 2010; 11:453-465.
20. Attardi LD and Donehower LA. Probing p53 biological functions through the use of genetically engineered mouse models. Mutat Res. 2005; 576:4-21.
21. Hollstein M, Sidransky D, Vogelstein B and Harris CC. p53 mutations in human cancers. Science. 1991; 253:49-53.
22. Muller PA and Vousden KH. p53 mutations in cancer. Nat Cell Biol. 2013; 15:2-8.
23. Donehower LA, Harvey M, Slagle BL, McArthur MJ, Montgomery CA, Jr., Butel JS and Bradley A. Mice deficient for p53 are developmentally normal but susceptible to spontaneous tumours. Nature. 1992; 356:215-221.
24. Garcia-Cao I, Garcia-Cao M, Martin-Caballero J, Criado LM, Klatt P, Flores JM, Weill JC, Blasco MA and Serrano M. “Super p53” mice exhibit enhanced DNA damage response, are tumor resistant and age normally. Embo J. 2002; 21:6225-6235.
25. Horn HF and Vousden KH. Coping with stress: multiple ways to activate p53. Oncogene. 2007; 26:1306-1316.
26. Reiling JH and Sabatini DM. Stress and mTORture signaling. Oncogene. 2006; 25:6373-6383.
27. Hasty P, Sharp ZD, Curiel TJ and Campisi J. mTORC1 and p53: clash of the gods? Cell Cycle. 2013; 12:20-25.
28. Budanov AV and Karin M. p53 target genes sestrin1 and sestrin2 connect genotoxic stress and mTOR signaling. Cell. 2008; 134:451-460.
29. Parmigiani A, Nourbakhsh A, Ding B, Wang W, Kim YC, Akopiants K, Guan KL, Karin M and Budanov AV. Sestrins inhibit mTORC1 kinase activation through the GATOR complex. Cell reports. 2014; 9:1281-1291.
30. Peng M, Yin N and Li MO. Sestrins function as guanine nucleotide dissociation inhibitors for Rag GTPases to control mTORC1 signaling. Cell. 2014; 159:122-133.
31. Stambolic V, MacPherson D, Sas D, Lin Y, Snow B, Jang Y, Benchimol S and Mak TW. Regulation of PTEN transcription by p53. Mol Cell. 2001; 8:317-325.
32. Gurpinar E and Vousden KH. Hitting cancers’ weak spots: vulnerabilities imposed by p53 mutation. Trends Cell Biol. 2015.
33. Leontieva OV, Novototskaya LR, Paszkiewicz GM, Komarova EA, Gudkov AV and Blagosklonny MV. Dysregulation of the mTOR pathway in p53-deficient mice. Cancer Biol Ther. 2013; 14:1182-1188.
34. Venkatachalam S, Tyner SD, Pickering CR, Boley S, Recio L, French JE and Donehower LA. Is p53 haploinsufficient for tumor suppression? Implications for the p53+/- mouse model in carcinogenicity testing. Toxicol Pathol. 2001; 29 Suppl:147-154.
35. Miller RA, Harrison DE, Astle CM, Fernandez E, Flurkey K, Han M, Javors MA, Li X, Nadon NL, Nelson JF, Pletcher S, Salmon AB, Sharp ZD, Van Roekel S, Winkleman L and Strong R. Rapamycin-mediated lifespan increase in mice is dose and sex dependent and metabolically distinct from dietary restriction. Aging Cell. 2014; 13:468-477.
36. Saha A, Blando J, Tremmel L and DiGiovanni J. Effect of Metformin, Rapamycin and Their Combination on Growth and Progression of Prostate Tumors in HiMyc Mice. Cancer Prev Res (Phila). 2015; 8:597-606.
37. Rodier F and Campisi J. Four faces of cellular senescence. J Cell Biol. 2011; 192:547-556.
38. Coppe JP, Patil CK, Rodier F, Sun Y, Munoz DP, Goldstein J, Nelson PS, Desprez PY and Campisi J. Senescence-associated secretory phenotypes reveal cell-nonautonomous functions of oncogenic RAS and the p53 tumor suppressor. PLoS Biol. 2008; 6:2853-2868.
39. Coppe JP, Patil CK, Rodier F, Krtolica A, Beausejour CM, Parrinello S, Hodgson JG, Chin K, Desprez PY and Campisi J. A human-like senescence-associated secretory phenotype is conserved in mouse cells dependent on physiological oxygen. PLoS ONE. 2010; 5:e9188.
40. Coppe JP, Desprez PY, Krtolica A and Campisi J. The senescence-associated secretory phenotype: the dark side of tumor suppression. Annual review of pathology. 2010; 5:99-118.
41. Itahana K, Dimri GP, Hara E, Itahana Y, Zou Y, Desprez PY and Campisi J. A role for p53 in maintaining and establishing the quiescence growth arrest in human cells. J Biol Chem. 2002; 277:18206-18214.
42. Maddocks OD and Vousden KH. Metabolic regulation by p53. J Mol Med (Berl). 2011; 89:237-245.
43. Li M, He Y, Dubois W, Wu X, Shi J and Huang J. Distinct regulatory mechanisms and functions for p53-activated and p53-repressed DNA damage response genes in embryonic stem cells. Mol Cell. 2012; 46:30-42.
44. Thomson JA, Itskovitz-Eldor J, Shapiro SS, Waknitz MA, Swiergiel JJ, Marshall VS and Jones JM. Embryonic stem cell lines derived from human blastocysts. Science. 1998; 282:1145-1147.
45. Facucho-Oliveira JM, Alderson J, Spikings EC, Egginton S and St John JC. Mitochondrial DNA replication during differentiation of murine embryonic stem cells. J Cell Sci. 2007; 120:4025-4034.
46. Prigione A, Fauler B, Lurz R, Lehrach H and Adjaye J. The senescence-related mitochondrial/oxidative stress pathway is repressed in human induced pluripotent stem cells. Stem Cells. 2010; 28:721-733.
47. Varum S, Momcilovic O, Castro C, Ben-Yehudah A, Ramalho-Santos J and Navara CS. Enhancement of human embryonic stem cell pluripotency through inhibition of the mitochondrial respiratory chain. Stem Cell Res. 2009; 3:142-156.
48. Kondoh H, Lleonart ME, Bernard D and Gil J. Protection from oxidative stress by enhanced glycolysis; a possible mechanism of cellular immortalization. Histology and histopathology. 2007; 22:85-90.
49. Efeyan A, Zoncu R and Sabatini DM. Amino acids and mTORC1: from lysosomes to disease. Trends Mol Med. 2012; 18:524-533.
50. Gallinetti J, Harputlugil E and Mitchell JR. Amino acid sensing in dietary-restriction-mediated longevity: roles of signal-transducing kinases GCN2 and TOR. Biochem J. 2013; 449:1-10.
51. Gu S, Villegas CJ and Jiang JX. Differential regulation of amino acid transporter SNAT3 by insulin in hepatocytes. J Biol Chem. 2005; 280:26055-26062.
52. Gottlieb E and Vousden KH. p53 regulation of metabolic pathways. Cold Spring Harb Perspect Biol. 2010; 2:a001040.
53. Hasty P and Christy BA. p53 as an intervention target for cancer and aging. Pathobiology of aging & age related diseases. 2013; 3.
54. Li H, Mitchell JR and Hasty P. DNA double-strand breaks: A potential causative factor for mammalian aging? Mech Ageing Dev. 2008; 129:416-424.
55. Ben-Porath I and Weinberg RA. The signals and pathways activating cellular senescence. Int J Biochem Cell Biol. 2005; 37:961-976.
56. Blagosklonny MV. Cell cycle arrest is not yet senescence, which is not just cell cycle arrest: terminology for TOR-driven aging. Aging (Albany NY). 2012; 4:159-165.
57. Leontieva OV and Blagosklonny MV. Tumor promoter-induced cellular senescence: cell cycle arrest followed by geroconversion. Oncotarget. 2014; 5:12715-12727.
58. Blagosklonny MV. Cell cycle arrest is not senescence. Aging (Albany NY). 2011; 3:94-101.
59. Blagosklonny MV. Tumor suppression by p53 without apoptosis and senescence: conundrum or rapalog-like gerosuppression? Aging (Albany NY). 2012; 4:450-455.
60. Demidenko ZN, Korotchkina LG, Gudkov AV and Blagosklonny MV. Paradoxical suppression of cellular senescence by p53. Proc Natl Acad Sci U S A. 2010; 107:9660-9664.
61. Korotchkina LG, Leontieva OV, Bukreeva EI, Demidenko ZN, Gudkov AV and Blagosklonny MV. The choice between p53-induced senescence and quiescence is determined in part by the mTOR pathway. Aging (Albany NY). 2010; 2:344-352.
62. Davalos AR, Coppe JP, Campisi J and Desprez PY. Senescent cells as a source of inflammatory factors for tumor progression. Cancer Metastasis Rev. 2010; 29:273-283.
63. Baker DJ, Wijshake T, Tchkonia T, LeBrasseur NK, Childs BG, van de Sluis B, Kirkland JL and van Deursen JM. Clearance of p16Ink4a-positive senescent cells delays ageing-associated disorders. Nature. 2011; 479:232-236.
64. Li T, Kon N, Jiang L, Tan M, Ludwig T, Zhao Y, Baer R and Gu W. Tumor Suppression in the Absence of p53-Mediated Cell-Cycle Arrest, Apoptosis, and Senescence. Cell. 2012; 149:1269-1283.
65. Yu L, McPhee CK, Zheng L, Mardones GA, Rong Y, Peng J, Mi N, Zhao Y, Liu Z, Wan F, Hailey DW, Oorschot V, Klumperman J, Baehrecke EH and Lenardo MJ. Termination of autophagy and reformation of lysosomes regulated by mTOR. Nature. 2010; 465:942-946.
66. Kroemer G, Marino G and Levine B. Autophagy and the integrated stress response. Mol Cell. 2010; 40:280-293.
67. Morselli E, Galluzzi L, Kepp O, Marino G, Michaud M, Vitale I, Maiuri MC and Kroemer G. Oncosuppressive functions of autophagy. Antioxid Redox Signal. 2011; 14:2251-2269.
68. Jiang L, Kon N, Li T, Wang SJ, Su T, Hibshoosh H, Baer R and Gu W. Ferroptosis as a p53-mediated activity during tumour suppression. Nature. 2015; 520:57-62.
69. Dienstmann R, Rodon J, Serra V and Tabernero J. Picking the point of inhibition: a comparative review of PI3K/AKT/mTOR pathway inhibitors. Mol Cancer Ther. 2014; 13:1021-1031.
70. Ikeno Y, Bronson RT, Hubbard GB, Lee S and Bartke A. Delayed occurrence of fatal neoplastic diseases in ames dwarf mice: correlation to extended longevity. J Gerontol A Biol Sci Med Sci. 2003; 58:291-296.
71. Sharp ZD, Lee WH, Nikitin AY, Flesken-Nikitin A, Ikeno Y, Reddick R, Richardson AG and Nelson JF. Minimal effects of dietary restriction on neuroendocrine carcinogenesis in Rb+/- mice. Carcinogenesis. 2003; 24:179-183.
72. Bronson RT and Lipman RD. Reduction in rate of occurrence of age related lesions in dietary restricted laboratory mice. Growth Dev Aging. 1991; 55:169-184.
73. Ikeno Y, Hubbard GB, Lee S, Richardson A, Strong R, Diaz V and Nelson JF. Housing density does not influence the longevity effect of calorie restriction. J Gerontol A Biol Sci Med Sci. 2005; 60:1510-1517.
74. Hu L, Kim TM, Son MY, Kim SA, Holland CL, Tateishi S, Kim DH, Yew PR, Montagna C, Dumitrache LC and Hasty P. Two replication fork maintenance pathways fuse inverted repeats to rearrange chromosomes. Nature. 2013; 501:569-572.
75. Marple T, Li H and Hasty P. A genotoxic screen: rapid analysis of cellular dose-response to a wide range of agents that either damage DNA or alter genome maintenance pathways. Mutat Res. 2004; 554:253-266.
76. Twentyman PR and Luscombe M. A study of some variables in a tetrazolium dye (MTT) based assay for cell growth and chemosensitivity. Br J Cancer. 1987; 56:279-285.
77. Demaria M, Ohtani N, Youssef SA, Rodier F, Toussaint W, Mitchell JR, Laberge RM, Vijg J, Van Steeg H, Dolle ME, Hoeijmakers JH, de Bruin A, Hara E and Campisi J. An essential role for senescent cells in optimal wound healing through secretion of PDGF-AA. Dev Cell. 2014; 31:722-733.