
INTRODUCTION
Epithelial ovarian cancer (EOC) is the most lethal gynecologic malignancy [1]. Intratumoral heterogeneity (ITH) has been attributed to treatment failure in many human malignancies [2–4]. The divergence of cell subpopulations in tumors confers a heterogeneous genomic landscape with implications on clinical prognosis, including the acquisition of metastatic potential and chemotherapy resistance [5]. RNA-Seq provides unprecedented possibilities for genomic characterization; this technique has significantly advanced our understanding of genomic organization, including allele-specific expression, novel transcripts, and unique isoforms [6]. RNA-Seq technology may be helpful in identifying pathways and molecules that may be relevant for therapeutic intervention in EOC.
Heterogeneity is a common phenomenon of parental tumor cell lines, and highly metastatic tumor cell variants pre-exist in parental tumor cell populations [7–9]. SKOV3 cells, which were isolated from ascites of a patient with ovarian adenocarcinoma, are resistant to several cytotoxic drugs, including cisplatin [10]. In contrast, A2780 cells, which were derived from an adenocarcinoma patient prior to treatment, are sensitive to cisplatin [11]. Both of these two cell lines are popular research models for human EOC. Based on previous studies, we isolated and established two pairs of cell subclones exhibiting distinct invasive/migratory capacities that were derived from the SKOV3 and A2780 cell lines. Each pair of subclones with the same hereditary background served as a model of intra-tumor heterogeneity, and consistent findings in these two EOC cell lines provided additional convincing data. The present study aimed to investigate the disparities in gene expression between the targeted subclones using RNA-Seq. Determining the genetic and molecular events that control the distinct invasive/migratory capacities of these subclones will facilitate our understanding of EOC treatment failure and will lead to the development of more effective therapeutics.
MATERIALS AND METHODS
Materials and cell culture
The principal materials used in this study are shown in S-Table 1. Cells were cultured in RPMI-1640 supplemented with 10% fetal bovine serum (FBS) and antibiotics (100 U/ml penicillin and 100 μg/ml streptomycin) at 37°C in a humidified atmosphere in a 5% CO2 incubator.
Isolation and amplification of single-cell subclones
Limiting dilution methodology was performed as described by Chen et al. [12]. A2780 and SKOV3 cells were collected in the logarithmic growth phase, adjusted to a density of 10 cells/ml, and then seeded into 96-well plates (0.1 ml/well). Eight 96-well plates were seeded for each cell line. The 96-well plates were observed under a microscope, and wells containing a single cell were marked. Single-cell subclones proliferated to a certain density after culturing for 2–3 weeks; then, the subclones were transferred to 48-well plates. The subclones were successively transferred to 24-, 12- and 6-well plates and, finally, to culture dishes. All of the subclones were amplified, and back-up subclones were stored in liquid nitrogen.
Matrigel invasion assay and cell migration assay
Transwell insert assays and 3-(4, 5-dimethyl-2-thiazolyl)-2, 5-diphenyl-2-H-tetrazolium bromide (MTT) assays were performed to assess and compare the invasive/migratory capacities of the subclones. Polyvinylpyrrolidone-free polycarbonate (PVP-free) filters with a pore size of 8.0 μm, which were either uncoated (migration assay) or coated (invasion assay) with 50 μl of Matrigel diluted 1:3 in serum-free RPMI-1640, were placed in Transwell chambers. Cells (0.1 × 10⁶) in the logarithmic growth phase were suspended in 200 μl of serum-free RPMI-1640 and seeded in the upper chambers of Matrigel-coated Transwell plates. RPMI-1640 containing 20% FBS (600 μl) was added to the lower chamber as a chemotactic factor. Each subclone was seeded in triplicate. All of the Transwell chambers were then incubated at 37°C for 24 h. Non-invading cells that remained on the upper surface of the filter were carefully removed with a swab. The Transwell chambers were then immersed in 500 μl of culture medium containing 0.5 mg/ml MTT and were incubated in the dark at 37°C for 4 h. Then, the liquid was discarded, 500 μl of dimethyl sulfoxide (DMSO) was added, and the cells were incubated at 37°C for 10 min to fully dissolve the formazan crystals. The absorbance at 490 nm was measured using a microplate reader. Based on their absorbance values, the subclones were classified into groups exhibiting high, moderate or low invasive/migratory capacity. Groups exhibiting high or low invasive/migratory capacity were retained and re-subjected to the above test. The subclones exhibiting the highest or the lowest invasive/migratory capacity were identified based on repeated comparisons and were renamed as A-H (A2780 high), A-L (A2780 low), S-H (SKOV3 high), and S-L (SKOV3 low). To investigate the stability of the invasive/migratory potential, populations of the A-H, A-L, S-H, and S-L cells were serially passaged to approximately the thirtieth generation, and the variation in the invasive/migratory capacities of the targeted subclones was evaluated.
The selected A-H, A-L, S-H, and S-L subclones were ultimately evaluated and analyzed using the following experimental procedures.
MTT assays and growth curves
MTT assays were performed in 96-well plates. Cells (2 × 10³) were seeded in each well. Each subclone was seeded in six wells of each 96-well plate (eight 96-well plates in total). All of the 96-well plates were incubated at 37°C. One 96-well plate was removed from the incubator each day. Twenty microliters of MTT (5 mg/ml MTT in phosphate-buffered saline, PBS) was added to each well, and the plates were incubated in the dark at 37°C for 4 h. The liquid was then discarded, and 200 μl of DMSO was added to dissolve the formazan crystals. The optical density (OD) was measured at 490 nm using an enzyme-linked immunosorbent assay (ELISA) plate reader. The OD values for each subclone were recorded each day. Growth curves were plotted, and the doubling time was calculated.
Cell cycle distribution assays
The four subclones were collected in the logarithmic growth phase and counted. A minimum of (5–10) × 105 cells were washed twice with PBS, resuspended in 1 ml of cold ethanol (−20°C), and then incubated at −20°C for at least 30 min. The cells were centrifuged, and the supernatant was discarded. After the cells were washed twice with PBS, they were resuspended and stained with 500 μl of PBS solution containing 50 μg/ml propidium iodide (PI), 100 μg/ml RNase A, and 0.2% Triton X-100. The samples were incubated in the dark at 4°C for 30 min and then analyzed via flow cytometry. Approximately 20,000 cells were examined per sample. This assay was performed in triplicate.
Apoptotic rates of A-H, A-L, S-H and S-L
The apoptotic rates were measured using an Annexin V-FITC/PI Apoptosis Detection Kit. Cells were collected in the logarithmic growth phase, washed twice with cold PBS, and adjusted to a density of 1 × 10⁶/ml in 1× binding buffer. The cell suspension (100 μl) was placed in a Falcon tube and was sequentially incubated in annexin V-FITC (5 μl) followed by PI (5 μl) at 20°C–25°C in the dark for 15 min. Then, 1× binding buffer (400 μl) was added, and the samples were analyzed by flow cytometry within one hour.
RNA isolation and real-time polymerase chain reaction (RT-PCR)
The mRNA and protein levels of caspase-3, caspase-7, and Bcl-2 (apoptosis-related factors), TrkB (anoikis-related factor), and Beclin1 (autophagy-related factor) were detected. Total RNA was extracted using TRIzol reagent according to the manufacturer’s instructions, and cDNA was then synthesized using a QuantScript Reverse Transcription Kit. All of the primers are listed in S-Table 2. Real-time PCR was performed using an Applied Biosystems 7500 Real-Time PCR System and a SuperReal PreMix Kit. The results were analyzed using the 2(−ΔΔCT) comparative method [13]. Each sample was tested in triplicate.
Western blot
Cells were lysed in cold radioimmunoprecipitation assay (RIPA) buffer containing freshly added 0.01% protease inhibitor for 30 min. After the lysed cells were incubated on ice for 10 min, they were centrifuged at 12000 × g for 10 min at 4°C, and the supernatants were collected. Approximately 50 μg of total protein was denatured for 10 min at 95°C, separated on a 10–15% SDS-polyacrylamide gel, and transferred to a nitrocellulose membrane. The membrane was blocked with 5% non-fat milk in Tris-buffered saline containing 0.1% Tween-20 (TBST) for 2 h at room temperature and then incubated in primary antibodies overnight at 4°C. The primary antibodies were detected by incubating the membranes in horseradish peroxidase-conjugated secondary antibodies for 2 h at room temperature, and the signals were visualized using a SuperEnhanced Chemiluminescence Detection Kit. Details of the primary and secondary antibodies are presented in S-Table 3. Each assay was performed in triplicate.
Drug cytotoxicity assays
Cells were seeded at a density of 8,000 cells per well in 96-well plates. After the cells were incubated for 24 h, they were treated with different concentrations of cisplatin and taxol. MTT assays were performed after a 48-h incubation. Dose-response curves were then generated, and the 50% inhibitory concentration (IC50) values were calculated. Each assay was performed in triplicate.
Ovarian tumor xenograft model in nude mice
Female BALB/c nude mice (4–5 weeks-old) were maintained in micro-isolator cages. Forty mice were randomly divided into 4 groups of 10 mice each. Xenografts were established by subcutaneously injecting the mice with 1 × 10⁶ cells. The tumor volumes were estimated using the formula (width)2 × length/2. The mice were euthanized after 30 days of observation, and the tumors were harvested. All procedures were reviewed and approved by the Institutional Animal Care and Use Committee of Peking Union Medical College Hospital.
Transcriptome expression profiling
First, the library for Illumina sequencing was prepared. Briefly, 150 μg of total RNA was extracted from each sample using TRIzol reagent, according to the manufacturer’s instructions. The quality of the extracted RNA was evaluated via 1.5% agarose gel electrophoresis and PI taining. The extracted RNA was then dissolved in RNase-free water and purified using an RNeasy Mini RNA Purification Kit. Illumina-compatible libraries were constructed using a TruSeq RNA library preparation kit. Briefly, mRNA was purified from the extracted RNA using oligo-dT magnetic beads and was fragmented. First-strand cDNA was synthesized using random hexamers and reverse transcriptase. Second-strand cDNA was synthesized using high quality deoxyribo nucleotide triphos phates (dNTPs), ribonuclease H (RNase H), and DNA polymerase. Double-stranded (ds) cDNA was synthesized via PCR amplification using sequencing adaptors. Fragments of 250–500 bp were selected, subjected to 2.5% agarose gel electrophoresis, excised from the gels, and purified using a Qiagen Gel Extraction Kit. The final library was sequenced on a HiSeq™ 2000 platform (Illumina).
Second, the obtained raw reads were analyzed by trimming, filtering, and the sequences aligning to the human genome (hg19) using TopHat (version 1.3.3) [14]; Cufflinks software (version 1.2.1) [15] was used to identify the differentially expressed genes. The transcript counts were calculated to measure gene expression, and the relative transcript abundance was assessed as fragments per kilobase of exon per million fragments mapped (FPKM) using Cufflinks software (version 1.2.1) [15]. Transcripts displaying a P-value < 0.05 and a-fold change in expression > 2.0 were considered to be significantly differentially expressed.
RT-PCR and Western blot analyses were performed to validate genes that exhibited significant differential expression in the RNA-Seq data for the targeted subclones. The primers and antibodies used are shown in S-Table 2 and S-Table 3, respectively.
Statistical analysis
All statistical analyses were performed using SAS® Version 9.2 (SAS Institute, Cary, NC). All tests were 2-sided, and P < 0.05 was considered to be statistically significant. The invasive/migratory capacities, cell doubling time, and tumor volumes were compared using two-tailed independent-sample t tests. Chi-square tests or Fisher’s exact tests were performed to compare the apoptotic rates and cell cycle distribution.
RESULTS
Establishment of subclones exhibiting distinct invasive/migratory capacity
Single adherent A2780/SKOV3 cells were observed as early as 4–5 h after isolation and inoculation (Fig. 1A and 1B). Single cells began to divide, and 2–3 cells were observed in some wells of the plates 24 h after inoculation. The cell number continued to increase 4 days after inoculation. These single-cell subclones significantly differed in cell number and subclone size ten days after inoculation.
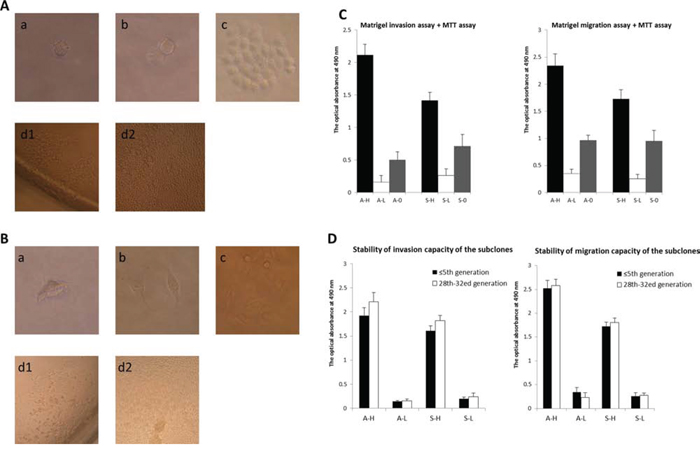
Figure 1: Isolation and establishment of subclones exhibiting distinct invasive/migratory capacity. A–B. Isolation and amplification of single-cell subclones derived from human epithelial ovarian cancer cell lines A2780 (A) and SKOV3 (B) using limited dilution methodology. Single adherent A2780/SKOV3 cells were observed as early as 4–5 h after isolation and inoculation (a). Single cells began to divide, and 2–3 cells were observed in some wells of the plates 24 h after inoculation (b). The cell number continued to increase 4 days after inoculation (c). These single-cell subclones significantly differed in cell number of and subclone size ten days after inoculation (d1and d2). C. In the Matrigel invasive/migratory assay, subclone A6 (A-H) demonstrated the highest invasive/migratory activity, and subclone A41 (A-L) displayed the weakest ability to invade and migrate through the membrane (P < 0.001 and = 0.001, respectively). The invasive/migratory abilities of A-H and A-L both were significantly different from those of their parent cell line (A-H vs. A2780: P = 0.001 and 0.002, respectively; A-L vs. A2780: P = 0.044 and 0.001, respectively). Similarly, S15 (S-H) and S4 (S-L) exhibited the most distinct invasive/migratory abilities (P = 0.001 and < 0.001, respectively) among all the SKOV3 subclones. The invasive/migratory capacities of both S-H and S-L were significantly different from those of their parent cell line (S-H vs. SKOV3: P = 0.019 and 0.018, respectively; S-H vs. SKOV3: P = 0.037 and 0.018, respectively). D. The respective invasive/migratory capacities of A-H, A-L, S-H, and S-L were not significantly altered by serial passaging to approximately the thirtieth generation. After passaging to approximately 30 generations, the difference in the invasive/migratory capacities between A-H/S-H and A-L/S-L remained significant (invasion: P = 0.015 and < 0.001, respectively; migration: P < 0.001 and < 0.001, respectively).
For the A2780 cell line, single adherent cells were observed in 258 wells of the eight 96-well plates. Of these 258 single-cell clones, 166 died and disappeared, and 16 were eliminated due to bacterial contamination. Of the remaining 76 single-cell clones, 18 died and disappeared, and 13 were subsequently eliminated due to bacterial contamination during the transfer process from 96-well plates to 48-, 24-, 12-, and 6- well plates and, ultimately, to culture dishes. For the A2780 subclones, the contamination rate was 11.2%, and the mortality rate was 80.3%. Forty-five (17.4%) cell subclones were obtained and named A1–A45. For the SKOV3 cell line, single adherent cells were observed in 288 wells of the eight 96-well plates. Of these 288 single-cell clones, 148 died and disappeared, and 20 were eliminated due to bacterial contamination. Forty (19.2%) single-cell subclones were obtained and named S1–S40.
In the Matrigel invasive/migratory assay, subclone A6 (A-H) demonstrated the highest invasive/migratory activities, and subclone A41 (A-L) displayed the weakest ability to invade and migrate through the membrane (migration: 2.118 ± 0.161 vs. 0.162 ± 0.099, P < 0.001; invasion: 2.340 ± 0.322 vs. 0.350 ± 0.082, P = 0.001; Fig. 1C).The invasive/migratory abilities of A-H and A-L both were significantly different from those of their parental cell line (A-H vs. parental: P = 0.001/0.002; A-L vs. parental: P = 0.044/0.001). Similarly, S15 (S-H) and S4 (S-L) exhibited most distinct invasive/migratory abilities (invasion: 1.416 ± 0.127 vs. 0.261 ± 0.106, P = 0.001; migration: 1.726 ± 0.168 vs. 0.254 ± 0.082, P < 0.001) among all of the SKOV3 subclones. The invasive/migratory capacities of both S-H and S-L were significantly different from those of their parental cell line (S-H vs. parental: P = 0.019/0.018; S-L vs. parental: P = 0.037/0.018). The respective invasive/migratory capacities of A-H, A-L, S-H, and S-L were not significantly altered by serial passaging to approximately the thirtieth generation (Fig. 1D). After passaging to approximately 30 generations, the difference in invasive/migratory capacities between A-H/S-H and A-L/S-L remained significant (invasion: P = 0.015/P < 0.001; migration: P < 0.001/P < 0.001). These results indicated that the selected subclones had relatively stable biological traits. However, the invasive/migratory capacities of these subclones were slightly increased following passaging for thirty generations, with the exception of the migratory capacity of A-L, which decreased slightly, possibly due to experimental error. Consequently, subclones in similar generations were used, unnecessary passaging was avoided, and subclones in no greater than the 20th generation were used in the further comparative analyses.
Heterogeneous biological functions between A-H/S-H and A-L/S-L
The MTT assay growth curves showed that A-H/S-H cells proliferated faster than A-L/S-L cells, based on a clear reduction in the doubling time (A: 25.88 ± 2.29 h vs. 59.58 ± 4.96 h, P = 0.004; S: 33.10 ± 1.19 h vs. 46.74 ± 2.31 h, P = 0.001; Fig. 2A, 2B). Cell cycle analysis indicated that the A-H and S-H subclones displayed a significant increase in the percentage of cells in S phase (A: 50.67 ± 2.78% vs. 39.31 ± 1.73%, P = 0.004; S: 49.91 ± 3.96% vs. 39.96 ± 2.62%, P = 0.022) and a concomitant decrease in the percentage of cells in G0/G1 phase (A: 44.60 ± 3.10% vs. 53.87 ± 1.94%, P = 0.012; S: 37.61 ± 3.55% vs. 51.18 ± 3.03%, P = 0.007), suggesting that the enhanced proliferation of A-H/S-H cells might be due to the activation of DNA synthesis (Fig. 2C).
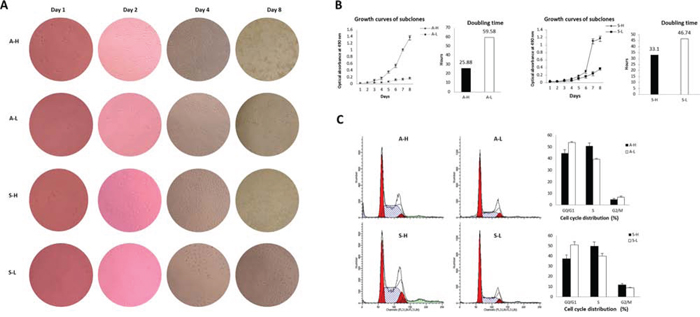
Figure 2: Distinct proliferative activities of A-H/A-L and S-H/S-L. A–B. The MTT assay growth curves showed that A-H/S-H cells proliferated faster than A-L/S-L cells, based on a clear reduction in doubling time (P = 0.004 and 0.001, respectively). C. Cell cycle analysis indicated that the A-H/S-H subclones displayed a significantly increased in the percentage of cells in S phase (P = 0.004 and 0.022, respectively) and a concomitant decreased in the percentage of cells in G0/G1 phase (P = 0.012 and 0.007, respectively), suggesting that enhanced proliferation of the A-H/S-H cells might be due to the activation of DNA synthesis.
The apoptotic rates of A-H/S-H cells were significantly lower than those of A-L/S-L cells (A: 0.57 ± 0.05% vs. 1.23 ± 0.06%, P = 0.002; S: 0.73 ± 0.05% vs. 1.17 ± 0.05%, P = 0.026; Fig. 3A). At both the mRNA and protein levels, caspase-3 and caspase-7 expression was reduced but Bcl-2 expression was increased in A-H/S-H cells (Fig. 3B). Additionally, the TrkB and Beclin1 levels were consistently high and low, respectively, in both A-H and S-H cells. Compared with their corresponding counterparts, the A-H and S-H cells exhibited significantly greater proliferative, anti-apoptotic and anti-anoikis activities. Moreover, autophagic activity was suppressed in the A-H and S-H subclones.
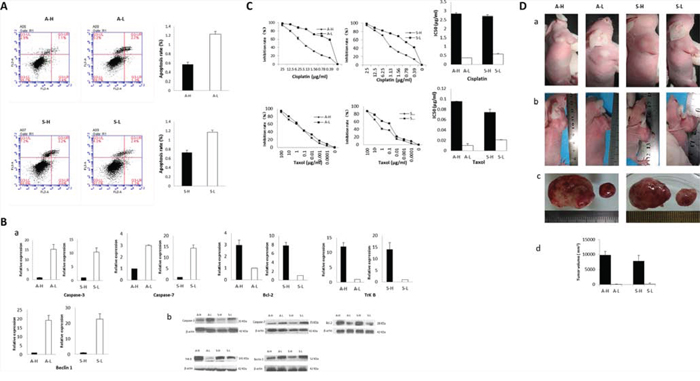
Figure 3: Heterogeneous biological activities of A-H/A-L and S-H/S-L. A–B. The apoptotic rates of A-H/S-H cell were significantly lower than those of A-L/S-L cells (P = 0.002 and 0.026, respectively; A). At both the mRNA (a) and protein levels (b), caspase-3 and caspase-7 expression was reduced, but Bcl-2 expression was increased in A-H/S-H cells (B) Additionally, the TrkB and Beclin1 levels were consistently high and low, respectively, in both A-H and S-H cells. Compared with their corresponding counterparts, the A-H and S-H cells exhibited significantly greater proliferative, anti-apoptotic and anti-anoikis activities. Autophagic activity was suppressed in the A-H and S-H subclones. C. Cell viability after cisplatin or taxol treatment was significantly inhibited in A-L/S-L cells compared with A-H/S-H cells, as demonstrated by drug cytotoxicity assays. The sublones showing higher invasive/migratory capabilities (A-H/S-H) displayed markedly higher cisplatin IC50 values (P < 0.001 and < 0.0001, respectively). Similarly, the respective taxol IC50 values of A-H and S-H cells respectively were significantly higher than those of A-L cells and S-L cells (P = 0.002 and 0.002, respectively). The sublones exhibiting higher invasive/migratory capacities were more resistant to chemotherapy. D. Effect of heterogeneous invasive/migratory capacities for tumor formation in vivo. (a): After subcutaneous injection, A-H/S-H tumors were observed much earlier than A-L/S-L tumors (5th day vs. 19th day; 7th day vs. 20th day). (b-d): On the study end date (30 days after inoculation), the tumor formation rates of both the A-H/S-H cells were 100%, and these were significantly higher than those of the A-L and S-L cells, respectively (both 20%, P = 0.008) (b). Additionally, the A-H/S-H tumors were significantly larger than the A-L/S-L tumors (A: 2.34 ± 0.23 cm vs. 0.17 ± 0.33 cm, P < 0.001; S: 2.04 ± 0.61cm vs. 0.12 ± 0.27cm, P < 0.001). The A-H/S-H cells exhibited higher capacities for in vivo tumor formation.
Cell viability after cisplatin or taxol treatment was significantly inhibited in A-L/S-L cells compared with A-H/S-H cells, as demonstrated by drug cytotoxicity assays (Fig. 3C). The subclones showing higher invasive/migratory capacities (A-H/S-H) displayed markedly higher cisplatin IC50 values (invasion: 2.83 ± 0.07 μg/ml vs. 0.37 ± 0.002 μg/ml, P < 0.001; migration: 2.70 ± 0.08 μg/ml vs. 0.58 ± 0.05 μg/ml, P < 0.001). Similarly, the respective taxol IC50 values of A-H and S-H cells were 0.095 ± 0.004 μg/ml and 0.074 ± 0.006 μg/ml, which were significantly higher than those of A-L cells (0.010 ± 0.004 μg/ml, P = 0.002) and S-L cells (0.021 ± 0.001 μg/ml, P = 0.002). The subclones exhibiting higher invasive/migratory capacities were more resistant to chemotherapy
Effect of heterogeneous invasive/migratory capacities on tumor formation in vivo
After subcutaneous injection, A-H/S-H tumors were observed much earlier than A-L/S-L tumors (5th day vs. 19th day; 7th day vs. 20th day; Fig. 3D). On the study end date (30 days after inoculation), the tumor formation rates of both the A-H and S-H cells were 100%, and these rates were significantly higher than those of the A-L and S-L cells, respectively (both 20%; P = 0.008). Additionally, the A-H/S-H tumors were significantly larger than the A-L/S-L tumors (A: 9.8 ± 1.2 cm3 vs. 0.05 ± 0.1 cm3, P < 0.001; S: 7.9 ± 1.8 cm3 vs. 0.2 ± 0.4 cm3, P < 0.001). The A-H/S-H cells exhibited higher capacities for in vivo tumor formation.
Transcriptome expression profiling according to the heterogeneous invasive/migratory capacities of human ovarian cancer cell lines
RNA-Seq was conducted on the A-H, A-L, S-H and /S-L cells. In total, approximately13.0, 12.7, 10.6 and 7.9 million raw reads with a length of 75 bp were obtained for the A-H, A-L, S-H and /S-L subclones, respectively; excluding the reads lacking an anchored oligo-dT, approximately 11.0, 11.1, 8.4 and 6.3 million reads, respectively, remained that uniquely mapped to the human nuclear genome. In total, 612 genes were significantly differentially expressed in A-H cells compared with A-L cells, and 594 genes were differentially expressed genes were identified in S-H cells compared with S-L cells (P < 0.05 and fold-change in expression >2.0; Fig. 4A, S-Table 4, and S-Table 5). Among these cell lines, the expression of 24 genes was increased and that of 7 genes was decreased in both A-H and S-H cells compared with A-L and S-L cells, respectively. Twenty-five of the 31 genes are known to be involved in cancer. To investigate the functions of these genes in signal transduction in tumor cells, Kyoto Encyclopedia of Genes and Genomes (KEGG) pathway analysis was performed, and 5 differentially expressed genes were identified, including AKT3, ECM1, LPAR1 (also known as GPCR), NR4A1 (also known as NUR77), and PRKCB. These genes participate in the phosphatidylinositol-3-OH kinase/protein kinase B (PI3K)/AKT/mTOR pathway. These 5 differentially expressed genes, together with PIK (including the PIK3CA and PIK3CD subtypes), mTOR and PTEN, which play pivotal roles in this pathway, were selected for further verification (Fig. 4B, Table 1). RT-PCR and Western blot analyses consistently confirmed that the PIK3CA, PIK3CD, AKT3, ECM1, GPCR, mTOR and PRKCB levels were increased, whereas Nur77 and PTEN levels were decreased in A-H/S-H cells compared with A-L/S-L cells (Fig. 5).
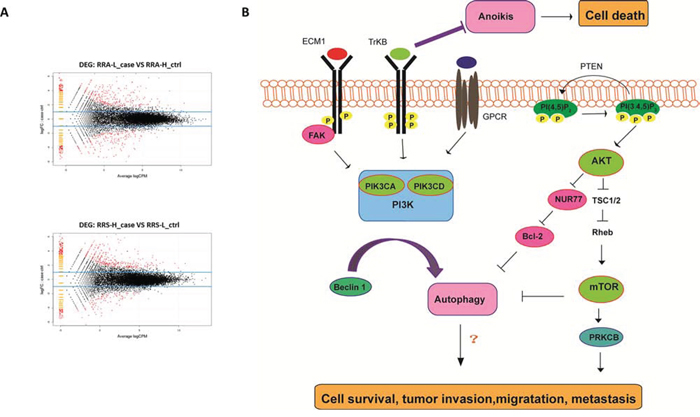
Figure 4: Transcriptome expression profiling of the A-H, A-L, S-H and S-L subclones. A. RNA-Seq was conducted on the A-H, A-L, S-H and S-L cells. In total, 612 genes were significantly differentially expressed in A-H cells compared with A-L cells, and 594 genes were differentially expressed genes were identified in S-H cells compared with S-L cells (P < 0.05 and fold change > 2.0). B. The PI3K pathway plays a pivotal role in many human malignancies [34, 35]. The extracellular matrix (ECM) activates focal adhesion kinases (FAKs), and the PI3K pathway can be activated by FAKs [37]. High ECM1 expression has been correlated with poor prognosis and metastatic potential in human carcinomas [38, 39]. The most studied type I PI3Ks include the α, β, γ and δ subtypes; mutations or abnormal expression of PI3Kα(PIK3CA) are the most commonly reported in cancer [41, 42]. PI3Kγ(PIK3CD) is activated by only stimulated G-protein coupled receptor (GPCR) [43]. The survival mechanism initiated via PI3K is primarily activated through AKT. Increased AKT activation exerts anti-apoptotic effect, antagonizes cell cycle arrest, modulates angiogenesis, and activates mRNA translation via mTOR signaling [50]. P-TEN inhibits PI3K pathway activity [51, 52]. Under the regulation of AKT, Nur77 induces a conformational change in Bcl-2 and promotes apoptosis [54]. Additionally, PKC is located in downstream of mTOR. The β isoform of PKC (PRKCB) might play significant roles in promoting human breast cancers growth [55, 56].
Table 1: The co-existing differentially expressed genes with known roles in cancer between A-H/S-H and A-L/S-L
Gene |
Gene ID |
Differential expression |
P value |
||
A-H/S-H |
A-L/S-L |
A-H VS A-L |
S-H VS S-L |
||
AKT3 |
NM_005465.4 |
↑ |
↓ |
0.012 |
0.000 |
CA12 |
NM_001218 |
↑ |
↓ |
0.011 |
0.031 |
COL24A1 |
NM_152890 |
↓ |
↑ |
0.001 |
0.011 |
CYSLTR2 |
NM_020377 |
↑ |
↓ |
0.005 |
0.017 |
DAPK2 |
NM_014326 |
↑ |
↓ |
0.012 |
0.028 |
ECM1 |
NM_004425.3 |
↑ |
↓ |
0.004 |
0.048 |
FAM129A |
NM_052966 |
↓ |
↑ |
0.001 |
0.014 |
H19 |
NR_002196 |
↑ |
↓ |
0.002 |
0.048 |
HAS3 |
NM_001199280 |
↑ |
↓ |
0.038 |
0.027 |
HLF |
NM_002126 |
↑ |
↓ |
0.021 |
0.012 |
IGFBP3 |
NM_000598 |
↑ |
↓ |
0.013 |
0.000 |
GPCR |
NM_0117195 |
↑ |
↓ |
0.047 |
0.013 |
NUR77 |
NM_001202233 |
↑ |
↓ |
0.005 |
0.015 |
NRTN |
NM_004558 |
↑ |
↓ |
0.015 |
0.027 |
PIK3IP1 |
NM_001135911 |
↑ |
↓ |
0.000 |
0.021 |
PLXDC2 |
NM_032812.8 |
↓ |
↑ |
0.000 |
0.000 |
PRKCB |
NM_002738.6 |
↑ |
↓ |
0.023 |
0.002 |
RAB40AL |
NM_001031834 |
↓ |
↑ |
0.009 |
0.042 |
RASSF5 |
NM_182663 |
↑ |
↓ |
0.046 |
0.048 |
RGCC |
NM_014059 |
↑ |
↓ |
0.048 |
0.001 |
RYR2 |
NM_001035 |
↑ |
↓ |
0.000 |
0.000 |
S1PR3 |
NM_005226 |
↓ |
↑ |
0.004 |
0.014 |
SLC8A1 |
NM_001112800 |
↑ |
↓ |
0.049 |
0.036 |
TJP3 |
NM_001267560 |
↑ |
↓ |
0.007 |
0.000 |
WNT11 |
NM_004626 |
↑ |
↓ |
0.002 |
0.048 |
Note: ↑ increase; ↓ decrease;
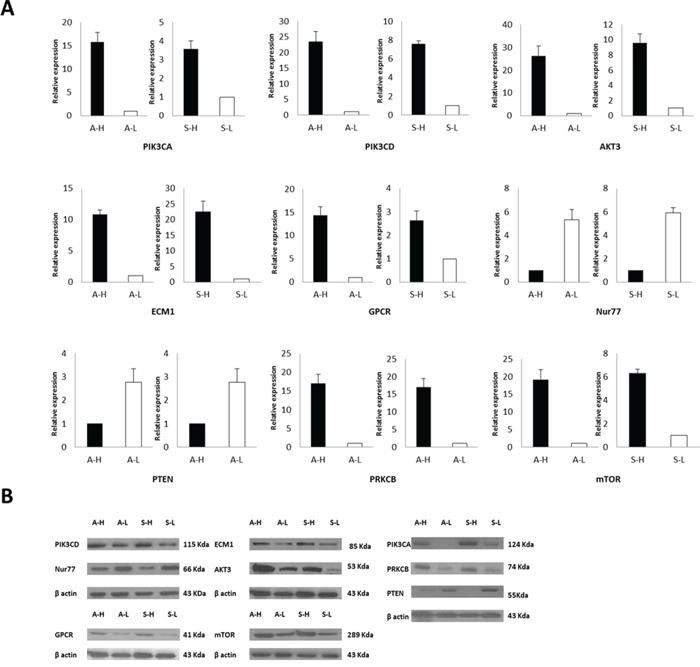
Figure 5: The PI3K/AKT/mTOR pathway is a potential predictor of distinct invasive and migratory capabilities in human ovarian cancer cell lines. RT-PCR A. and Western blot analyses B. consistently confirmed that PIK3CA, PIK3CD, AKT3, ECM1, GPCR, mTOR and PRKCB expression was increased but that Nur77 and PTEN expression was decreased in A-H/S-H cells compared with A-L/S-L cells. PI3K/AKT/mTOR pathway Activation was associated with enhanced invasive and migratory capacities in human ovarian cancer cell lines.
DISCUSSION
Accumulating evidence in the literature [16, 17] and from our previous studies [18, 19] has demonstrated that tumor heterogeneity exists in EOC. In this study, using limiting dilution methodology and routine culture conditions, 45 subclones were isolated and established from the A2780 cell line, and 40 subclones were acquired from the SKOV3 cell line. A-H/S-H and A-L/S-L cells were identified as exhibiting the highest and lowest invasive and migratory capacities, respectively. The existence of heterogeneous subpopulations within one tumor cell line was validated.
Tumor cells must acquire the migration ability to invade tissues or vessels. Human tumors are heterogeneous; a selective advantage of the collective invasion of tumor cells could be that cell clones with different properties such as active proliferative, migratory and survival abilities could collaborate and support each other to metastasize successfully [20]. The present study demonstrated that subclones displaying high invasive and migratory capacities exhibited more aggressive phenotypes. A-H and S-H cells proliferated significantly faster, had a shorter doubling time, and included a larger proportion of cells in S phase compared with their corresponding counterparts. The apoptotic rates of A-H and S-H cells were notably lower than those of A-L and S-L cells. At both the mRNA and protein levels, reduced expression of caspase-3 and caspase-7 (pro-apoptotic factors [21]) and increased expression of Bcl-2 (an anti-apoptotic factor [22]) were observed in A-H/S-H cells. Overall, A-H/S-H cells exhibited enhanced proliferative and anti-apoptotic activities.
Anoikis can hamper metastasis by inducing apoptosis when tumor cells enter foreign environments. Anoikis tolerance is a prerequisite for tumor metastasis [23]. TrkB, a neurotrophic tyrosine kinase receptor, is a potent and specific suppressor of anoikis that activates the PI3K/PKB pathway [24, 25]. TrkB is frequently over-expressed in ovarian cancer and in other human cancers, particularly those with aggressive behavior and a poor prognosis [23, 26]. Our data showed that TrkB was over-expressed in the subclones exhibiting high invasive and migratory capacities. These findings illustrate the feasibility of using anoikis suppression as a functional property to identify metastasis-associated oncogenes and highlight its potential use in high-throughput screens for TrkB-inhibitory cancer therapeutics [25].
Autophagy is an evolutionarily conserved protein degradation pathway in eukaryotes and is essential for cell survival under nutrient-limited conditions [27]. The exact role of autophagy in cancer is complex and paradoxical, varying in distinct tumor types and stages, as well as in separate regions of the same tumor [28, 29]. Beclin1 recruits proteins from the cytosol for autophagic degradation and supplies the autophagic pathway with membrane components. Beclin 1 expression is directly correlates with autophagosome formation [30]. In addition to interacting with PI3K, Beclin 1 binds to the Bcl-2 family members Bcl-2 and Bcl-xL [31]. Thus, autophagy is often activated together with apoptosis in response to stress. Beclin1 is monoallelically deleted in human ovarian, breast and prostate cancers [32, 33]. In the present study, Beclin1 expression was decreased in subclones exhibiting high invasive/migratory capability. The synergy between autophagic defects and altered apoptotic activity might facilitate malignant differentiation and a more aggressive EOC phenotype.
In addition to enhanced proliferative, anti-apoptotic and anti-anoikis activities and suppressed autophagic activity, A-H/S-H cells exhibited significant resistance to cisplatin and taxol in vitro and a higher capacity for tumor formation in vivo compared with A-L/S-L cells. The subclones displaying high invasive and migratory capacities showed significantly greater anchorage-independent growth viability.
The PI3K/AKT/mTOR pathway is a potential predictor of invasive/migratory capacity in human ovarian cancer cell lines
In the two pairs of targeted subclones, 5 of the differentially expressed genes revealed via RNA-Seq, i.e., ECM1, GPCR, NUR 77, AKT (AKT3) and PKC (PRKCB), are PI3K/AKT/mTOR pathway components. The PI3K pathway is involved in stimulating cell proliferation and migration and in inhibiting apoptosis; additionally, this pathway plays a pivotal role in many human malignancies [34–36]. The extracellular matrix (ECM), a series of glycosylated proteins that are secreted extracellularly, activates focal adhesion kinases (FAKs), and FAK activity is primarily are mediated by integrins. The PI3K pathway can be activated by FAKs [37]. High ECM1 expression has been correlated with poor prognosis and metastatic potential in human carcinomas [38, 39]. PI3K is the central link in the PI3K/AKT pathway; therefore, PI3K plays a crucial role in this pathway. The most studied type I PI3Ks include the α, β, γ and δ subtypes [40]; mutations or abnormal expression of PI3Kα (PIK3CA) are most commonly reported in cancer [41, 42]. PI3Kγ (PIK3CD) is activated by only stimulated G-protein coupled receptors (GPCRs) [43], and its role in cancer is controversial [44, 45]. Xie et al. [46] demonstrated that increased PI3Kγ activity propagates the metastatic signal initiated by GPCRs in breast cancer cells.
The survival mechanism initiated via PI3K is primarily activated through AKT. Increased AKT activation has been noted observed in high-grade and late-stage serous ovarian cancer [47–49], in which AKT exerts anti-apoptotic effects, antagonizes cell cycle arrest, modulates angiogenesis, and activates mRNA translation via mTOR signaling [50]. P-TEN, a candidate tumor-suppressor gene, inhibits PI3K pathway activity [51, 52]. An activating PIK3CA mutation coupled with PTEN loss is sufficient to initiate ovarian tumorigenesis in mice [53]. Under the regulation of AKT, the orphan nuclear receptor Nur77 induces a conformational change in Bcl-2 and promotes apoptosis [54]. Additionally, PKC is located downstream of mTOR. The β isoforms of PKC (PRKCB) might play significant roles in promoting human breast cancer growth [55, 56].
Briefly, the 5 differentially expressed genes that were identified by RNA-Seq, as well as PIK (PIK3CA and PIK3CD subtypes), mTOR and PTEN, which function in the PI3K/AKT/mTOR pathway, were selected for further validation of the RNA-Seq results. RT-PCR and Western blot analyses consistently confirmed that PIK3CA, PIK3CD, AKT3, ECM1, GPCR, mTOR and PRKCB expression was increased but that Nur77 and PTEN expression was decreased in A-H/S-H cells compared with A-L/S-L cells. PI3K/AKT/mTOR pathway activation was associated with enhanced invasive and migratory capacities in human ovarian cancer cell lines.
CONCLUSIONS
Heterogeneous cell subpopulations exhibiting distinct invasive and migratory capacities co-exist within human ovarian cancer cell lines. The subclones displaying higher invasive and migratory capacities exhibit significantly increased independent viability, which might play an important role in tumor metastasis and chemotherapeutic resistance. PI3K/AKT/mTOR pathway activation is associated with higher invasive and migratory capacities in subpopulations of human ovarian cancer cell lines. Inhibiting this pathway may be useful for the chemoprevention or treatment of EOC.
CONFLICTS OF INTEREST
The authors have no conflict of interest to declare.
ACKNOWLEDGMENTS AND GRANT SUPPORT
This work is supported by National Natural Science Foundation of China (No 81172482) and National High Technology Research and Development Program of China (No 2012AA02A507).
REFERENCES
1. Ferlay J, Soerjomataram I, Dikshit R, Eser S, Mathers C, Rebelo M, Parkin DM, Forman D, Bray F. Cancer incidence and mortality worldwide: Sources, methods and major patterns in GLOBOCAN 2012. International journal of cancer Journal international du cancer. 2015; 136:E359–386.
2. McAlpine JN, Eisenkop SM, Spirtos NM. Tumor heterogeneity in ovarian cancer as demonstrated by in vitro chemoresistance assays. Gynecologic oncology. 2008; 110:360–364.
3. Gerlinger M, Swanton C. How Darwinian models inform therapeutic failure initiated by clonal heterogeneity in cancer medicine. British journal of cancer. 2010; 103:1139–1143.
4. Gerlinger M, Rowan AJ, Horswell S, Larkin J, Endesfelder D, Gronroos E, Martinez P, Matthews N, Stewart A, Tarpey P, Varela I, Phillimore B, Begum S, McDonald NQ, Butler A, Jones D, et al. Intratumor heterogeneity and branched evolution revealed by multiregion sequencing. The New England journal of medicine. 2012; 366:883–892.
5. Nguyen HG, Ravid K. Tetraploidy/aneuploidy and stem cells in cancer promotion: The role of chromosome passenger proteins. Journal of cellular physiology. 2006; 208:12–22.
6. Han SS, Kim WJ, Hong Y, Hong SH, Lee SJ, Ryu DR, Lee W, Cho YH, Lee S, Ryu YJ, Won JY, Rhee H, Park JH, Jang SJ, Lee JS, Choi CM, et al. RNA sequencing identifies novel markers of non-small cell lung cancer. Lung cancer (Amsterdam, Netherlands). 2014; 84:229–235.
7. Fidler IJ, Kripke ML. Metastasis results from preexisting variant cells within a malignant tumor. Science (New York, NY). 1977; 197:893–895.
8. Keenan J, Joyce H, Aherne S, O’Dea S, Doolan P, Lynch V, Clynes M. Olfactomedin III expression contributes to anoikis-resistance in clonal variants of a human lung squamous carcinoma cell line. Experimental cell research. 2012; 318:593–602.
9. Tanaka T, Kuramitsu Y, Fujimoto M, Naito S, Oka M, Nakamura K. Downregulation of two isoforms of ubiquitin carboxyl-terminal hydrolase isozyme L1 correlates with high metastatic potentials of human SN12C renal cell carcinoma cell clones. Electrophoresis. 2008; 29:2651–2659.
10. Leopoldt D, Hanck T, Exner T, Maier U, Wetzker R, Nurnberg B. Gbetagamma stimulates phosphoinositide 3-kinase-gamma by direct interaction with two domains of the catalytic p110 subunit. The Journal of biological chemistry. 1998; 273:7024–7029.
11. Godwin AK, Meister A, O’Dwyer PJ, Huang CS, Hamilton TC, Anderson ME. High resistance to cisplatin in human ovarian cancer cell lines is associated with marked increase of glutathione synthesis. Proceedings of the National Academy of Sciences of the United States of America. 1992; 89:3070–3074.
12. Chen J, Zhang J, Zhao Y, Li J, Fu M. Integrin beta3 down-regulates invasive features of ovarian cancer cells in SKOV3 cell subclones. Journal of cancer research and clinical oncology. 2009; 135:909–917.
13. Livak KJ, Schmittgen TD. Analysis of relative gene expression data using real-time quantitative PCR and the 2(-Delta Delta C(T)) Method. Methods (San Diego, Calif). 2001; 25:402–408.
14. Trapnell C, Pachter L, Salzberg SL. TopHat: discovering splice junctions with RNA-Seq. Bioinformatics (Oxford, England). 2009; 25:1105–1111.
15. Trapnell C, Williams BA, Pertea G, Mortazavi A, Kwan G, van Baren MJ, Salzberg SL, Wold BJ, Pachter L. Transcript assembly and quantification by RNA-Seq reveals unannotated transcripts and isoform switching during cell differentiation. Nature biotechnology. 2010; 28:511–515.
16. Zborovskaya I, Gasparian A, Karseladze A, Elcheva I, Trofimova E, Driouch K, Trassard M, Tatosyan A, Lidereau R. Somatic genetic alterations (LOH) in benign, borderline and invasive ovarian tumours: intratumoral molecular heterogeneity. International journal of cancer Journal international du cancer. 1999; 82:822–826.
17. Khalique L, Ayhan A, Weale ME, Jacobs IJ, Ramus SJ, Gayther SA. Genetic intra-tumour heterogeneity in epithelial ovarian cancer and its implications for molecular diagnosis of tumours. The Journal of pathology. 2007; 211:286–295.
18. Gui T, Bai H, Zeng J, Zhong Z, Cao D, Cui Q, Chen J, Yang J, Shen K. Tumor heterogeneity in the recurrence of epithelial ovarian cancer demonstrated by polycomb group proteins. OncoTargets and therapy. 2014; 7:1705–1716.
19. Zeng J, Ruan J, Luo L, Shi J, Cui Q, Yang J, Shen K. Molecular portraits of heterogeneity related to cancer stem cells in human ovarian cancer. International journal of gynecological cancer : official journal of the International Gynecological Cancer Society. 2014; 24:29–35.
20. Geiger TR, Peeper DS. Metastasis mechanisms. Biochimica et biophysica acta. 2009; 1796:293–308.
21. Shin S, Sung BJ, Cho YS, Kim HJ, Ha NC, Hwang JI, Chung CW, Jung YK, Oh BH. An anti-apoptotic protein human survivin is a direct inhibitor of caspase-3 and -7. Biochemistry. 2001; 40:1117–1123.
22. Brenner C, Cadiou H, Vieira HL, Zamzami N, Marzo I, Xie Z, Leber B, Andrews D, Duclohier H, Reed JC, Kroemer G. Bcl-2 and Bax regulate the channel activity of the mitochondrial adenine nucleotide translocator. Oncogene. 2000; 19:329–336.
23. Yu X, Liu L, Cai B, He Y, Wan X. Suppression of anoikis by the neurotrophic receptor TrkB in human ovarian cancer. Cancer science. 2008; 99:543–552.
24. Liotta LA, Kohn E. Anoikis: cancer and the homeless cell. Nature. 2004; 430:973–974.
25. Douma S, Van Laar T, Zevenhoven J, Meuwissen R, Van Garderen E, Peeper DS. Suppression of anoikis and induction of metastasis by the neurotrophic receptor TrkB. Nature. 2004; 430:1034–1039.
26. Nakagawara A, Azar CG, Scavarda NJ, Brodeur GM. Expression and function of TRK-B and BDNF in human neuroblastomas. Molecular and cellular biology. 1994; 14:759–767.
27. Berry DL, Baehrecke EH. Autophagy functions in programmed cell death. Autophagy. 2008; 4:359–360.
28. Galluzzi L, Morselli E, Kepp O, Maiuri MC, Kroemer G. Defective autophagy control by the p53 rheostat in cancer. Cell cycle (Georgetown, Tex). 2010; 9:250–255.
29. Liu EY, Ryan KM. Autophagy and cancer—issues we need to digest. Journal of cell science. 2012; 125:2349–2358.
30. Itakura E, Mizushima N. Atg14 and UVRAG: mutually exclusive subunits of mammalian Beclin 1-PI3K complexes. Autophagy. 2009; 5:534–536.
31. Liang XH, Yu J, Brown K, Levine B. Beclin 1 contains a leucine-rich nuclear export signal that is required for its autophagy and tumor suppressor function. Cancer research. 2001; 61:3443–3449.
32. Liang XH, Jackson S, Seaman M, Brown K, Kempkes B, Hibshoosh H, Levine B. Induction of autophagy and inhibition of tumorigenesis by beclin 1. Nature. 1999; 402:672–676.
33. Aita VM, Liang XH, Murty VV, Pincus DL, Yu W, Cayanis E, Kalachikov S, Gilliam TC, Levine B. Cloning and genomic organization of beclin 1, a candidate tumor suppressor gene on chromosome 17q21. Genomics. 1999; 59:59–65.
34. Toker A, Yoeli-Lerner M. Akt signaling and cancer: surviving but not moving on. Cancer research. 2006; 66:3963–3966.
35. Vanhaesebroeck B, Guillermet-Guibert J, Graupera M, Bilanges B. The emerging mechanisms of isoform-specific PI3K signalling. Nature reviews Molecular cell biology. 2010; 11:329–341.
36. Li H, Zeng J, Shen K. PI3K/AKT/mTOR signaling pathway as a therapeutic target for ovarian cancer. Archives of gynecology and obstetrics. 2014; 290:1067–1078.
37. Armulik A, Velling T, Johansson S. The integrin beta1 subunit transmembrane domain regulates phosphatidylinositol 3-kinase-dependent tyrosine phosphorylation of Crk-associated substrate. Molecular biology of the cell. 2004; 15:2558–2567.
38. Lal G, Hashimi S, Smith BJ, Lynch CF, Zhang L, Robinson RA, Weigel RJ. Extracellular matrix 1 (ECM1) expression is a novel prognostic marker for poor long-term survival in breast cancer: a Hospital-based Cohort Study in Iowa. Annals of surgical oncology. 2009; 16:2280–2287.
39. Wu QW, She HQ, Liang J, Huang YF, Yang QM, Yang QL, Zhang ZM. Expression and clinical significance of extracellular matrix protein 1 and vascular endothelial growth factor-C in lymphatic metastasis of human breast cancer. BMC cancer. 2012; 12:47.
40. Cantley LC. The phosphoinositide 3-kinase pathway. Science (New York, NY). 2002; 296:1655–1657.
41. Yuan TL, Cantley LC. PI3K pathway alterations in cancer: variations on a theme. Oncogene. 2008; 27:5497–5510.
42. Karakas B, Bachman KE, Park BH. Mutation of the PIK3CA oncogene in human cancers. British journal of cancer. 2006; 94:455–459.
43. Vanhaesebroeck B, Waterfield MD. Signaling by distinct classes of phosphoinositide 3-kinases. Experimental cell research. 1999; 253:239–254.
44. Edling CE, Selvaggi F, Buus R, Maffucci T, Di Sebastiano P, Friess H, Innocenti P, Kocher HM, Falasca M. Key role of phosphoinositide 3-kinase class IB in pancreatic cancer. Clinical cancer research : an official journal of the American Association for Cancer Research. 2010; 16:4928–4937.
45. Brazzatti JA, Klingler-Hoffmann M, Haylock-Jacobs S, Harata-Lee Y, Niu M, Higgins MD, Kochetkova M, Hoffmann P, McColl SR. Differential roles for the p101 and p84 regulatory subunits of PI3Kgamma in tumor growth and metastasis. Oncogene. 2012; 31:2350–2361.
46. Xie Y, Abel PW, Kirui JK, Deng C, Sharma P, Wolff DW, Toews ML, Tu Y. Identification of upregulated phosphoinositide 3-kinase gamma as a target to suppress breast cancer cell migration and invasion. Biochemical pharmacology. 2013; 85:1454–1462.
47. Bast RC, Hennessy B, Mills GB. The biology of ovarian cancer: new opportunities for translation. Nature reviews Cancer. 2009; 9:415–428.
48. Levanon K, Crum C, Drapkin R. New insights into the pathogenesis of serous ovarian cancer and its clinical impact. Journal of clinical oncology: official journal of the American Society of Clinical Oncology. 2008; 26:5284–5293.
49. Hanrahan AJ, Schultz N, Westfal ML, Sakr RA, Giri DD, Scarperi S, Janakiraman M, Olvera N, Stevens EV, She QB, Aghajanian C, King TA, Stanchina E, Spriggs DR, Heguy A, Taylor BS, et al. Genomic complexity and AKT dependence in serous ovarian cancer. Cancer discovery. 2012; 2:56–67.
50. Shaw RJ, Cantley LC. Ras, PI(3)K and mTOR signalling controls tumour cell growth. Nature. 2006; 441:424–430.
51. Myers MP, Stolarov JP, Eng C, Li J, Wang SI, Wigler MH, Parsons R, Tonks NK. P-TEN, the tumor suppressor from human chromosome 10q23, is a dual-specificity phosphatase. Proceedings of the National Academy of Sciences of the United States of America. 1997; 94:9052–9057.
52. Li J, Yen C, Liaw D, Podsypanina K, Bose S, Wang SI, Puc J, Miliaresis C, Rodgers L, McCombie R, Bigner SH, Giovanella BC, Ittmann M, Tycko B, Hibshoosh H, Wigler MH, et al. PTEN, a putative protein tyrosine phosphatase gene mutated in human brain, breast, and prostate cancer. Science (New York, NY). 1997; 275:1943–1947.
53. Kinross KM, Montgomery KG, Kleinschmidt M, Waring P, Ivetac I, Tikoo A, Saad M, Hare L, Roh V, Mantamadiotis T, Sheppard KE, Ryland GL, Campbell IG, Gorringe KL, Christensen JG, Cullinane C, et al. An activating Pik3ca mutation coupled with Pten loss is sufficient to initiate ovarian tumorigenesis in mice. The Journal of clinical investigation. 2012; 122:553–557.
54. Lin B, Kolluri SK, Lin F, Liu W, Han YH, Cao X, Dawson MI, Reed JC, Zhang XK. Conversion of Bcl-2 from protector to killer by interaction with nuclear orphan receptor Nur77/TR3. Cell. 2004; 116:527–540.
55. Ali S, Al-Sukhun S, El-Rayes BF, Sarkar FH, Heilbrun LK, Philip PA. Protein kinases C isozymes are differentially expressed in human breast carcinomas. Life sciences. 2009; 84:766–771.
56. Li H, Weinstein IB. Protein kinase C beta enhances growth and expression of cyclin D1 in human breast cancer cells. Cancer research. 2006; 66:11399–11408.