
INTRODUCTION
Colorectal cancer (CRC) is one of the most common malignancies in the United States and worldwide [1]. Three characteristics have been implicated in CRC tumorigenesis: chromosomal instability (CIN), microsatellite instability (MSI), and the CpG island methylator phenotype (CIMP) [2]. CRC can evolve through the classical adenoma-carcinoma sequence or the alternative serrated pathway [3]. The genetic basis of sporadic CRC has been an intensely studied topic in the field of cancer biology over the past three decades [4]. The adenoma–carcinoma sequence is the main pathway for CRC development and is characterized by carcinoma with microsatellite stability (MSS) and CIN. The consequence of CIN may be a higher frequency of loss of heterozygosity (LOH) [5]. In this pathway, an ordered series of events occurs, starting with the transformation of normal epithelium into aberrant crypt foci and followed by the development of transitional adenoma and finally adenocarcinoma [6]. This progression involves the initial inactivating mutation in the APC gene, sequential activating mutations in the KRAS and PIK3CA genes and inactivating mutations in the DCC, SMAD2/SMAD4 and TP53 genes at different stages of tumorigenesis [5–9].
CRC encompasses a heterogeneous group of diseases that may arise from epigenetic alterations as well [10]. MSI occurs in approximately 15% of sporadic CRCs, usually through the serrated pathway [11–13]. The CIMP develops early in this sequence, and CIMP tumors seem to be strongly associated with the BRAF V600E mutation [13–17]. Unlike Lynch syndrome, sporadic carcinoma with MSI arises as a result of the inactivation of DNA mismatch repair (MMR) genes, such as MLH1, through promoter hypermethylation [5].
DNA methylation is the major epigenetic mechanism responsible for X-chromosome inactivation, imprinting, and the repression of endogenous retroviruses [18, 19]. It is well established that genome-wide hypomethylation occurs in tumors, and the overexpression of oncogenes has been suggested to be the result of this hypomethylation [20–23]. The human genome contains transcriptionally inactive non-coding DNA elements, including long interspersed nuclear element-1 (LINE-1) repetitive sequences [24–26].
LINE-1 contains numerous CpG dinucleotides, and studies have shown that the level of LINE-1 methylation is a good indicator of cellular 5-methylcytosine levels (i.e., global DNA methylation levels) [27–29]. Hypomethylation of global LINE-1 DNA elements is associated with CIN [30, 31]. LINE-1 hypomethylation in the normal mucosa of CRC patients has been observed and reported to be significantly associated with poor prognosis [23, 32]. Thus, the hypomethylation of LINE-1 in adjacent normal mucosa may play an important role in forming a “field defect” and in influencing the progression of colorectal carcinogenesis [27, 33–36].
This study aimed to first investigate the clinicopathological characteristics and molecular alterations, including genetic and epigenetic changes, in Chinese patients with sporadic colon cancer at a single center. Second, we sought to determine the prognostic variables for colon cancer-specific survival (CCSS). Finally, we aimed to determine whether LINE-1 hypomethylation in the adjacent normal mucosa constitutes a methylation “field defect”, which may influence patient survival.
RESULTS
Patient characteristics
A total of 127 patients, 83 males and 44 females, were included in the present study. These patients completed a median follow-up of 65 (3–85) months. The patient characteristics and clinicopathological features are presented in Table 1.
Table 1: Patients’ characteristics
Clinicopathological variables |
N |
% |
|
Sex |
Male |
83 |
65.4 |
Female |
44 |
34.6 |
|
Age (years) |
≤60 |
62 |
48.8 |
>60 |
65 |
51.2 |
|
Maximum Size (cm) |
≤5 |
80 |
63.0 |
>5 |
47 |
37.0 |
|
Gross Shape |
Ulcerative type |
83 |
65.4 |
Protruded type |
38 |
29.9 |
|
Infiltrative type |
6 |
4.7 |
|
Locationa |
Left-sided |
56 |
44.1 |
Right-sided |
71 |
55.9 |
|
Differentiation |
G1-G2 |
78 |
61.4 |
G3-G4 |
49 |
38.6 |
|
Mucinous or signet-ring carcinoma |
No |
102 |
80.3 |
Yes |
25 |
19.7 |
|
Serum CEA level |
Normal |
78 |
61.4 |
Elevated |
49 |
38.6 |
|
Serum CA199 level |
Normal |
86 |
67.7 |
Elevated |
41 |
32.3 |
|
Tumor stage (T) |
T1 |
0 |
0.0 |
T2 |
17 |
13.4 |
|
T3 |
36 |
28.3 |
|
T4a |
65 |
51.2 |
|
T4b |
9 |
7.1 |
|
Nodal status (N) |
N0 |
68 |
53.5 |
N1a |
5 |
3.9 |
|
N1b |
20 |
15.7 |
|
N1c |
10 |
7.9 |
|
N2a |
8 |
6.3 |
|
N2b |
16 |
12.6 |
|
Distant metastases (M) |
M0 |
94 |
74.0 |
M1 |
33 |
26.0 |
|
AJCC stage |
I |
16 |
12.6 |
II |
45 |
35.4 |
|
III |
33 |
26.0 |
|
IV |
33 |
26.0 |
|
Lymphovascular invasion |
No |
85 |
66.9 |
Yes |
42 |
33.1 |
|
Perineural invasion |
No |
109 |
85.8 |
Yes |
18 |
85.8 |
|
Extranodal tumor deposits |
No |
108 |
85.0 |
Yes |
19 |
15.0 |
aThe left side of the colon consists of the splenic flexure, descending, and sigmoid colon. The right side of the colon consists of the cecum, ascending colon, hepatic flexure, and transverse colon.
Abbreviations: CEA, carcinoembryonic antigen; CA199, Carbohydrate antigen 199; AJCC, American Joint Committee on Cancer.
LINE-1 methylation levels in mucosa adjacent to the tumor nest
A mean LINE-1 methylation rate (LMR) of 64.62% (range, 9.45–86.93%; standard deviation, 11.72%) was determined by pyrosequencing. Representative results are shown in Figure 1. The LMRs in the 127 normal colonic mucosa samples were normally distributed (Kolmogorov-Smirnov Z = 0.881; p = 0.4200) (Supplementary Table S1, available online). Using the X-tile program, the patients were subgrouped into two populations based on a high or low LMR with a cutoff value of 64.47% (maximum x2 = 6.38; p = 0.15; Figure 2).
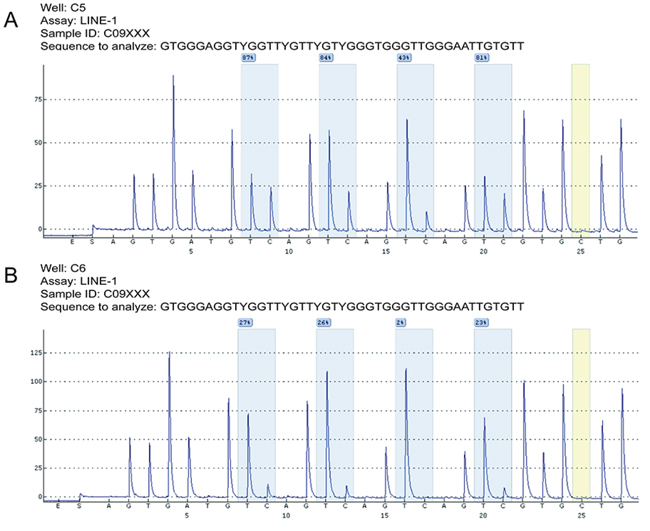
Figure 1: Representative LMR results after pyrosequencing. Bisulfite-treated DNA samples from adjacent normal mucosa were subjected to PCR amplification and were quantitatively analyzed by pyrosequencing. The C base marked in yellow served as a quality control of the bisulfite conversion efficiency. Four analyzed CpG sites are highlighted in blue, and the percent methylation rate is provided for each site. The mean percentage was computed as the LINE-1 methylation rate (LMR) for each case. Two cases with relatively higher (73.8%, A.) or lower (19.4%, B.) LMR were shown, respectively.
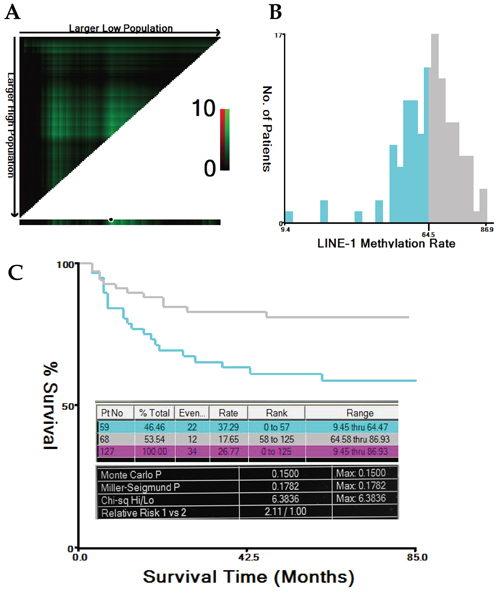
Figure 2: Cutoff value for LMR calculated using the X-tile program. The X-tile program was utilized to calculate the optimal cutoff value for the LINE-1 methylation rate (LMR). Based on the patient survival data, the entire population was divided into the training and validation sets. The training set is shown in the upper-left quartile, with plots of the matched validation set in the small long strip (on the bottom X-axis). The black dot in the validation set represents the exact cutoff value for the LMR (A). The entire cohort was divided into low (blue) or high (grey) LMR groups based on the cutoff value (64.47%), as shown in the histogram (B). Kaplan-Meier plots were generated based on this cutoff value. The detailed outputs of the X-tile analysis are presented (maximum high/low x2 = 6.38, Monte Carlo P = 0.15) (C).
Hypermethylation at the hMLH1 and hMSH2 promoters
The median percentage of methylated reference (PMR) of the analyzed CpG islands at the hMLH1 and hMSH2 promoters were determined by methylation-specific quantitative polymerase chain reaction (MS-qPCR) to be 0.13% (range, 0.01–93.67%) and 2.39% (range, 0.17–7.57%), respectively. Twenty-six (20.47%) and 19 (14.96%) patients were determined to have hypermethylation at the hMLH1 and hMSH2 promoters, respectively.
Gene mutational analysis
The most common mutations occurred in the KRAS gene, which was mutated in 52 of the 127 cases (40.94%). The other gene mutations included the following: 5 (3.94%) in BRAF, 3 (2.36%) in NRAS, and 7 (5.51%) in PIK3CA. The mutation analysis results are shown in Table 2. The chi-square test revealed a significantly higher mutation rate in the KRAS gene in right-sided tumors compared to left-sided tumors (50.7% vs. 28.6%, x2 = 6.342, p = 0.012; Supplementary Table S2, available online).
Table 2: Gene mutations result analyzed by Sanger sequencing
Gene |
Analyzed mutation points |
N of mutation |
Codon |
Subtotal in codon |
Total |
Overall mutation rate (%) |
BRAF |
c.1798G>A/T |
0 |
V600 |
5 |
5 |
3.94 |
c.1799T>A |
4 |
|||||
c.1799T>G |
1 |
|||||
c.1799T>C |
0 |
|||||
KRAS |
c.34G>A/C/T |
10 |
G12 |
38 |
52 |
40.94 |
c.35G>A/C/T |
28 |
|||||
c. 37G>A/C/T |
1 |
G13 |
10 |
|||
c. 38G>A/C/T |
9 |
|||||
c. 181C>A/G/T |
0 |
Q61 |
2 |
|||
c. 182A>C/G/T |
0 |
|||||
c. 183A>C/T |
2 |
|||||
c.436G>A/C |
1 |
A146 |
2 |
|||
c.437C>T |
1 |
|||||
NRAS |
c. 34G>A/C/T |
1 |
G12 |
2 |
3 |
2.36 |
c. 35G>A/C/T |
1 |
|||||
c.37G/38G>A/C/T |
0 |
G13 |
0 |
|||
c.181C>A/G/T |
0 |
Q61 |
1 |
|||
c. 182A>C/G/T |
1 |
|||||
c.183A>C/T |
0 |
|||||
PIK3CA |
c.1624G>A/C |
2 |
E542 |
2 |
7 |
5.51 |
c.1633G>A/C |
0 |
E545 |
0 |
|||
c.1636C>A/G |
1 |
E546 |
2 |
|||
c.1637A>C/G/T |
1 |
|||||
c.3139C>T |
0 |
H1047 |
3 |
|||
c.3140A>G/T |
3 |
|||||
c.3145G>A/C |
0 |
G1049 |
0 |
Abbreviations: BRAF, v-raf murine sarcoma viral oncogene homolog B; KRAS, Kirsten rat sarcoma viral oncogene homolog; NRAS, neuroblastoma RAS viral oncogene homolog; PIK3CA, phosphatidylinositol-4, 5-bisphosphate 3-kinase, catalytic subunit a.
MSI and 18q LOH status analysis
The short tandem repeat (STR) analysis confirmed 16 (12.60%), 40 (31.50%), and 71 (55.90%) cases as MSI-High (MSI-H), MSI-Low (MSI-L) and MSS, respectively. The chi-square test revealed a significantly higher hypermethylation rate of the hMLH1 promoter in the subpopulation of MSI-H tumors compared to that of MSI-L/MSS tumors (36.4% vs. 17.1%, x2 = 4.127, p = 0.042; Supplementary Table S3, available online). In the 18q LOH status analysis, 76 (59.84%) cases were LOH-positive at chromosome 18q. The representative results of the STR analysis of MSI and 18q LOH are shown in Figures 3 and 4.
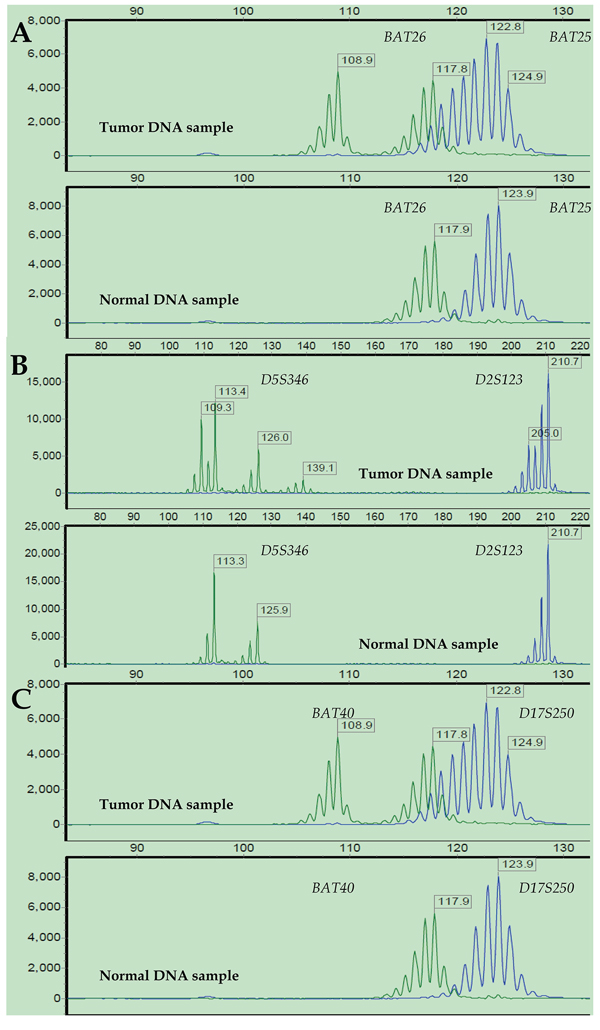
Figure 3: Representative MSI status results after STR analysis. Electropherograms of labeled PCR products targeting six microsatellite loci in paired tumor (upper) and normal (bottom) DNA samples from a representative patient: BAT26 and BAT25 (A), D5S346 and D2S123 (B), and BAT40 and D17S250 (C). The PCR product size is represented on the X-axis, and fluorescence units are represented on the Y-axis. For all the microsatellite loci, the tumor DNA sample showed altered allelic profiles compared to the matched normal DNA sample. Thus, this case was defined as MSI-H.
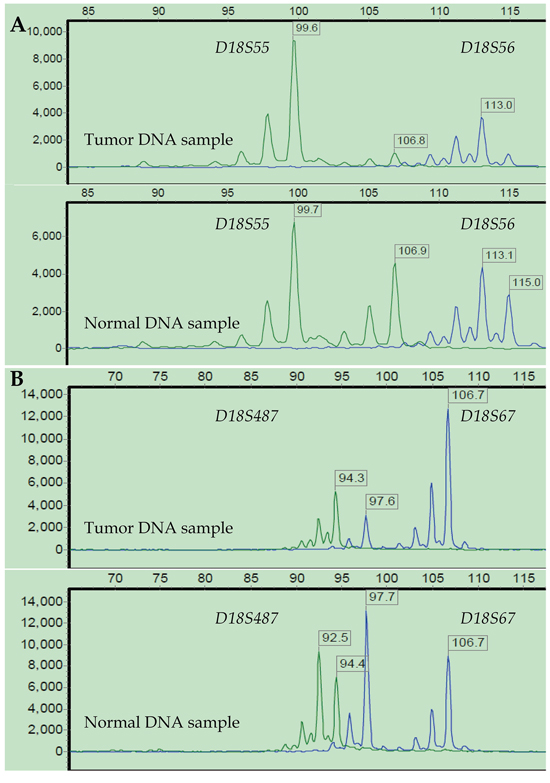
Figure 4: Representative 18q LOH status results after STR analysis. LOH status was investigated at four loci on 18q from a representative patient: D18S55 and D18S56 (A), D18S67 and D18S487 (B). Three loci (D18S55, D18S56, and D18S487) showed a greater than 40% reduction in fluorescence units in at least 1 of 2 allele peaks in tumor DNA relative to normal DNA. Thus, this tumor was defined as 18q LOH-positive, and MSI-High as well.
Kaplan-Meier survival and multivariate Cox regression analyses
The Kaplan-Meier survival analysis revealed that tumor stage (T), nodal status (N), distant metastases (M), AJCC stage, sex, LMR, MSI status, 18q LOH, serum CEA and CA199 levels, lymphovascular invasion, extranodal tumor deposits and perineural invasion significantly influenced patients’ CCSS (all p < 0.05; Table 3). The multivariate Cox regression analysis confirmed that the LMR (high vs. low, hazard ratio (HR) = 0.337, 95% confidence interval (CI): 0.162–0.702, p = 0.004), MSI status (MSI-H vs. MSI-L/MSS, HR = 0.088, 95% CI: 0.011–0.679, p = 0.020), perineural invasion (yes vs. no, HR = 2.578, 95% CI: 1.148–5.791, p = 0.022), and distant metastases (M1 vs. M0, HR = 28.641, 95% CI: 11.414–71.870, p = 0.000) were independent prognostic factors of CCSS (Table 4).
Table 3: Kaplan-Meier analysis on patient’s CCSS
Prognostic variable |
Grouping factor |
Mean (months) |
SE (months) |
95% CI (lower-upper) |
X2 |
p |
Sex |
Male |
69.670 |
3.319 |
63.164–76.175 |
6.278 |
0.012 |
Female |
54.911 |
5.216 |
44.689–65.134 |
|||
T stage |
T2–T3 |
74.363 |
3.495 |
67.513–81.214 |
8.215 |
0.004 |
T4a–T4b |
56.711 |
4.061 |
48.751–64.670 |
|||
N stage |
N0 |
77.898 |
2.392 |
73.209–82.588 |
22.908 |
0.000 |
N1–N2 |
48.913 |
4.950 |
39.211–58.614 |
|||
M stage |
M0 |
79.188 |
1.905 |
75.455–82.922 |
107.858 |
0.000 |
M1 |
19.610 |
4.043 |
11.685–27.535 |
|||
AJCC TNM Stage |
I–II |
81.395 |
1.758 |
77.949–84.841 |
30.134 |
0.000 |
III–IV |
48.409 |
4.624 |
39.347–57.472 |
|||
LMR Level |
Low |
57.414 |
4.679 |
48.243–66.585 |
5.582 |
0.018 |
High |
69.692 |
3.376 |
63.076–76.309 |
|||
MSI Status |
MSI–L/MSS |
60.766 |
3.317 |
54.264–67.267 |
6.380 |
0.012 |
MSI–H |
81.895 |
3.022 |
75.971–87.819 |
|||
18q LOH |
No |
72.341 |
3.900 |
64.696–79.986 |
4.258 |
0.039 |
Yes |
59.258 |
3.968 |
51.482–67.035 |
|||
Serum CEA level |
Normal |
70.678 |
3.304 |
64.202–77.154 |
7.606 |
0.006 |
Elevated |
55.259 |
5.117 |
45.231–65.288 |
|||
Serum CA199 level |
Normal |
75.834 |
2.587 |
70.762–80.905 |
37.850 |
0.000 |
Elevated |
38.593 |
5.144 |
28.511–48.674 |
|||
LVI |
No |
71.556 |
3.060 |
65.558–77.554 |
10.980 |
0.001 |
Yes |
50.982 |
5.675 |
39.859–62.105 |
|||
PNI |
No |
68.083 |
2.934 |
62.332–73.834 |
7.805 |
0.005 |
Yes |
45.389 |
8.922 |
27.903–62.875 |
|||
ENTD |
No |
69.139 |
2.882 |
63.490–74.788 |
16.714 |
0.000 |
Yes |
33.748 |
6.840 |
20.341–47.154 |
*Log Rank (Mantel-Cox) test was used to test the significance of the different survival between the groups according to different variables. A two-tailed p value ≤0.05 was considered statistically significant.
Abbreviations: CCSS, colon cancer specific survival; SE, standard error; CI, confidence interval; AJCC, American Joint Committee on Cancer (AJCC); LMR, LINE-1 methylation rate; 18q LOH, loss of heterozygosity at chromosome 18q; MSI, micro-satellite instable; MSS, micro-satellite stable; CEA, carcinoembryonic antigen; CA199, Carbohydrate antigen 199; LVI, lymphovascular invasion; PNI, perineural invasion; ENTD, extranodal tumor deposits.
Table 4: Multivariate Cox analysis on prognostic factors for patient’s CCSS
Variables |
SE |
Wald |
p |
HR |
95.0% CI |
|
Lower |
Upper |
|||||
Distant metastases |
0.469 |
51.082 |
0.000 |
28.641 |
11.414 |
71.870 |
LMR level |
0.374 |
8.457 |
0.004 |
0.337 |
0.162 |
0.702 |
MSI-H |
1.041 |
5.435 |
0.020 |
0.088 |
0.011 |
0.679 |
Perineural invasion |
0.413 |
5.262 |
0.022 |
2.578 |
1.148 |
5.791 |
Abbreviations: CCSS, colon cancer specific survival; SE, standard error; HR: hazard ratio; CI, confidence interval; LMR, LINE-1 methylation rate; MSI, micro-satellite instable.
Stratified analysis of the influence of LMR on patient survival rate
A stratified Kaplan-Meier survival analysis further revealed that patients with a lower LMR had a significantly worse survival in the subgroups of age >60 years, tumor size ≤5 cm, right-sided tumors, M0, differentiation grade of G3-G4, no perineural invasion, normal serum CEA levels, KRAS gene mutation, wild-type BRAF and PIK3CA, 18q LOH, and no hMLH1 gene promoter hypermethylation (all p < 0.05; Figure 5; Supplementary Table S4, available online).
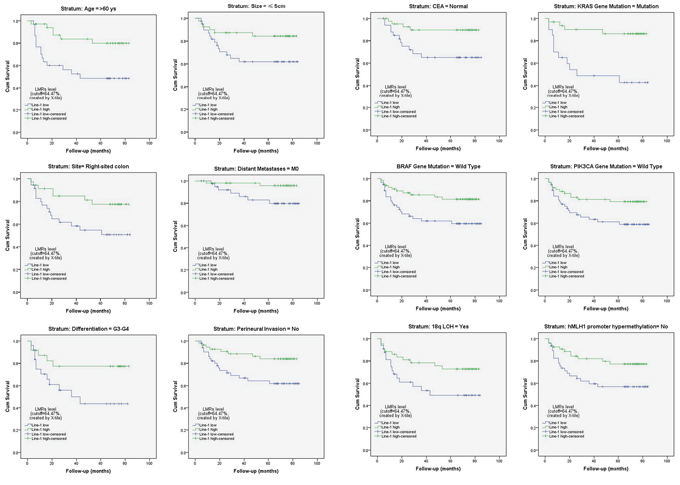
Figure 5: Stratified analysis of the influence of the LMR level on colon cancer-specific survival. Kaplan-Meier survival studies were used for a stratified analysis. It revealed that patients with a lower LMR (LINE-1 hypomethylation) had a significantly worse survival rate among certain subgroups of patients with colon cancer (all p < 0.05; also see Supplementary Table S4, available online).
Associations between LMR and other variables
The normality tests revealed that the LMRs in most of the subgroups were normally distributed according to various clinicopathological variables (most with p > 0.05; Supplementary Table S1, available online). Thus, the mean differences between the different subgroups were evaluated using Student’s t test. However, these variables were not associated with the LMR (all p > 0.05; Supplementary S5, available online). The remaining two variables, PIK3CA gene mutation and lymphovascular invasion, were not normally distributed but were associated with the LMR (Mann-Whitney U test, all p < 0.05; Table 5).
Table 5: Mann-Whitney U test for association between LMRs and certain variables
Variables |
Subgroup |
N |
Mean rank |
Sum rank |
U |
p |
Lymphovascular invasion |
No |
85 |
69.88 |
5939.50 |
1285.500 |
0.010 |
Yes |
42 |
52.11 |
2188.50 |
|||
PIK3CA gene mutation |
Wild type |
120 |
62.23 |
7467.00 |
207.000 |
0.024 |
Mutation |
7 |
94.43 |
661.00 |
*A two-tailed p value ≤ 0.05 was considered statistically significant.
DISCUSSION
LINE-1 methylation levels have been reported to be a surrogate marker for cellular 5-methylcytosine levels (i.e., global DNA methylation) [23, 28, 29, 37–39]. Herein, we investigated the relationship between the survival of patients with colon cancer and global DNA methylation levels in normal colonic mucosa as well as various other molecular alterations. Our findings revealed that LINE-1 hypomethylation in normal-appearing mucosa was significantly associated with worse survival in certain subgroups of Chinese patients with colon cancer. This association has also been reported in other ethnic groups [27, 33, 34, 40].
CRC consists of a heterogeneous group of diseases with complex genetic and epigenetic modifications [41]. Genetic alterations usually involve mutations in oncogenes and/or tumor suppressor genes that result in either a gain or loss of function and abnormal expression. The consequence of such alterations is the aberrant activation or repression of downstream genes governing cell proliferation and growth [42]. Epigenetic alterations that contribute to CRC tumorigenesis are more complex and usually involve chromatin structural modifications such as histone modifications, aberrant DNA methylation, and nucleosome positioning [7, 43]. In the present study, we conducted an overall investigation of the potential factors that influence the prognosis of patients with colon cancer with a particular focus on genetic (somatic mutations and CIN/18q LOH) and epigenetic (LINE-1 hypomethylation, hMLH1 and hMSH2 promoter hypermethylation, and MSI status) changes and correlated these changes with certain established clinicopathological features.
The majority of CRCs that occur via the adenoma–carcinoma sequence have distinct features with genetic mutations in various oncogenes and tumor suppressor genes [43]. Somatic mutations in KRAS are common in CRC [44]. In the present study, the KRAS gene mutation rate (40.94%) was comparable to that reported by others [45, 46]. Among the 52 cases with mutant KRAS, the majority had mutations at codons G12 and G13 (38 and 10 cases, respectively). NRAS mutations are rare in CRC [47]. We only detected 3/127 (2.36%) cases of mutant NRAS (Table 2). Furthermore, we found an increased incidence of KRAS mutation in tumors located in the proximal colon (Supplementary Table S2). This result was also in accordance with those of other studies [45, 48, 49]. Interestingly, we found a total of 60 (47%) tumors with mutated KRAS, NRAS or BRAF genes, and the significant pattern of mutual exclusivity among these genes has been reported previously [50, 51]. However, the exact mechanism for this mutual exclusivity is not yet clear.
In addition to contributing to genetic mutations, CIN contributes to the pathogenesis of conventional CRC that develops via the adenoma-carcinoma sequence [52]. LOH is considered to be a hallmark of CIN-positive tumors [5]. Fearon et al. [53] originally determined that the evolution of CRC was frequently associated with mutated genes on chromosome 18q. In the present study, 76 (59.84%) tumors were LOH-positive at chromosome 18q. This finding agrees with the results of a study by Thiagalingam et al. [54]. The authors conducted a cytogenetic analysis of LOH at chromosomes 1, 5, 8, 17, and 18 in patients with CRC and concluded that LOH was common at chromosome 18, which appeared to be caused by mitotic recombination or gene conversion.
The serrated pathway that occurs in colorectal carcinogenesis is predominantly influenced by epigenetic modifications and characterized by BRAF mutations [5, 55]. However, activating mutations in BRAF are less common in CRC [56]. We detected BRAF mutations in only 5 (3.94%) tumors, and all of these mutations occurred in codon V600 (c.1799T > A/G) (Tables 2 and Supplementary Table S6).
Epigenetic modifications can also cause MMR gene silencing and thus predispose a cell to hMLH1 inactivation via promoter hypermethylation [2, 43]. These observations may explain why sporadic CRC that develops via the serrated pathway has a distinct potential endpoint as a MSI carcinoma [5]. In our cohort, we detected 40 (31.50%) and 16 (12.60%) cases that were MSI-H and MSI-L, respectively. Hypermethylation of MMR genes and LINE-1 DNA elements in the normal mucosa of patients with CRC has been reported to be consistently detected [23, 31, 32, 57, 58]. Our data also confirmed a higher hypermethylation level at the hMLH1 gene promoter in MSI-H tumors than in MSI-L or MSS tumors (Supplementary Table S2).
The CIMP is another distinct form of epigenomic instability in CRC that develops via the serrated pathway [59–63]; the CIMP causes most cases of sporadic CRC with MSI-H through epigenetic silencing of hMLH1 [64, 65]. A CIMP-high status in CRC patients is regarded as a surrogate for the widespread hypermethylation of CpG islands [66, 67]. Previous CRC studies have identified associations between a CIMP-high status and a female preponderance, proximal colon location, MSI-H, increased age and KRAS mutation rate, or decreased TP53 mutation rate [48, 49, 68–71]. However, we could not confirm these relationships with our own CIMP results (data not shown). A small sample size and a non-predominant mechanism of colorectal tumorigenesis via the serrated pathway potentially account for this inconsistency.
Genome-wide hypomethylation is a frequent somatic epigenetic alteration in cancer cells [72] and possibly contributes to a “field defect” in precancerous lesions [73]. Epigenetic and genetic changes apparently are not two separate mechanisms that participate in gastrointestinal carcinogenesis [43]. Our survival study showed that besides certain confirmed clinicopathological abnormalities, both genetic (18q LOH) and epigenetic (MSI and LMR) alterations contributed separately to the survival of patients with colon cancer (Table 3). Data from the multivariate Cox analysis reinforced the concurrent influence of genetic and epigenetic changes on patient survival (Table 4). Epigenetic alterations can cause genetic mutations, and vice versa; genetic mutations in epigenetic regulators can also lead to an altered epigenome [71]. Our data again confirmed this association between LINE-1 hypomethylation in normal mucosa and specific poor pathological features and genetic alterations (Table 5).
Suzuki et al. [74] found that hypomethylation was more strongly associated than hypermethylation with genetic damage and a worse prognosis. Similarly, Alonso et al. [75] reported an absence of an association between MGMT methylation and G > A transition mutations in KRAS and TP53 in CRC without MSI. In the present study, we also did not identify a significant correlation between hMLH1/hMSH2 hypermethylation and various gene mutations, regardless of MSI status.
One limitation of our study is that this relatively small, single center cohort included only Chinese participants. Thus, it remains to be determined whether our findings are applicable to general populations with CRC. Nonetheless, to the best of our knowledge, this was the first study aimed at investigating the prognostic significance of various genetic, epigenetic and clinicopathological variables on the survival of Chinese patients.
In conclusion, our data partially confirmed that genetic (classical adenoma-carcinoma sequence) and epigenetic (alterative serrated pathway) patterns can concurrently exist in the complex landscape of colonic tumorigenesis. Furthermore, LINE-1 hypomethylation in adjacent normal colon mucosa appeared to be associated with worse outcome in certain Chinese patients with colon cancer.
MATERIALS AND METHODS
Patients, tissue samples and clinicopathological variables
A total of 127 pairs of tissue samples were retrieved from patients with stage I-IV colon cancer. These consecutive patients were surgically treated by one medical team (Attending doctor, Prof. Sanjun Cai, M.D.) between January 2008 and December 2009. In this study, patients with resectable primary lesions, including those who had distant metastases that were either resectable or unresectable, were included. Patients who had received neoadjuvant chemotherapy and those with inflammatory bowel disease, familial adenomatous polyposis, Lynch syndrome, or serrated polyposis were excluded.
Fresh colon tumor tissues and paired normal colonic mucosa (at least 5 cm from the tumor margin) were obtained immediately after the specimens were retrieved in the operation room; these specimens were washed twice with chilled 1x phosphate-buffered saline, immediately frozen in liquid nitrogen, and stored at –80°C in our tissue bank for future use.
The patients’ electronic medical records were reviewed, and various clinicopathological variables were investigated. Colon cancer differentiation grading and TNM classification were confirmed according to the criteria described in the AJCC Cancer Staging Manual (7th edition, 2010). The primary outcome of this study was CCSS, which was computed from the time when the patient underwent an operation until death from colon cancer. The last follow-up date was set as December 31, 2014. Written informed consent was obtained from all the patients, and the study protocol was approved by the Medical Ethics Committee of Fudan University Shanghai Cancer Center.
Genomic DNA isolation and bisulfite conversion
Genomic DNA (gDNA) was isolated from tumor or normal colonic mucosa tissue samples using tissue DNA isolation kits (#D3051, ZYMO Research, USA) according to the manufacturer’s instructions. gDNA was quantified using a spectrophotometer (NanoDrop 2000, Thermo Fisher Scientific Inc., USA). Bisulfite treatment of 0.5–1 μg of gDNA (tumor or normal mucosa) was performed using methylation kits (#D5006, ZYMO Research, USA) according to the manufacturer’s instructions.
Pyrosequencing for LINE-1 methylation levels
Bisulfite-treated DNA samples from normal colon mucosa were subjected to PCR amplification using an ABI GeneAmp® PCR System 9700 (Applied Biosystems, USA); the 50-μL reactions contained 0.2 μL (5 U/μl) of KAPA Taq DNA Polymerase (Kapa Biosystems, USA), 50 pmol of each forward and reverse primer, and 2 μL of bisulfate-converted DNA. The PCR conditions were as follows: initial Taq activation at 95°C for 3 minutes; 40 cycles of denaturation at 94°C for 30 seconds, annealing at 50°C for 30 seconds, and elongation at 72°C for 1 minute; and a final extension at 72°C for 7 minutes. Global LINE-1 methylation levels were quantitatively analyzed using the PyroMark Q96 ID pyrosequencing system (Qiagen, German) as described previously [35, 36]. The mean percent methylation of the four analyzed CpG sites was calculated as the LMR. The primer sequences are provided in Supplementary Table S5 (available online).
MS-qPCR for hMLH1 and hMSH2 promoter hypermethylation
Bisulfite-treated DNA samples from tumor tissues were analyzed for hMLH1 and hMSH2 hypermethylation. MS-qPCR (MethyLight) was performed using SYBR Green reagent (#K0221, Thermo Scientific, USA). In this system, a bisulfite-converted universal human DNA standard of 100% methylation (#D5015, ZYMO Research, USA) and ALU-C4 were used as the reference template and internal control, respectively. Real-time PCR was performed in a final reaction volume of 10 μL using an ABI Prism 7900T Sequence Detection System (Applied Biosystems, USA). The reaction mixture contained 25 pmol of target gene primers (hMLH1 or hMSH2) or control primers (ALU-C4) and 25–50 ng of bisulfite-treated sample DNA template or DNA standard. The cycling conditions were as follows: initial denaturation at 95°C for 10 minutes followed by 40 cycles of denaturation at 95°C for 15 seconds and annealing/extension at 60°C for 1 minute. The PMR was computed using a previously described formula [76]: 100% * 2 exp–[Delta Ct (target gene in sample − control gene in sample) − Delta Ct (100% methylated target in reference sample – control gene in reference sample)]. A PMR cutoff of 4%, which was previously validated [77–79], was utilized to determine whether a sample was hypermethylated at the hMLH1 and hMSH2 gene promoters. The primer sequences are provided in Supplementary Table S6 (available online).
Sanger sequencing analysis of gene mutation status
In the present study, the gene mutation status of the most frequently reported CRC-related oncogenes, BRAF, KRAS, NRAS, and PIK3CA, was analyzed. Sanger sequencing was performed targeting BRAF codon 600; KRAS codons 12, 13, 61 and 146; NRAS codons 12, 13 and 61; and PIK3CA codons 542, 545, 546, 1047 and 1049. The possible point mutation sites and the primer sequences are listed for each gene in Supplementary Table S7 (available online).
Tumor tissue gDNA samples were analyzed to determine the mutation status of the aforementioned genes. Approximately 10 ng of gDNA was amplified in a 25-μL PCR reaction that contained 10 pmol of forward and reverse primers and 12.5 μL of KAPA2G Fast Multiplex Mix (#KM5802, Kapa Biosystems, USA). The thermocycling conditions were as follows: initial activation at 94°C for 5 minutes; 30 cycles of denaturation at 94°C for 30 seconds, annealing at 60°C for 30 seconds, and elongation at 72°C for 1 minute; and a final extension at 72°C for 5 minutes. The PCR products were extracted with a gel extraction kit (#AP-GX-250, Axygen Biosciences, USA) and purified using an ABI PRISM BigDye Reaction Kit (#403047, Applied Biosystems, USA) according to the manufacturer’s instructions. After purification, the products were analyzed using an ABI 3730XL Genetic Analyzer (Applied Biosystems, USA). Specific point mutations were analyzed individually, and the overall mutation rate was calculated for each gene. A gene was defined as wild-type based on the absence of a point mutation at any of these sites.
STR analysis for MSI and 18q LOH status
gDNA samples extracted from tumor and corresponding normal colonic tissues were subjected to STR analysis for MSI and 18q LOH status using a panel of 10 mononucleotide and dinucleotide microsatellite loci: D2S123, D5S346, D17S250, BAT25, BAT26, BAT40, D18S55, D18S56, D18S67, and D18S487 [44, 80, 81]. The forward primer for each marker was labeled with fluorescence (either FAM or HEX) at the 5′ end (Supplementary Table S5, available online). Approximately 30–50 ng of gDNA was amplified in a 50-μL PCR reaction that contained 15 pmol of forward and reverse primers and 0.6 μL (5 U/μL) of KAPA Taq DNA Polymerase (Kapa Biosystems, USA). The thermocycling conditions were as follows: initial activation at 94°C for 3 minutes; 35 cycles of denaturation at 94°C for 25 seconds, annealing at 55°C for 25 seconds, and elongation at 72°C for 1.5 minutes; and a final extension at 72°C for 3 minutes. The PCR products were electrophoresed and analyzed using an ABI 3730XL DNA Analyzer (Applied Biosystems, USA) with GeneMarker V2.2.0 (SoftGenetics, LLC, USA).
The MSI status was graded as high (MSI-H; 3 or more unstable markers), low (MSI-L; 1 to 2 unstable markers), or stable (MSS; no unstable markers) [44]. The MSI-L and MSS populations were pooled. LOH at each locus in 18q (D18S55, D18S56, D18S67, and D18S487) was defined as a ≥ 40% reduction in 1 of 2 allele peaks in tumor DNA relative to normal DNA in two duplicate runs. A tumor was defined as 18q LOH positive when any informative marker showed LOH; and negative when at least two markers were informative and the absence of LOH [33].
Statistical analysis
Kolmogorov-Smirnov Z tests were performed to test whether the LMRs were normally distributed according to various grouping factors. The student t test was used to compare the mean LMRs between the two independent populations when the data was normally distributed, otherwise the Mann-Whitney U test were utilized. Chi-square test was utilized to compare differences between two observed frequencies. The cut-off of the LMRs was calculated using the X-tile program (http://www.tissuearray.org/rimmlab/), which identified the cut-off value with minimum p values from log-rank x2 statistics for the categorical LMRs in terms of cancer specific survival [82–84]. This cut-off value was used to further subgroup the patients into low or high LMR levels. Cumulative survival curves were drawn using the Kaplan-Meier method, and the differences between the curves were analyzed by the log-rank test. Prognostic factors were determined using multivariate Cox regression analysis. Statistical analyses were performed using SPSS ver. 20.0 (IBM Corp., USA). A two-tailed p value less than 0.05 was considered statistically significant.
ACKNOWLEDGMENTS
The authors thank Zhuzhu Qian for her assistance with survival data collection; and thank Soi Cheng Law, a PhD student at the University of Queensland Diamantina Institute, for her help with the valuable editing of this manuscript.
FUNDING
This work was supported by the National Natural Science Foundation of China (No. 81372646 to Cai SJ, and No. 81472222 to Li DW).
CONFLICTS OF INTEREST
The authors have no potential conflicts of interest to disclose.
REFERENCES
1. Siegel RL, Miller KD, Jemal A. Cancer statistics. 2015; CA: a cancer journal for clinicians. 65:5–29.
2. Kang GH. Four molecular subtypes of colorectal cancer and their precursor lesions. Archives of pathology & laboratory medicine. 2011; 135:698–703.
3. Jass JR. Classification of colorectal cancer based on correlation of clinical, morphological and molecular features. Histopathology. 2007; 50:113–130.
4. Fearon ER. Molecular genetics of colorectal cancer. Annual review of pathology. 2011; 6:479–507.
5. Pino MS, Chung DC. The chromosomal instability pathway in colon cancer. Gastroenterology. 2010; 138:2059–2072.
6. Morson B. President’s address. The polyp-cancer sequence in the large bowel. Proceedings of the Royal Society of Medicine. 1974; 67:451–457.
7. Sharma S, Kelly TK, Jones PA. Epigenetics in cancer. Carcinogenesis. 2010; 31:27–36.
8. Thiagalingam S, Lengauer C, Leach FS, Schutte M, Hahn SA, Overhauser J, Willson JK, Markowitz S, Hamilton SR, Kern SE, Kinzler KW, Vogelstein B. Evaluation of candidate tumour suppressor genes on chromosome 18 in colorectal cancers. Nature genetics. 1996; 13:343–346.
9. Samuels Y, Wang Z, Bardelli A, Silliman N, Ptak J, Szabo S, Yan H, Gazdar A, Powell SM, Riggins GJ, Willson JK, Markowitz S, Kinzler KW, Vogelstein B, Velculescu VE. High frequency of mutations of the PIK3CA gene in human cancers. Science. (New York, NY). 2004; 304:554.
10. Ushijima T. Epigenetic field for cancerization. Journal of biochemistry and molecular biology. 2007; 40:142–150.
11. Markowitz S. DNA repair defects inactivate tumor suppressor genes and induce hereditary and sporadic colon cancers. Journal of clinical oncology: official journal of the American Society of Clinical Oncology. 2000; 18:75S–80S.
12. Hampel H, Frankel WL, Martin E, Arnold M, Khanduja K, Kuebler P, Nakagawa H, Sotamaa K, Prior TW, Westman J, Panescu J, Fix D, Lockman J, Comeras I A, de la Chapelle A. Screening for the Lynch syndrome (hereditary nonpolyposis colorectal cancer). The New England journal of medicine. 2005; 352:1851–1860.
13. Boland CR, Goel A. Microsatellite instability in colorectal cancer. Gastroenterology. 2010; 138:2073–2087.e2073.
14. Nosho K, Irahara N, Shima K, Kure S, Kirkner GJ, Schernhammer ES, Hazra A, Hunter DJ, Quackenbush J, Spiegelman D, Giovannucci EL, Fuchs CS, Ogino S. Comprehensive biostatistical analysis of CpG island methylator phenotype in colorectal cancer using a large population-based sample. PloS one. 2008; 3:e3698.
15. Popat S, Hubner R, Houlston RS. Systematic review of microsatellite instability and colorectal cancer prognosis. Journal of clinical oncology: official journal of the American Society of Clinical Oncology. 2005; 23:609–618.
16. Samowitz WS, Curtin K, Ma KN, Schaffer D, Coleman LW, Leppert M, Slattery ML. Microsatellite instability in sporadic colon cancer is associated with an improved prognosis at the population level. Cancer epidemiology, biomarkers & prevention : a publication of the American Association for Cancer Research, cosponsored by the American Society of Preventive Oncology. 2001; 10:917–923.
17. Hughes LA, Melotte V, de Schrijver J, de Maat M, Smit VT, Bovee JV, French PJ, van den Brandt PA, Schouten LJ, de Meyer T, van Criekinge W, Ahuja N, Herman JG, Weijenberg MP, van Engeland M. The CpG island methylator phenotype: what’s in a name? Cancer research. 2013; 73:5858–5868.
18. Esteller M. Epigenetics in cancer. The New England journal of medicine. 2008; 358:1148–1159.
19. Jones PA, Baylin SB. The epigenomics of cancer. Cell. 2007; 128:683–692.
20. Feinberg AP, Vogelstein B. Hypomethylation distinguishes genes of some human cancers from their normal counterparts. Nature. 1983; 301:89–92.
21. Gama-Sosa MA, Slagel VA, Trewyn RW, Oxenhandler R, Kuo KC, Gehrke CW, Ehrlich M. The 5-methylcytosine content of DNA from human tumors. Nucleic acids research. 1983; 11:6883–6894.
22. Lu LJ, Randerath E, Randerath K. DNA hypomethylation in Morris hepatomas. Cancer letters. 1983; 19:231–239.
23. Estecio MR, Gharibyan V, Shen L, Ibrahim AE, Doshi K, He R, Jelinek J, Yang AS, Yan PS, Huang TH, Tajara EH, Issa JP. LINE-1 hypomethylation in cancer is highly variable and inversely correlated with microsatellite instability. PloS one. 2007; 2:e399.
24. Birney E, Stamatoyannopoulos JA, Dutta A, Guigo R, Gingeras TR, Margulies EH, Weng Z, Snyder M, Dermitzakis ET, Thurman RE, Kuehn MS, Taylor CM, Neph S, Koch CM, Asthana S, Malhotra A, et al. Identification and analysis of functional elements in 1% of the human genome by the ENCODE pilot project. Nature. 2007; 447:799–816.
25. Ponting CP, Belgard TG. Transcribed dark matter: meaning or myth? Human molecular genetics. 2010; 19:R162–168.
26. Stein LD. Human genome: end of the beginning. Nature. 2004; 431:915–916.
27. Ogino S, Nosho K, Kirkner GJ, Kawasaki T, Chan AT, Schernhammer ES, Giovannucci EL, Fuchs CS. A cohort study of tumoral LINE-1 hypomethylation and prognosis in colon cancer. Journal of the National Cancer Institute. 2008; 100:1734–1738.
28. Yang AS, Estecio MR, Doshi K, Kondo Y, Tajara EH, Issa JP. A simple method for estimating global DNA methylation using bisulfite PCR of repetitive DNA elements. Nucleic acids research. 2004; 32:e38.
29. Yang AS, Doshi KD, Choi SW, Mason JB, Mannari RK, Gharybian V, Luna R, Rashid A, Shen L, Estecio MR, Kantarjian HM, Garcia-Manero G, Issa JP. DNA methylation changes after 5-aza-2’-deoxycytidine therapy in patients with leukemia. Cancer research. 2006; 66:5495–5503.
30. Matsuzaki K, Deng G, Tanaka H, Kakar S, Miura S, Kim YS. The relationship between global methylation level, loss of heterozygosity, and microsatellite instability in sporadic colorectal cancer. Clinical cancer research: an official journal of the American Association for Cancer Research. 2005; 11:8564–8569.
31. Shen L, Kondo Y, Rosner GL, Xiao L, Hernandez NS, Vilaythong J, Houlihan PS, Krouse RS, Prasad AR, Einspahr JG, Buckmeier J, Alberts DS, Hamilton SR, Issa JP. MGMT promoter methylation and field defect in sporadic colorectal cancer. Journal of the National Cancer Institute. 2005; 97:1330–1338.
32. Silviera ML, Smith BP, Powell J, Sapienza C. Epigenetic differences in normal colon mucosa of cancer patients suggest altered dietary metabolic pathways. Cancer prevention research. (Philadelphia, Pa). 2012; 5:374–384.
33. Nosho K, Kure S, Irahara N, Shima K, Baba Y, Spiegelman D, Meyerhardt JA, Giovannucci EL, Fuchs CS, Ogino S. A prospective cohort study shows unique epigenetic, genetic, and prognostic features of synchronous colorectal cancers. Gastroenterology. 2009; 137:1609–1620.e1601–1603.
34. Kamiyama H, Suzuki K, Maeda T, Koizumi K, Miyaki Y, Okada S, Kawamura YJ, Samuelsson JK, Alonso S, Konishi F, Perucho M. DNA demethylation in normal colon tissue predicts predisposition to multiple cancers. Oncogene. 2012; 31:5029–5037.
35. Goel A, Xicola RM, Nguyen TP, Doyle BJ, Sohn VR, Bandipalliam P, Rozek LS, Reyes J, Cordero C, Balaguer F, Castells A, Jover R, Andreu M, Syngal S, Boland CR, Llor X. Aberrant DNA methylation in hereditary nonpolyposis colorectal cancer without mismatch repair deficiency. Gastroenterology. 2010; 138:1854–1862.
36. Ogino S, Kawasaki T, Nosho K, Ohnishi M, Suemoto Y, Kirkner GJ, Fuchs CS. LINE-1 hypomethylation is inversely associated with microsatellite instability and CpG island methylator phenotype in colorectal cancer. International journal of cancer Journal international du cancer. 2008; 122:2767–2773.
37. Weisenberger DJ, Campan M, Long TI, Kim M, Woods C, Fiala E, Ehrlich M, Laird PW. Analysis of repetitive element DNA methylation by MethyLight. Nucleic acids research. 2005; 33:6823–6836.
38. Kazazian HH Jr. Mobile elements: drivers of genome evolution. Science. (New York, NY). 2004; 303:1626–1632.
39. Deininger PL, Moran JV, Batzer MA, Kazazian HH Jr. Mobile elements and mammalian genome evolution. Current opinion in genetics & development. 2003; 13:651–658.
40. Speek M. Antisense promoter of human L1 retrotransposon drives transcription of adjacent cellular genes. Molecular and cellular biology. 2001; 21:1973–1985.
41. Ogino S, Chan AT, Fuchs CS, Giovannucci E. Molecular pathological epidemiology of colorectal neoplasia: an emerging transdisciplinary and interdisciplinary field. Gut. 2011; 60:397–411.
42. Rustgi AK. The genetics of hereditary colon cancer. Genes & development. 2007; 21:2525–2538.
43. You JS, Jones PA. Cancer genetics and epigenetics: two sides of the same coin? Cancer cell. 2012; 22:9–20.
44. Ogino S, Brahmandam M, Cantor M, Namgyal C, Kawasaki T, Kirkner G, Meyerhardt JA, Loda M, Fuchs CS. Distinct molecular features of colorectal carcinoma with signet ring cell component and colorectal carcinoma with mucinous component. Modern pathology: an official journal of the United States and Canadian Academy of Pathology, Inc. 2006; 19:59–68.
45. Yamauchi M, Morikawa T, Kuchiba A, Imamura Y, Qian ZR, Nishihara R, Liao X, Waldron L, Hoshida Y, Huttenhower C, Chan AT, Giovannucci E, Fuchs C, Ogino S. Assessment of colorectal cancer molecular features along bowel subsites challenges the conception of distinct dichotomy of proximal versus distal colorectum. Gut. 2012; 61:847–854.
46. Russo AL, Borger DR, Szymonifka J, Ryan DP, Wo JY, Blaszkowsky LS, Kwak EL, Allen JN, Wadlow RC, Zhu AX, Murphy JE, Faris JE, Dias-Santagata D, Haigis KM, Ellisen LW, Iafrate AJ, et al. Mutational analysis and clinical correlation of metastatic colorectal cancer. Cancer. 2014; 120:1482–1490.
47. Irahara N, Baba Y, Nosho K, Shima K, Yan L, Dias-Santagata D, Iafrate AJ, Fuchs CS, Haigis KM, Ogino S. NRAS mutations are rare in colorectal cancer. Diagnostic molecular pathology: the American journal of surgical pathology, part B. 2010; 19:157–163.
48. Toyota M, Ahuja N, Ohe-Toyota M, Herman JG, Baylin SB, Issa JP. CpG island methylator phenotype in colorectal cancer. Proceedings of the National Academy of Sciences of the United States of America. 1999; 96:8681–8686.
49. Toyota M, Ohe-Toyota M, Ahuja N, Issa JP. Distinct genetic profiles in colorectal tumors with or without the CpG island methylator phenotype. Proceedings of the National Academy of Sciences of the United States of America. 2000; 97:710–715.
50. Cancer Genome Atlas Network. Comprehensive molecular characterization of human colon and rectal cancer. Nature. 2012; 487:330–337.
51. Cho KJ, Kasai RS, Park JH, Chigurupati S, Heidorn SJ, van der Hoeven D, Plowman SJ, Kusumi A, Marais R, Hancock JF. Raf inhibitors target ras spatiotemporal dynamics. Current Biology. 2012; 22:945–955.
52. Geigl JB, Obenauf AC, Schwarzbraun T, Speicher MR. Defining ‘chromosomal instability’. Trends in genetics: TIG. 2008; 24:64–69.
53. Fearon ER, Vogelstein B. A genetic model for colorectal tumorigenesis. Cell. 1990; 61:759–767.
54. Thiagalingam S, Laken S, Willson JK, Markowitz SD, Kinzler KW, Vogelstein B, Lengauer C. Mechanisms underlying losses of heterozygosity in human colorectal cancers. Proceedings of the National Academy of Sciences of the United States of America. 2001; 98:2698–2702.
55. Rustgi AK. BRAF: a driver of the serrated pathway in colon cancer. Cancer cell. 2013; 24:1–2.
56. Davies H, Bignell GR, Cox C, Stephens P, Edkins S, Clegg S, Teague J, Woffendin H, Garnett MJ, Bottomley W, Davis N, Dicks E, Ewing R, Floyd Y, Gray K, Hall S, et al. Mutations of the BRAF gene in human cancer. Nature. 2002; 417:949–954.
57. Kawakami K, Ruszkiewicz A, Bennett G, Moore J, Grieu F, Watanabe G, Iacopetta B. DNA hypermethylation in the normal colonic mucosa of patients with colorectal cancer. British journal of cancer. 2006; 94:593–598.
58. Ahlquist T, Lind GE, Costa VL, Meling GI, Vatn M, Hoff GS, Rognum TO, Skotheim RI, Thiis-Evensen E, Lothe RA. Gene methylation profiles of normal mucosa, and benign and malignant colorectal tumors identify early onset markers. Molecular cancer. 2008; 7:94.
59. Tanaka N, Huttenhower C, Nosho K, Baba Y, Shima K, Quackenbush J, Haigis KM, Giovannucci E, Fuchs CS, Ogino S. Novel application of structural equation modeling to correlation structure analysis of CpG island methylation in colorectal cancer. The American journal of pathology. 2010; 177:2731–2740.
60. Hughes LA, Simons CC, van den Brandt PA, Goldbohm RA, de Goeij AF, de Bruine AP, van Engeland M, Weijenberg MP. Body size, physical activity and risk of colorectal cancer with or without the CpG island methylator phenotype (CIMP). PloS one. 2011; 6:e18571.
61. Zlobec I, Bihl M, Foerster A, Rufle A, Lugli A. Comprehensive analysis of CpG island methylator phenotype (CIMP)-high, -low, and -negative colorectal cancers based on protein marker expression and molecular features. The Journal of pathology. 2011; 225:336–343.
62. Curtin K, Slattery ML, Samowitz WS. CpG island methylation in colorectal cancer: past, present and future. Pathology research international. 2011; 2011:902674.
63. Hinoue T, Weisenberger DJ, Lange CP, Shen H, Byun HM, Van Den Berg D, Malik S, Pan F, Noushmehr H, van Dijk CM, Tollenaar RA, Laird PW. Genome-scale analysis of aberrant DNA methylation in colorectal cancer. Genome research. 2012; 22:271–282.
64. Wong JJ, Hawkins NJ, Ward RL, Hitchins MP. Methylation of the 3p22 region encompassing MLH1 is representative of the CpG island methylator phenotype in colorectal cancer. Modern pathology : an official journal of the United States and Canadian Academy of Pathology, Inc. 2011; 24:396–411.
65. Yamada A, Minamiguchi S, Sakai Y, Horimatsu T, Muto M, Chiba T, Boland CR, Goel A. Colorectal Advanced Neoplasms Occur through Dual Carcinogenesis Pathways in Individuals with Coexisting Serrated Polyps. PloS one. 2014; 9:e98059.
66. Leggett B, Whitehall V. Role of the serrated pathway in colorectal cancer pathogenesis. Gastroenterology. 2010; 138:2088–2100.
67. Ogino S, Goel A. Molecular classification and correlates in colorectal cancer. The Journal of molecular diagnostics: JMD. 2008; 10:13–27.
68. Samowitz WS, Albertsen H, Herrick J, Levin TR, Sweeney C, Murtaugh MA, Wolff RK, Slattery ML. Evaluation of a large, population-based sample supports a CpG island methylator phenotype in colon cancer. Gastroenterology. 2005; 129:837–845.
69. Bariol C, Suter C, Cheong K, Ku SL, Meagher A, Hawkins N, Ward R. The relationship between hypomethylation and CpG island methylation in colorectal neoplasia. The American journal of pathology. 2003; 162:1361–1371.
70. van Rijnsoever M, Grieu F, Elsaleh H, Joseph D, Iacopetta B. Characterisation of colorectal cancers showing hypermethylation at multiple CpG islands. Gut. 2002; 51:797–802.
71. Lee S, Cho NY, Choi M, Yoo EJ, Kim JH, Kang GH. Clinicopathological features of CpG island methylator phenotype-positive colorectal cancer and its adverse prognosis in relation to KRAS/BRAF mutation. Pathology international. 2008; 58:104–113.
72. Ehrlich M. DNA methylation in cancer: too much, but also too little. Oncogene. 2002; 21:5400–5413.
73. Leodolter A, Alonso S, Gonzalez B, Ebert MP, Vieth M, Rocken C, Wex T, Peitz U, Malfertheiner P, Perucho M. Somatic DNA Hypomethylation in H. pylori-Associated High-Risk Gastritis and Gastric Cancer: Enhanced Somatic Hypomethylation Associates with Advanced Stage Cancer. Clinical and Translational Gastroenterology. 2015; 6:e85.
74. Suzuki K, Suzuki I, Leodolter A, Alonso S, Horiuchi S, Yamashita K, Perucho M. Global DNA demethylation in gastrointestinal cancer is age dependent and precedes genomic damage. Cancer cell. 2006; 9:199–207.
75. Alonso S, Dai Y, Yamashita K, Horiuchi S, Dai T, Matsunaga A, Sanchez-Munoz R, Bilbao-Sieyro C, Diaz-Chico JC, Chernov AV, Strongin AY, Perucho M. Methylation of MGMT and ADAMTS14 in normal colon MUCOSA: biomarkers of a field defect for cancerization preferentially targeting elder African-Americans. Oncotarget. 2015; 6:3420–3431.
76. Wu HC, Delgado-Cruzata L, Flom JD, Perrin M, Liao Y, Ferris JS, Santella RM, Terry MB. Repetitive element DNA methylation levels in white blood cell DNA from sisters discordant for breast cancer from the New York site of the Breast Cancer Family Registry. Carcinogenesis. 2012; 33:1946–1952.
77. Eads CA, Lord RV, Wickramasinghe K, Long TI, Kurumboor SK, Bernstein L, Peters JH, DeMeester SR, DeMeester TR, Skinner KA, Laird PW. Epigenetic patterns in the progression of esophageal adenocarcinoma. Cancer research. 2001; 61:3410–3418.
78. Widschwendter M, Siegmund KD, Muller HM, Fiegl H, Marth C, Muller-Holzner E, Jones PA, Laird PW. Association of breast cancer DNA methylation profiles with hormone receptor status and response to tamoxifen. Cancer research. 2004; 64:3807–3813.
79. Ogino S, Kawasaki T, Brahmandam M, Cantor M, Kirkner GJ, Spiegelman D, Makrigiorgos GM, Weisenberger DJ, Laird PW, Loda M, Fuchs CS. Precision and performance characteristics of bisulfite conversion and real-time PCR (MethyLight) for quantitative DNA methylation analysis. The Journal of molecular diagnostics: JMD. 2006; 8:209–217.
80. Boland CR, Thibodeau SN, Hamilton SR, Sidransky D, Eshleman JR, Burt RW, Meltzer SJ, Rodriguez-Bigas MA, Fodde R, Ranzani GN, Srivastava S. A National Cancer Institute Workshop on Microsatellite Instability for cancer detection and familial predisposition: development of international criteria for the determination of microsatellite instability in colorectal cancer. Cancer research. 1998; 58:5248–5257.
81. Roth AD, Tejpar S, Delorenzi M, Yan P, Fiocca R, Klingbiel D, Dietrich D, Biesmans B, Bodoky G, Barone C, Aranda E, Nordlinger B, Cisar L, Labianca R, Cunningham D, Van Cutsem E, et al. Prognostic role of KRAS and BRAF in stage II and III resected colon cancer: results of the translational study on the PETACC-3, EORTC 40993, SAKK 60–00 trial. Journal of clinical oncology : official journal of the American Society of Clinical Oncology. 2010; 28:466–474.
82. Li Q, Zhuo C, Liang L, Zheng H, Li D, Cai S. Lymph node count after preoperative radiotherapy is an independently prognostic factor for pathologically lymph node-negative patients with rectal cancer. Medicine. 2015; 94:e395.
83. Li QG, Li DW, Zhuo CH, Cai GX, Cai SJ. Metastatic lymph node ratio can further stratify prognosis in rectal cancer patients treated with preoperative radiotherapy: a population-based analysis. Tumour biology : the journal of the International Society for Oncodevelopmental Biology and Medicine. 2014; 35:6389–6395.
84. Camp RL, Dolled-Filhart M, Rimm DL. X-tile: a new bio-informatics tool for biomarker assessment and outcome-based cut-point optimization. Clinical cancer research: an official journal of the American Association for Cancer Research. 2004; 10:7252–7259.