
INTRODUCTION
Diffuse large B-cell lymphoma (DLBCL) is a heterogeneous aggressive non-Hodgkin lymphoma that can be classified into germinal center B-like (GCB) or activated B-cell-like (ABC) DLBCL. Aberrant activation of nuclear factor-kappaB (NF-κB), either through the “canonical” pathway activating p50/p65 and p50/c-Rel dimers, or through the “non-canonical” pathway activating p52/RelB dimers, has been associated with tumor proliferation and survival in DLBCL, especially in the ABC subtype [1, 2]. The canonical and non-canonical pathways are generally believed to be independent; however, the non-canonical pathway may attenuate activities of the canonical pathways [3].
c-Rel encoded by the REL gene is a unique NF-κB member, predominantly expressed in lymphoid and myeloid tissues, likely contributed by the unique regulators for c-Rel activation. NF-κB inhibitor IκBα preferentially inhibits p65/p50 dimers, whereas IκBε controls p65/c-Rel, and c-Rel activation also depends on the non-redundant regulator IκBβ [4–7], and the protease activities of MALT1 [8]. MALT1 inhibitors specifically impair c-Rel nuclear localization and display selective activity against ABC-DLBCL ex vivo [9]. In addition, novel IκB kinase (IKK)-dependent and proteasomal-independent pathway was found to degrade IκBα and activate p50/c-Rel in B-cells [10], triggered by stimuli different from the non-canonical NF-κB pathway. However, little is known about whether and how the upstream stimuli for NF-κB activation, e.g., signaling through B-cell receptors (BCR), T-cell receptors (TCR), tumor-necrosis factor (TNF) receptors, Toll-like receptors (TLR), and mitogen-activated protein kinases (MAPK) [11], differentially regulate c-Rel and other NF-κB subunits.
c-Rel has both nonredundant and overlapping functions compared with p65 and p50. c-Rel regulates cytokine production and plays an important role in proliferation and inflammation mainly regulating development of T-cells [12–14]. c-Rel promotes cell survival by transactivating antiapoptotic and cell cycle genes, such as BCLXL/BCL2L1, BCL2A1, XIAP, cIAP, and cyclins [4, 15, 16]. In addition, during GC reaction in B-cell development, c-Rel is required for B-cell activation before GC formation and maintenance of the GC reaction by regulating metabolism, fueling proliferation independent of Myc [17], and is crucial for the development of follicular helper T cells [7, 18]. c-Rel-knockout mice are viable but have deficiencies in immune responses [4, 19]. However, c-Rel, but not other NF-κB members, has a unique ability to transform avian lymphoid cells in vitro [4], and is associated with increased lymphoma risk in vivo [20].
c-Rel functions are also affected by the p53 pathway. In mouse models the requirement for NF-κB signaling in tumor development depends on the p53 status [21]. Wild-type (WT-) p53 and NF-κB antagonize each other, however NF-κB can also enhance p53 stability and activities in some circumstances [22]. In contrast, p53 mutants (MUT-p53) cooperate with NF-κB to promote tumor invasion and metastasis [23, 24]. p53 can also directly regulate NF-κB expression and activation. WT-p53 negatively regulates NF-κB activation and function [25, 26], whereas MUT-p53 induces p52/NFKB2 gene expression [27]. Moreover, crosstalk also exists between NF-κB and p63, another member of the p53 family [28–30]. Overexpression of ΔNp63α leads to increased c-Rel expression, and epidermal hyperplasia and diffuse inflammation in transgenic mice [28]. The ΔNp63α–c-Rel complex represses CDKN1A/p21 and promotes epithelial cell proliferation in human squamous carcinoma cells [29]. In head and neck squamous cell carcinoma with MUT-p53, c-Rel overexpression activated by TNF-α modulates ΔNp63α/Tap73 interactions and their function, promoting proliferation and cell survival [30].
c-Rel has been proposed to be an attractive therapeutic target, whose inhibition can suppress tumor growth without causing systemic tissue toxicity [19]. A study group showed that c-Rel inhibition is a novel strategy to ameliorate GVHD reduced alloactivation without compromising T-cell mediated immune responses [31], and a small molecule c-Rel inhibitor had anti-proliferative effect in both GCB- and ABC-DLBCL cell lines [32]. Since REL gene was found frequently amplified in DLBCL (~15%), REL activation may play a role in lymphomagenesis, which however, was not supported by immunofluorescence analysis [33]. One study of 68 de novo DLBCL cases found that 15 GCB-DLBCL cases positive for c-Rel nuclear expression by immunohistochemistry had worse survival compared to 9 GCB-DLBCL cases negative for c-Rel nuclear expression (P = 0.045) [34]. In contrast, another study using a > 30% cutoff for c-Rel nuclear staining showed that 57 c-Rel+ DLBCL patients had significantly better overall survival than 31 c-Rel− DLBCL patients [35]. Large scale studies of REL amplification and c-Rel nuclear expression, and the prognostic impact of concurrent dysregulation of NF-κB and TP53 [36] in DLBCL are lacking. In this study, we aimed to evaluate the clinical significance of c-Rel nuclear expression and REL amplification in DLBCL patients, to gain insight into the underlying biology, c-Rel function, activation mechanisms, and relationship with other NF-κB subunits.
RESULTS
c-Rel nuclear expression and correlation with nuclear expression of other NF-κB subunits
Immunohistochemistry was used to analyze the nuclear expression of c-Rel, as the surrogate marker for c-Rel activation [34] (Fig. 1A). A cutoff of ≥ 5% of tumor cells with positive c-Rel staining nuclei was used to identify positive c-Rel nuclear expression (c-Rel+). Using this cutoff, 137 patients (26.3%) of the 460 successfully stained cases had c-Rel+ DLBCL, with different expression levels (5–90% of the tumor cells with c-Rel+ nuclei), whereas majority (73.7%) of the cases were negative for c-Rel nuclear expression with or without cytoplasmic staining (Fig. 1B, Supplementary Fig. S1A). The mean expression level of nuclear c-Rel was significantly lower than those of nuclear p65 and p50 in our cohort (Supplementary Fig. S1B).
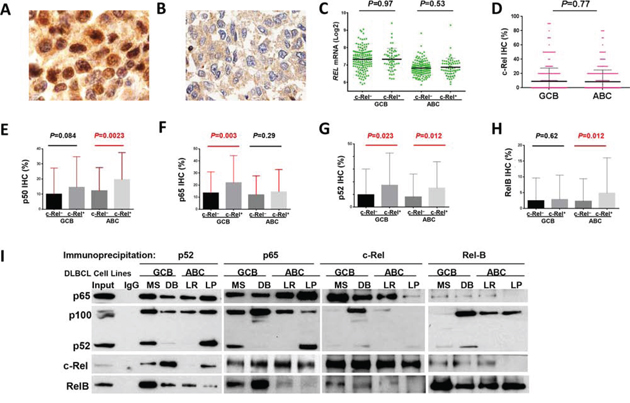
Figure 1: Nuclear expression of c-Rel and other NF-κB subunits. A-B. Representative immunohistochemical staining for positive and negative nuclear c-Rel expression. C. Nuclear c-Rel positivity did not correlate with REL mRNA levels in GCB- and ABC-DLBCL. D. Expression levels of nuclear c-Rel did not show significant difference between GCB- and ABC-DLBCL. E-H. Association of c-Rel positivity with nuclear expression of other NF-κB subunits. Note: red lines indicate upregulation whereas blue lines indicated downregulation with significant or border-line P values. I. Dimerization of NF-κB subunits in DLBCL in vitro. Nuclear extract purified from MS and DB (GCB), and LR and LP (ABC) cells were subjected to coimmunoprecipitation analysis with p65, c-Rel, p52, and RelB antibodies. Normal rabbit IgG was used as a nonspecific negative control. Precipitated immune-complexes were subjected to Western blot analysis with p65, c-Rel, p52, and RelB antibodies.
Nuclear c-Rel positivity did not correlate with REL mRNA levels by Spearman rank correlation (r = 0.004, P = 0.94), either in GCB- or ABC-DLBCL (Fig. 1C). Consistent with a previous study [35], GCB- and ABC-DLBCL had similar level of nuclear c-Rel protein expression (Fig. 1D). However, REL mRNA was significantly higher in the GCB subtype (P < 0.0001), even after exclusion of cases with REL amplification or potential gains due to polysomies (Supplementary Fig. S1C).
Nuclear expression levels of c-Rel correlated positively with expression of other NF-κB subunits (significant for p52 and RelB by Spearman rank correlation): p50 (r = 0.12, P = 0.12), p52 (r = 0.26, P = 0.724E-8), p65 (r = 0.085, P = 0.073), and RelB (r = 0.12, P = 0.013). c-Rel+ correlated with significantly higher levels of nuclear p65 and p52 in GCB-DLBCL, and p50, p52 and RelB in ABC-DLBCL (Fig. 1E-H). At the mRNA level, c-Rel+ correlated with upregulation of NFKB1 and RELA (but not NFKB2 or RELB) in ABC-DLBCL (Supplementary Fig. S1D-E). It has been known that c-Rel predominately forms dimers with p50 [1]. Our coimmunoprecipitation analysis using nuclear extracts purified from representative human derived GCB- and ABC-DLBCL cell lines (MS, DB, LR, LP) however showed that c-Rel predominantly binds to p65 in all cell lines (more intense in GCB than ABC cell lines); and that in some cell lines, p52 and RelB also formed dimers with c-Rel but to a lesser extent (Fig. 1I).
Prognostic impact of c-Rel nuclear expression
Clinicopathologic features
The clinicopathologic features of the study cohort are shown in Table 1. Interestingly, the c-Rel+ DLBCL group had a higher proportion of patients with extranodal disease (P = 0.0033), and had no association with other clinical parameters. Pathologically, the c-Rel+ compared to the c-Rel− DLBCL group less frequently had Myc or pAKT overexpression, whereas more frequently expressed nuclear p50, p52 and RelB (Table 1).
Table 1: Clinicopathologic characteristics of 460 de novo DLBCL patients treated with R-CHOP
Variables |
DLBCL |
P |
GCB-DLBCL |
P |
ABC-DLBCL |
P |
|||
c-Rel+ |
c-Rel− |
c-Rel+ |
c-Rel− |
c-Rel+ |
c-Rel− |
||||
N (%) |
N (%) |
N (%) |
N (%) |
N (%) |
N (%) |
||||
Patients |
137 (100) |
323 (100) |
66 (100) |
165 (100) |
70 (100) |
158 (100) |
.68 |
||
Gender |
|||||||||
Male |
78 (57) |
192 (59) |
.61 |
31 (47) |
104 (63) |
.025 |
46 (66) |
88 (56) |
.16 |
Female |
59 (43) |
131 (41) |
35 (53) |
61 (37) |
24 (34) |
70 (44) |
|||
Age (yr) |
|||||||||
<60 |
52 (38) |
140 (43) |
.30 |
29 (44) |
86 (52) |
.31 |
22 (31) |
54 (34) |
.76 |
≥60 |
85 (62) |
183 (57) |
37 (56) |
79 (48) |
48 (69) |
104 (66) |
|||
Stage |
|||||||||
I-II |
65 (50) |
143 (46) |
.39 |
36 (57) |
84 (53) |
.56 |
28 (42) |
59 (38) |
.54 |
III-IV |
65 (50) |
171 (54) |
27 (43) |
75 (47) |
38 (58) |
96 (62) |
|||
B-symptoms |
|||||||||
No |
88 (71) |
196 (63) |
.099 |
46 (79) |
108 (68) |
.09 |
42 (65) |
88 (58) |
.33 |
Yes |
36 (29) |
117 (37) |
12 (21) |
52 (32) |
23 (35) |
65 (42) |
|||
LDH |
|||||||||
Normal |
46 (40) |
113 (37) |
.56 |
24 (44) |
57 (37) |
.37 |
22 (37) |
56 (37) |
.98 |
Elevated |
69 (60) |
193 (63) |
31 (56) |
98 (63) |
37 (63) |
95 (63) |
|||
# of extranodal sites |
|||||||||
0-1 |
103 (80) |
235 (75) |
.31 |
49 (80) |
121 (77) |
.55 |
54 (81) |
114 (74) |
.29 |
≥2 |
26 (20) |
77 (25) |
12 (20) |
37 (23) |
13 (19) |
40 (26) |
|||
Performance status |
|||||||||
0-1 |
95 (86) |
247 (83) |
.47 |
48 (94) |
125 (83) |
.055 |
46 (78) |
122 (82) |
.52 |
≥2 |
16 (14) |
52 (17) |
3 (6) |
25 (17) |
13 (22) |
27 (18) |
|||
Size of largest tumor |
|||||||||
<5 cm |
47 (53) |
149 (58) |
.38 |
22 (51) |
78 (61) |
.24 |
25 (54) |
71 (55) |
.94 |
≥5cm |
42 (47) |
107 (42) |
21 (49) |
49 (39) |
21 (46) |
58 (45) |
|||
IPI risk group |
|||||||||
0-2 |
83 (65) |
189 (60) |
.32 |
46 (75) |
104 (65) |
.14 |
36 (54) |
85 (54) |
.99 |
3-5 |
45 (35) |
127 (40) |
15 (25) |
56 (35) |
30 (46) |
71 (46) |
|||
Therapy response |
|||||||||
CR |
103 (75) |
247 (77) |
.77 |
51 (77) |
121 (73) |
.54 |
51 (73) |
126 (80) |
.25 |
PR |
17 |
42 |
7 |
20 |
10 |
22 |
|||
SD |
6 |
13 |
4 |
8 |
2 |
5 |
|||
PD |
11 |
21 |
4 |
16 |
7 |
5 |
|||
Primary origin |
|||||||||
Nodal |
70 (53) |
222 (69) |
.0015 |
36 (57) |
113 (69) |
.095 |
34 (51) |
109 (69) |
.0077 |
Extranodal |
61 (47) |
99 (31) |
27 (43) |
51 (31) |
33 (49) |
48 (31) |
|||
Ki-67 |
|||||||||
<70% |
49 (36) |
113 (35) |
1.0 |
27 (41) |
64 (39) |
.88 |
22 (31) |
49 (31) |
1.0 |
≥70% |
88 (64) |
207 (65) |
39 (59) |
98 (61) |
48 (69) |
109 (69) |
|||
TP53 mutation |
|||||||||
WT TP53 |
91 (74) |
222 (78) |
.45 |
42 (71) |
107 (72) |
1.0 |
49 (77) |
115 (84) |
.24 |
MUT TP53 |
32 (26) |
64 (22) |
17 (29) |
42 (28) |
15 (23) |
22 (16) |
|||
MYC translocation |
|||||||||
− |
93 (91) |
180 (86) |
.27 |
44 (94) |
77 (78) |
.0019 |
49 (89) |
103 (94) |
.36 |
+ |
9 (9) |
29 (14) |
3 (6) |
22 (22) |
6 (11) |
7 (6) |
|||
BCL2 translocation |
|||||||||
− |
103 (81) |
208 (82) |
1.0 |
43 (69) |
82 (66) |
.63 |
60 (92) |
126 (97) |
.16 |
+ |
24 (19) |
47 (18) |
19 (31) |
43 (34) |
5 (8) |
4 (3) |
|||
BCL6 translocation |
|||||||||
− |
75 (70) |
144 (65) |
.37 |
43 (83) |
82 (72) |
.14 |
31 (57) |
62 (58) |
.95 |
+ |
32 (30) |
77 (35) |
9 (17) |
32 (28) |
23 (43) |
45 (42) |
|||
Nuclear p50 |
|||||||||
− |
50 (37) |
168 (53) |
.0014 |
32 (49) |
102 (62) |
.076 |
18 (26) |
66 (44) |
.016 |
+ |
86 (63) |
147 (47) |
34 (51) |
62 (38) |
51 (74) |
85 (56) |
|||
Nuclear p52 |
|||||||||
− |
77 (57) |
231 (77) |
<.0001 |
38 (59) |
115 (76) |
.022 |
39 (56) |
116 (79) |
.0007 |
+ |
58 (43) |
68 (23) |
26 (41) |
37 (24) |
31 (44) |
31 (21) |
|||
Nuclear p65 |
|||||||||
− |
48 (35) |
135 (43) |
.12 |
21 (32) |
65 (41) |
.23 |
27 (39) |
70 (45) |
.39 |
+ |
89 (65) |
179 (57) |
45 (68) |
93 (59) |
43 (61) |
86 (55) |
|||
Nuclear RelB |
|||||||||
− |
109 (81) |
266 (88) |
.056 |
54 (83) |
139 (89) |
.28 |
54 (78) |
127 (87) |
.11 |
+ |
26 (19) |
37 (12) |
11 (17) |
18 (11) |
15 (22) |
19 (13) |
|||
Abbreviations: DLBCL, diffuse large B-cell lymphoma; GCB, germinal center B-cell like; ABC, activated B-cell like; LDH, lactate dehydrogenase; IPI, international prognostic index; CR, complete remission; PR, partial response; SD, stable disease; PD, progressive disease.
Moreover, dividing into GCB and ABC subtypes, c-Rel+ GCB-DLBCL was associated with female sex, low ECOG performance status score, and less MYC translocations compared with c-Rel− GCB-DLBCL, whereas in the ABC subtype, c-Rel+ ABC-DLBCL was associated with extranodal disease (Table 1).
Univariate survival analysis in various DLBCL molecular subsets
c-Rel nuclear expression did not correlate with patient survival in the overall- or GCB-DLBCL, whereas c-Rel+ ABC-DLBCL tended to have a poorer survival (Fig. 2A-2C). However, in DLBCL especially in ABC-DLBCL with low Bcl-2 (<70%), c-Rel+ correlated significantly with poorer survival (Fig. 2D). In an effort to identify the functionally relevant c-Rel dimers, we examined the prognostic impact of c-Rel+ within the following DLBCL subsets: p50−, p65−, p52−, RelB−, p50+, p65+, p52+ and RelB+. c-Rel+ DLBCL showed trends toward poorer survival only within the p50+ and p65+ subsets but not in other subsets (Fig. 2E-2F).
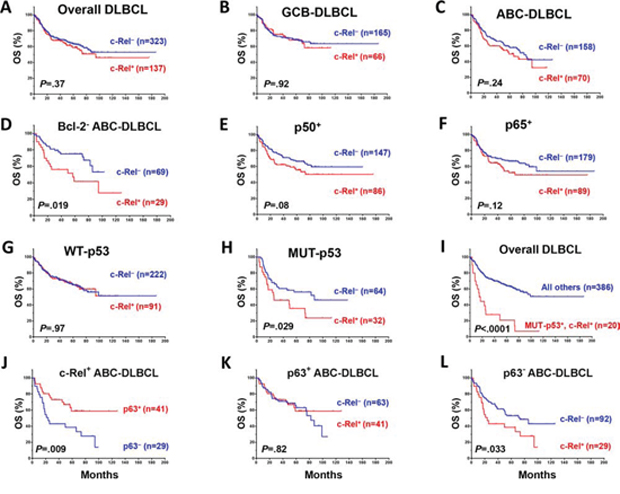
Figure 2: Prognostic significance of c-Rel nuclear expression in various DLBCL subsets. A–B. In the overall- and GCB-DLBCL, c-Rel positivity did not correlate with patient survival. C. In ABC-DLBCL, c-Rel+ as a univariate did not correlate significantly with patient survival although a trend toward poorer survival was suggested. D. In Bcl-2− (<70%) ABC-DLBCL, c-Rel+ correlated with significantly poorer patient survival. E–F. c-Rel+ concurrent with p50 or p65 expression correlated with poorer patient survival with marginal P values. G–I. In DLBCL with MUT-p53 but not WT-p53, c-Rel+ correlated with significantly poorer patient survival. J. In ABC-DLBCL with c-Rel nuclear expression, p63 expression correlated with significantly better patient survival. K–L. Only in p63− but not p63+ ABC-DLBCL subcohort, c-Rel positivity correlated with significantly poorer patient survival. Abbreviations: OS, overall survival; PFS, Progression-free survival.
c-Rel nuclear expression did not correlate with survival in DLBCL patients with WT-p53 (however, the c-Rel+ compared with the c-Rel− group had a small proportion of patients with stage III/IV disease, Table 2). In contrast, among DLBCL patients with MUT-p53, c-Rel+ correlated with significantly worse survival (Fig. 2G-2H). The prognostic impact of c-Rel positivity in the p65−, p65+, p50− and p50+ subsets with WT-p53 or MUT-p53 was shown in Supplementary Figure S2A-2H. Among all the DLBCL patients, c-Rel nuclear expression concurrent with TP53 mutations significantly predicted poorer survival (Fig. 2I). Moreover, p63 appears to be another tumor suppressor beside WT-p53 in suppressing the adverse impact of c-Rel activation, suggested by the correlation of p63 expression with better survival in c-Rel+ ABC-DLBCL (Fig. 2J), and a similar trend in GCB-DLBCL patients (P = 0.18). However, the favorable correlation of p63 expression in c-Rel+ ABC-DLBCL was abrogated by TP53 mutations (Supplementary Fig. S2K). Conversely, c-Rel conferred significantly poorer survival in p63− but not in p63+ ABC-DLBCL (Fig. 2K-L). In patients with p63+ ABC-DLBCL, c-Rel conferred significantly poorer survival when concurrent with TP53 mutations (Supplementary Fig. S2K).
Table 2: Clinicopathologic characteristics of c-Rel+ versus c-Rel− DLBCL patients with wild type (WT) or mutated (MUT) p53
Variables |
WT-p53 |
WT-p53 |
P |
MUT-p53 |
MUT-p53 |
P |
N (%) |
N (%) |
N (%) |
N (%) |
|||
Patients |
91 (100) |
222 (100) |
32 (100) |
64 (100) |
.45 |
|
Gender |
||||||
Male |
52 (57) |
135 (61) |
.55 |
21 (66) |
35 (55) |
.31 |
Female |
39 (43) |
87 (39) |
11 (34) |
29 (45) |
||
Age (yr) |
||||||
<60 |
34 (38) |
89 (40) |
.70 |
11 (34) |
27 (42) |
.51 |
≥60 |
57 (62) |
133 (60) |
21 (26) |
37 (58) |
||
Stage |
||||||
I-II |
46 (55) |
92 (43) |
.067 |
16 (50) |
29 (45) |
.66 |
III-IV |
38 (45) |
122 (57) |
16 (50) |
35 (55) |
||
B-symptoms |
||||||
No |
61 (74) |
138 (65) |
.10 |
21 (75) |
40 (63) |
.24 |
Yes |
21 (26) |
76 (35) |
7 (25) |
24 (37) |
||
Serum LDH |
||||||
Normal |
35 (49) |
82 (39) |
.16 |
9 (31) |
22 (36) |
.64 |
Elevated |
37 (51) |
127 (61) |
20 (69) |
39 (64) |
||
# of extranodal sites |
||||||
0–1 |
70 (83) |
160 (75) |
.13 |
26 (84) |
49 (78) |
.49 |
≥2 |
14 (17) |
53 (25) |
5 (16) |
14 (22) |
||
ECOG score |
||||||
0–1 |
62 (87) |
172 (84) |
.54 |
25 (89) |
53 (88) |
.90 |
≥2 |
9 (13) |
32 (16) |
3 (11) |
7 (12) |
||
Size of largest tumor |
||||||
<5cm |
33 (58) |
113 (61) |
.70 |
9 (39) |
29 (53) |
.27 |
≥5cm |
24 (42) |
73 (39) |
14 (61) |
26 (47) |
||
IPI risk group |
||||||
0–2 |
58 (70) |
128 (59) |
.082 |
20 (65) |
37 (59) |
.59 |
3–5 |
25 (30) |
89 (41) |
11 (35) |
26 (41) |
||
Therapy response |
||||||
CR |
74 (81) |
178 (80) |
.82 |
17 (53) |
43 (67) |
.18 |
PR |
10 |
25 |
5 |
14 |
||
SD |
2 |
6 |
4 |
2 |
||
PD |
5 |
13 |
6 |
5 |
||
Ki-67 |
||||||
<70% |
39 (43) |
77 (35) |
.20 |
6 (19) |
19 (30) |
.33 |
≥70% |
52 (57) |
143 (65) |
26 (81) |
44 (70) |
||
Cell-of-origin |
||||||
ABC |
49 (54) |
115 (52) |
.80 |
15 (47) |
22 (34) |
.27 |
GCB |
42 (46) |
107 (48) |
17 (53) |
42 (66) |
||
Nuclear p50 |
||||||
− |
31 (34) |
109 (50) |
.012 |
13 (41) |
38 (61) |
.08 |
+ |
59 (66) |
108 (50) |
19 (59) |
24 (39) |
||
Nuclear p52 |
||||||
− |
53 (59) |
157 (76) |
.0053 |
16 (50) |
49 (83) |
.0014 |
+ |
37 (41) |
50 (24) |
16 (50) |
10 (17) |
||
Nuclear p65 |
||||||
− |
37 (41) |
101 (47) |
.38 |
10 (31) |
20 (32) |
1.0 |
+ |
54 (59) |
115 (53) |
22 (69) |
42 (68) |
||
Nuclear RelB |
||||||
− |
73 (81) |
179 (86) |
.30 |
24 (77) |
55 (93) |
.043 |
+ |
17 (19) |
29 (14) |
7 (23) |
4 (7) |
||
MYC translocation |
||||||
− |
69 (93) |
130 (87) |
.18 |
19 (91) |
30 (83) |
.70 |
+ |
5 (7) |
20 (13) |
2 (9) |
6 (17) |
Abbreviations: DLBCL, diffuse large B-cell lymphoma; LDH, lactate dehydrogenase; IPI, international prognostic index; CR, complete remission; PR, partial response; SD, stable disease; PD, progressive disease; GCB, germinal center B-like; ABC, activated B-cell-like.
Multivariate survival analysis in overall-, GCB- and ABC-DLBCL and in the WT-/MUT-p53 subsets
Multivariate survival analysis adjusting clinical parameters only (IPI alone or using individual five IPI components, sex, B-symptoms, and tumor size) indicated that c-Rel+ was not an independent prognostic factor. However, when the potentially compounding biomarkers (Myc+, Bcl-2+, and TP53 mutations, Table 1) were also included in the multivariate analysis, c-Rel+ showed significant prognostic value for poorer overall survival in the whole and ABC-DLBCL cohorts. c-Rel+ also predicted poorer progression-free survival in ABC-DLBCL with a borderline P value (Table 3). c-Rel+ did not predict survival in GCB-DLBCL.
Table 3: Multivariate survival analysis of clinicopathologic parameters in DLBCLs treated with R-CHOP
Variables |
OS |
PFS |
|||||
HR |
95% CI |
P |
HR |
95% CI |
P |
||
Overall DLBCL |
|||||||
B-symptoms |
1.54 |
1.06–2.23 |
.024 |
1.40 |
.97–2.01 |
.07 |
|
IPI >2 |
2.25 |
1.53–3.27 |
<.0001 |
1.96 |
1.36–2.81 |
<.0001 |
|
Female |
.96 |
.66–1.41 |
.85 |
1.00 |
.70–1.43 |
.98 |
|
Tumor size ≥5cm |
1.35 |
.94–1.95 |
.11 |
1.32 |
.93–1.87 |
.12 |
|
c-Rel+ |
1.55 |
1.08–2.23 |
.018 |
1.30 |
.92–1.83 |
.14 |
|
Bcl-2+ |
2.15 |
1.49–3.72 |
<.0001 |
1.92 |
1.15–2.72 |
<.0001 |
|
Myc+ |
2.35 |
1.49–3.72 |
<.0001 |
2.17 |
1.43–3.31 |
<.0001 |
|
TP53 mutation |
1.69 |
1.13–2.50 |
.011 |
1.69 |
1.36–2.81 |
.007 |
|
ABC DLBCL |
|||||||
B-symptoms |
1.29 |
.79–2.12 |
.31 |
1.23 |
.76–1.99 |
.39 |
|
IPI >2 |
2.17 |
1.29–3.67 |
.004 |
1.93 |
1.17–3.17 |
.01 |
|
Female |
1.25 |
.77–2.03 |
.38 |
1.28 |
.80–2.05 |
.31 |
|
Tumor size ≥5cm |
1.19 |
.74–1.92 |
.48 |
1.12 |
.71–1.77 |
.63 |
|
c-Rel+ |
1.69 |
1.06–2.68 |
.026 |
1.49 |
.96–2.33 |
.076 |
|
Bcl-2+ |
1.93 |
1.15–3.24 |
.013 |
1.85 |
1.13–3.00 |
.014 |
|
Myc+ |
2.18 |
1.16–4.09 |
.015 |
1.79 |
1.01–3.18 |
.047 |
|
TP53 mutation |
2.19 |
1.20–3.99 |
.011 |
1.88 |
1.04–3.39 |
.035 |
|
DLBCL with WT-p53 |
|||||||
B-symptoms |
1.60 |
1.04–2.47 |
.033 |
1.55 |
1.03–2.35 |
.037 |
|
IPI >2 |
2.38 |
1.55–3.66 |
<.0001 |
2.13 |
1.42–3.18 |
<.0001 |
|
Female |
.98 |
.63–1.52 |
.92 |
.96 |
.64–1.46 |
.86 |
|
Tumor size ≥5cm |
1.22 |
.80–1.87 |
.36 |
1.10 |
.73–1.65 |
.65 |
|
c-Rel+ |
1.87 |
1.23–2.84 |
.003 |
1.58 |
1.07–2.34 |
.023 |
|
DLBCL with MUT-p53 |
|||||||
B-symptoms |
1.21 |
.56–2.62 |
.63 |
1.06 |
.51–2.19 |
.87 |
|
IPI >2 |
2.91 |
1.40–6.04 |
.004 |
2.54 |
1.28–5.04 |
.008 |
|
Female |
.77 |
.38–1.56 |
.47 |
.88 |
.45–1.71 |
.70 |
|
Tumor size ≥5cm |
1.74 |
.84–3.62 |
.14 |
1.91 |
.96–3.79 |
.065 |
|
c-Rel+ |
.60 |
.27–1.34 |
.22 |
.62 |
.30–1.30 |
.21 |
|
Abbreviations: OS, overall survival; PFS, progression-free survival; HR, hazard ratio; CI, confidence interval; IPI, international prognostic index. Cutoffs for c-Rel+, Bcl-2+, and Myc+: 5% and 70% respectively.
Interestingly, in the WT-p53 subset, multivariate survival analysis adjusting clinical parameters indicated that c-Rel+ was an independent adverse prognostic factor (Table 3). Dividing into GCB and ABC subcohorts, the P values for the prognostic significance of c-Rel positivity remained significant for OS in both GCB- and ABC-DLBCL with WT-p53 after adjusting all the clinical parameters (P = 0.025 and P = 0.019 respectively), and for PFS in ABC-DLBCL with WT-p53 (P = 0.04). In the MUT-p53 subset, on the contrary, multivariate survival analysis adjusting clinical parameters suggested that the predictive value of c-Rel+ for poorer survival was not significant.
Potential molecular mechanisms underlying the prognostic impact of c-Rel positivity
A multitude of correlation and GEP analysis were performed to understand the prognostic effect of c-Rel nuclear expression observed in our cohorts.
Decreased AKT, Myc, and p53 expression in c-Rel+ patients
Contrary to expectation at the protein level, there were inverse correlations between c-Rel and pAKT (r = −0.22, P = 0.0008; Fig. 3A, Supplementary Fig. S1F) in DLBCL, between c-Rel and Myc (r = −0.20, P = 2.92E-5), and between c-Rel and p53 (WT or MUT) (r = −0.20, P = 0.005) in GCB subtype by Spearman rank correlation (Fig. 3B, 3D; Supplementary Fig. S1G-S1H). Higher c-Rel expression levels (≥30%) coincided with decreased Myc in both GCB- and ABC-DLBCL (Fig. 3C). These correlations may not have resulted from transcriptional regulations by c-Rel, since c-Rel positivity did not correlate with AKT1, MYC (Supplementary Fig. S1I-1J) or TP53 (P = 0.34 in GCB-DLBCL, and P = 0.088 for TP53 upregulation in ABC-DLBCL) mRNA expression significantly, and that in GCB-DLBCL cases without MYC translocations, c-Rel+ still correlated with decreased Myc levels in GCB-DLBCL.
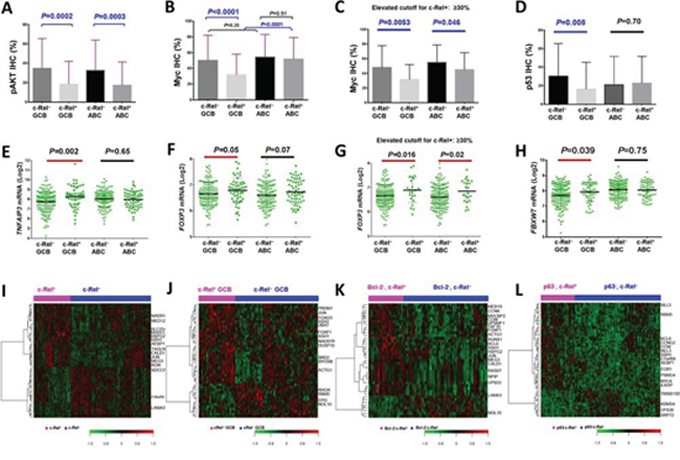
Figure 3: Gene and protein expression analysis correlating with c-Rel nuclear expression. A–D. c-Rel positivity correlated with significantly lower levels of pAKT, Myc or p53 protein expression in DLBCL or GCB-DLBCL. E–F. A20/TNFAIP3 which negatively regulates BCR, TNF, and NF-κB signaling, and c-Rel target gene FOXP3, were significantly upregulated in c-Rel+ GCB-DLBCL. G. Higher c-Rel expression levels (≥30%) correlated with significantly higher FOXP3 mRNA levels in both GCB- and ABC-DLBCL. H. FBXW7 was significantly upregulated in c-Rel+ GCB-DLBCL. Note: red lines indicate upregulation whereas blue lines indicated downregulation with significant or border-line P values. I–J. Heatmaps by gene expression profiling analysis between c-Rel+ and c-Rel− DLBCL in the overall and GCB-DLBCL cohorts. K. Heatmap by gene expression profiling analysis between c-Rel+ and c-Rel− DLBCL with low Bcl-2 expression (<70%). L. Heatmap by gene expression profiling analysis between c-Rel+ and c-Rel− DLBCL without p63 expression.
To understand the mechanisms underlying these inverse correlations, we compared the mRNA expression levels of genes known for c-Rel activation in c-Rel+ and c-Rel− DLBCL. We found that genes involved in BCR signaling, including CD79A, CD19, LYN, SYK, CARD11, MALT1, BLNK, BTK, and ZAP70 [2], and MAP3K7/TAK1 [7], were significantly upregulated in c-Rel+ compared with c-Rel− GCB-DLBCL. These genes did not show significantly differential expression correlating to c-Rel+ in ABC-DLBCL (Supplementary Fig. S3A-S3J). TNF, MAPK and TLR signaling which are also known as NF-κB activation mechanisms [3, 11], might not contribute to c-Rel activation significantly in our DLBCL cohort, suggested by non-significant correlations between c-Rel positivity and gene expression of CD40 (GCB, P = 0.23; ABC, P = 0.70), MAP3K14/NIK (GCB, P = 0.39; ABC, P = 0.29), BAFF (GCB, P = 0.38; ABC, P = 0.73), TNF (GCB, P = 0.51; ABC, P = 0.61), TNFRSF11 (GCB, P = 0.75; ABC, P = 0.83), TNFSF11 (GCB, P = 0.74; ABC, P = 0.84), TNFRSF8 (GCB, P = 0.51; ABC, P = 0.22), TNFSF8 (GCB, P = 0.69; ABC, P = 0.72), TRAIL (GCB, P = 0.58; ABC, P = 0.17), TRAF1/2/5/6 (GCB, P = 0.10, 0.89. 0.48 and 0.43 respectively; ABC, P = 0.37, 0.66, 0.35 and 0.83 respectively), TANK (GCB, P = 0.37; ABC, P = 0.44), MAP3K8 (GCB, P = 0.12; ABC, P = 0.51), MAP3K3 (GCB, P = 0.89; ABC, P = 0.68), TLR4 (GCB, P = 0.53; ABC, P = 0.06 for downregulation) and etc. However, TNFRSF13C (encoding BAFFR) and TLR2 were significantly upregulated in GCB-DLBCL (P = 0.017 and P = 0.018 respectively). Other TLRs (TLR1, 3, 5–10) did not show significantly differential expression between the c-Rel+ and c-Rel− groups.
On the other hand, A20/TNFAIP3 and TNIP1 which terminate NF-κB signaling [37] were also significantly upregulated in c-Rel+ GCB-DLBCL (Fig. 3E, Supplementary Fig. S3K). Analyzing expression of NF-κB regulators IKK and IκB genes showed that IKK2/IKBKB (but not IKK1) was upregulated in c-Rel+ GCB-DLBCL (marginal P value; Supplementary Fig. S3L), suggesting that activation of c-Rel was mediated through the canonical pathway [2]. Genes encoding IκBα/β/ε (which sequester NF-κB in the cytoplasm) and IκB-zeta (which inhibits NF-κB transcription activity) were significantly upregulated in either GCB- or ABC-DLBCL (Supplementary Fig. S3M-P), resembling p65 function [38].
Upregulation of TNFAIP3/A20 and TNIP1 (which inhibit MALT1, IKK3 and TRAF6 [37]) in c-Rel+ GCB-DLBCL (Fig. 3E) may be relevant for the decrease of pAKT and Myc levels coincided with c-Rel positivity (Fig. 3A-3C) and the lack of c-Rel prognostic impact [39, 40]. Upregulation of IKK2 and IκBs in c-Rel+ GCB-DLBCL may contribute to the decreased p53 levels in GCB-DLBCL (Fig. 3D) [41]. In addition, decrease of Myc may also result from MYC repression by FOXP3 [42] and posttranslational regulation of Myc stability by the ubiquitin-proteasome system. This was suggested by the upregulation of FOXP3 (Fig. 3F-3G) in c-Rel+ DLBCL which was opposite to the decrease of Myc in c-Rel+ DLBCL (≥5% and 30% cutoff respectively) (Fig. 3B-3C), and upregulation of FBXW7 (Fig. 3H), PIN1 (P < 0.0001), and PPP2R2A (P = 0.043) (which facilitate Myc degradation [43]) in c-Rel+ GCB-DLBCL.
Expression of c-Rel target genes
c-Rel is known to transcriptionally regulate genes involved in inflammation, immune cell development and cell survival [4, 7]. Gene expression analysis between c-Rel+ and c-Rel− DLBCL showed up- or downregulation of FOXP3 (Fig. 3F-3G), IL1B, IL3, IL6, IL10RA, IL12B, IL12RB1, IL17A, STAT3, JAK1/3, RUNX1/3, CXCR4, PRDM1, TP63, and CDKN1A (border-line P value) (Supplementary Fig. S4B-O) in c-Rel+ versus c-Rel− DLBCL, either in the GCB or ABC subtype. c-Rel did not appear to correlate with transcription of apoptotic genes significantly (data not shown) except antiapoptotic CFLAR (upregulated in GCB-DLBCL, P = 0.043, Supplementary Fig. S4P). Gene expression of antiapoptotic BCL2L1 (P = 0.13), MCL1 (P = 0.10), and TRAF1 (P = 0.10) also tended to be higher in c-Rel+ GCB-DLBCL.
Gene expression signature of c-Rel expression in overall-, GCB- and ABC-DLBCL
To better understand regulation and function of c-Rel underlying its clinical impact, genome-wide gene expression of c-Rel+ and c-Rel− DLBCLs were compared in the overall and subsets of cohorts. Distinct GEP signatures were shown in overall- (Fig. 3I; Table 4) and GCB- (Fig. 3J; Supplementary Table S1) but not in ABC-DLBCL. These c-Rel signatures showed similarity and difference with that in T-cells [44], including genes involved in signaling, transcription, differentiation, tumor suppression, metabolism, cytoskeleton, adhesion, extracellular matrix assembly, metastasis and angiogenesis. AEBP1 promoting degradation of IκBα and NF-κB activation, and UBA7 encoding an E1 ubiquitin-activating enzyme were upregulated, whereas SDCCAG1 with a role in nuclear export was downregulated in c-Rel+ DLBCL. BRD2 encoding a BET transcription factor, which enhances IKK activity and NF-κB activation in ABC-DLBCL in vitro and in vivo [45], was significantly upregulated in c-Rel+ GCB-DLBCL. Upregulation of FOXO3 in c-Rel+ GCB-DLBCL, which is negatively regulated by PI3K/AKT and inhibits MYC expression and function directly or indirectly [46], is consistent with the decreased pAKT and Myc levels in c-Rel+ DLBCL. MEG3, which encodes a long non-coding RNA that increases p53 levels, and tumor suppressor gene RBM5 were upregulated in c-Rel+ DLBCL and c-Rel+ GCB-DLBCL respectively.
Table 4: Gene signatures of c-Rel+ in the overall DLBCL cohort (false discovery rate < .10), and gene signatures of REL amplification identified in the overall (false discovery rate < .05, fold change >2) or GCB-DLBCL cohort (false discovery rate < .05)
Function |
c-Rel+ vs. c-Rel− |
REL amp+ vs. REL amp− |
||
Upregulated |
Downregulated |
Upregulated |
Downregulated |
|
Mitogen, cytokine, growth factor, receptors, signal transduction, NF-κB activation |
CTGF, AEBP1, IGFBP7, GPR124, RASEF, PTGFRN |
PTP4A3, CCL17, KISS1R*, IL8*, CD80*, CAMKK2* |
P2RX5, IL7, PRKCB |
|
DNA replication, recombination, cell cycle |
MLF1IP |
C10orf78 |
STAG3, H1F0*, NDNL2* |
|
Gene expression, transcription and translation regulation |
JUN, MED12, SFMBT2, NSD1 |
KDM5A, ZNF267, TCERG1 |
REL‡, PUS10‡, FYTTD1, CREM‡, DENND4A‡, ZNF711, KDM4B, PAPOLG‡, SSX4, MED13L* |
FOXP1 |
Actin, cytoskeleton, collagen, cell morphology, adhesion, extracellular matrix, migration, muscular system function |
TAGLN, CALD1, MYH11, CCDC80, SSH1, BGN, HSPG2, KIAA1109 |
LAMA3 |
CCT4, PLS3, KIF26B‡, ABLIM1, DYNC1I1*, DNAH14* |
|
Protein sorting, protein and vesicle’s trafficking, transportation, chaperone |
GGA3, COG5 |
SEC23B, PLDN, TXNDC9, TGOLN2, SRP72, SDCCAG1, NIPSNAP3A |
CSMD1‡, CLCNKB, AHSA2‡, XPO1, PEX13‡ |
|
Metabolism, redox |
NADSYN1, CKMT1A/B, SLC25A16, POMT2 |
C18orf55, YME1L1 |
CTPS2 |
ODC1, GBA2* |
Tumor suppressor, apoptosis, autophagy |
MEG3 |
CISD2 |
CSMD1‡, TUSC1, C20orf117 |
|
Degradation |
RNF180, USP34‡, MAGEA3, COMMD1* |
|||
Unknown function |
NPIP, ANO8 |
JRKL, DNAJC9, GCOM1/GRINL1A, NOL10 |
CT45A5‡, MAGEA9‡, BTNL9, SYT17, KIAA1841, DNAJC5B, FAM9C‡, CTAG1A/B‡, ZCCHC7, ZC3HAV1L*, LOC339803*, ACOXL*, C22orf37*, PRUNE2*, DUSP5P*, CENPBD1*, MAGEA5*, MEGF8* |
MPEG1 |
*Genes identified in the comparison of patients with and without REL amplification within GCB-DLBCL cohort only;
‡Genes identified in both comparisons (comparisons in the overall cohort and in the GCB-DLBCL cohort).
Functional dependence on other NF-κB subunits and distinctive function of c-Rel in overall-, GCB- and ABC-DLBCL
In order to identify the dependency and distinctive functions of c-Rel versus other NF-κB subunits, we compared the GEP of c-Rel+ and c-Rel− within p50−, p65−, p52−, RelB−, p50+, p65+ p52+ and RelB+ DLBCL subsets individually. c-Rel showed GEP signatures in p50+, p65+, p52− and RelB− DLBCL subsets (Supplementary Fig. S2M-2N; Supplementary Table S2), but not in p50−, p65−, p52+ or RelB+ DLBCL. These results may suggest that c-Rel functions mainly through the canonical pathway in the forms of c-Rel/p50 and c-Rel/p65 dimers. The results also imply that c-Rel/p65 and c-Rel/p50 dimers have significantly distinctive activities compared to other p65 or p50 dimers (mainly p50/p65 and p50/p50 dimers [22, 47], potentially also p65/p65 [48], p50/p52 [49], p50/RelB dimers [22]).
c-Rel function in GCB-DLBCL did not appear to depend on other single NF-κB members significantly, because no c-Rel signatures were identified within p50+, p65+ p52+ or RelB+ GCB-DLBCL, whereas 16 differentially expressed genes (DEGs) were identified within the RelB− GCB-DLBCL subset by a high false discovery rate (FDR < 0.30) threshold.
Although c-Rel nuclear expression did not show distinctive GEP signature in the overall ABC-DLBCL, within the p65+ ABC-DLBCL subset there were 64 DEGs between c-Rel+ and c-Rel− (FDR < 0.25), and within the p50+ ABC-DLBCL subset 28 DEGs (FDR < 0.30) (Supplementary Fig. S2O-2P; Supplementary Table S3), supporting the idea that c-Rel function depended on p65 and p50 activation as suggested by the survival analysis (Fig. 2E-2F). On the other hand, the differential expression of these DEGs between c-Rel+ and c-Rel− within the p65+ or p50+ ABC-DLBCL groups also suggested that c-Rel/NF-κB dimers compared with other p65 or p50 dimers have significantly distinct roles in regulation of proliferation, apoptosis, metabolism, trafficking, cell adhesion, migration, and angiogenesis. In c-Rel+/p65+ (versus c-Rel−/p65+) ABC-DLBCL, SIGIRR which attenuates the TLR4 signaling, AEBP1, TFE3 (which activates CD40L expression), and HSPB1 (encoding Hsp27 which can either decrease IKK2 activity [50], or enhance proteasomal degradation of IκBα [51]), were upregulated; SETD6, encoding a methyltransferase which impedes p65 function, was downregulated. In both c-Rel+/p65+ (versus c-Rel−/p65+) and c-Rel+/p50+ (versus c-Rel−/p50+) ABC-DLBCL, PSMG1 which promotes assembly of the 20S proteasome was downregulated.
c-Rel signatures in Bcl-2− and p63− DLBCL
To understand the significant prognostic impact of c-Rel expression in Bcl-2− and p63− DLBCL (Fig. 2D, 2L), GEP analysis was also performed in Bcl-2− and p63− DLBCL subsets. In Bcl-2− DLBCL, c-Rel expression was associated with upregulation of BCL6 (required for GC formation), JUN, MYCBP2 (MYC binding protein 2, involved in Myc transcriptional activities and degradation of target proteins), cyclin genes CCNK and CCNI, LPIN1 involved in metabolism, DDR2 encoding a tyrosine kinase, and PSMF1, which inhibits the hydrolysis of protein and peptide substrates by the 20S proteasome (Fig. 3K). In p63− DLBCL, c-Rel expression was associated with upregulation of BCL6, EGR1, AEBP1, C7orf68, CCNG2, CCNI, ILKAP, and PSMG4 (encoding a chaperone protein which promotes assembly of the 20S proteasome) and downregulation of FBXO22 (involved in degradation of specific proteins in response to p53 induction) (Fig. 3L). In contrast, no genes were significantly differentially expressed between c-Rel+ and c-Rel− patients in the Bcl-2+ or p63+ DLBCL subset. To understand the tumor suppressor function of p63 towards c-Rel signaling, we further compared GEP between p63+ and p63− patients within the c-Rel+ DLBCL subset, and found that LYN was significantly downregulated in p63+ DLBCL, suggesting that p63 may inhibit BCR signaling thus attenuate c-Rel activation.
c-Rel signatures in the WT-p53 and MUT-p53 subsets and crosstalk between c-Rel and the p53 Pathway
c-Rel nuclear expression showed distinctive GEP signature only in the WT-p53 subcohort, (Supplementary Fig. S2L), but not in the MUT-p53 subcohort probably due to the heterogeneous and dominant MUT-p53 function [36]. The c-Rel GEP signature in the WT-p53 subcohort included oncogene JUN, CTTN which contributes to tumor cell invasion and metastasis, ENG involved in the regulation of angiogenesis, SH3GL1 with a role in cell cycle whose overexpression may play a role in leukemogenesis, LPIN1 and CKMT1A/B involved in metabolism regulation, and many genes involved in Golgi function. On the other hand, RASEF with a potential role as tumor suppressor, and CREBZF (a positive regulator of p53 [52]) were also upregulated, whereas YME1L1 which plays a role in mitochondrial protein metabolism and promotes antiapoptotic activities was downregulated. DEGs involved in epigenetic regulation include upregulatd NSD1 and downregulated KDM5A and MYSM1 (Supplementary Table S4).
Moreover, nuclear c-Rel positivity coincided with significantly upregulated TP53 transcription in ABC-DLBCL with MUT-p53 (Fig. 4A), whereas significantly upregulated TP63 and p63 protein levels in ABC-DLBCL with WT-p53 (Fig. 4B, Supplementary Fig. S5A). Conversely, in ABC-DLBCL, TP53 mutations were associated with significantly upregulated REL mRNA (Supplementary Fig. S5B) and higher nuclear c-Rel protein levels (Fig. 4C), and p63+ ABC-DLBCL had trend for elevated nuclear c-Rel protein levels (P = 0.06, Fig. 4D). In GCB-DLBCL, expression of MUT-p53 and p63 was associated with higher REL mRNA (P = 0.082 and P = 0.0016 respectively, Supplementary Fig. S5C-S5D). To exclude REL amplification as a potential compounding factor, we performed the same analyses in patients without REL amplification or polysomies, and found that only the correlation between TP53 mutations (but not p63+) and upregulated REL mRNA (but not the c-Rel protein) in ABC-DLBCL was affected.
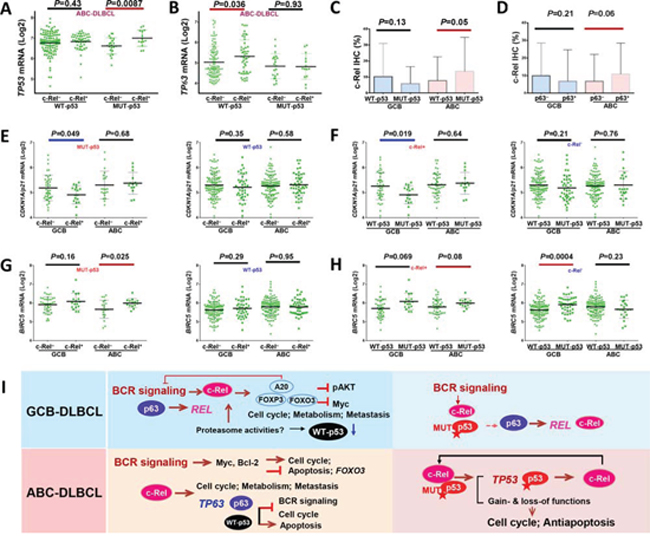
Figure 4: Crosstalk between c-Rel and the p53 pathway. A. In ABC-DLBCL with MUT-p53, c-Rel nuclear expression was associated with significantly higher TP53 mRNA. B. In ABC-DLBCL with WT-p53, c-Rel nuclear expression was associated with significantly higher TP63 mRNA. C. In ABC-DLBCL, TP53 mutations were associated with significantly higher c-Rel nuclear expression levels. D. In ABC-DLBCL, p63 expression coincided with higher c-Rel nuclear expression levels. E. c-Rel nuclear expression significantly correlated with CDKN1A/p21 downregulation in GCB-DLBCL with MUT-p53, but not in GCB-DLBCL with WT-p53. F. TP53 mutations significantly correlated with CDKN1A/p21 downregulation in GCB-DLBCL with c-Rel nuclear expression, but not in GCB-DLBCL without c-Rel nuclear expression. G. c-Rel nuclear expression significantly correlated with BIRC5 upregulation in ABC-DLBCL with MUT-p53, but not in ABC-DLBCL with WT-p53. H. In ABC-DLBCL with c-Rel nuclear expression, TP53 mutations appeared to be associated with higher BIRC5 transcription (marginal P value); in contrast without c-Rel nuclear expression, p53 mutant group correlated with significantly higher BIRC5 transcription in GCB-DLBCL, whereas appeared to have slightly lower BIRC5 transcription in ABC-DLBCL. Note: red lines indicate upregulation with significant or border-line P values whereas blue lines indicated downregulation. I. Hypothetical models of crosstalk between c-Rel, p53, and p63 in GCB- and ABC-DLBCL with WT- or MUT-p53 suggested by our data.
c-Rel+ DLBCL with MUT-p53 which was associated with significantly worse survival (Fig. 2H-2I), also correlated with decreased pAKT and Myc expression (Supplementary Fig. S2I-2J), as seen in c-Rel+ DLBCL with WT-p53 which did not show worse survival by univariate survival analysis (Fig. 2G). Therefore to confer worse prognostic impact, c-Rel must have used other oncogenic pathways. We analyzed expression of c-Rel and p53 target genes, which appeared to suggest that MUT-p53 and c-Rel gained functions in downregulating p21 in GCB-DLBCL (Fig. 4E-4F), and upregulating BIRC5 (encoding antiapoptotic survivin) in ABC-DLBCL (Fig. 4G-4H). Our data also suggested possible lost-of-function of c-Rel in the presence of MUT-p53 in upregulating TP63 in ABC-DLBCL, and gain-of-function in inducing NFKB1, TANK, and BCL2L11 in GCB-DLBCL, AURKB, RELA, and BAD in ABC-DLBCL, as well as downregulating TRAF2 in GCB-DLBCL and BCL2L11 in ABC-DLBCL (Supplementary Fig. S5–S6).
A hypothetical model for the reciprocal induction of REL, TP53 and TP63 and other biology suggested by GEP analysis in GCB- and ABC-DLBCL with WT- or MUT-p53 is depicted in Fig. 4I.
Clinical relevance and gene expression signature of REL amplification in DLBCL
REL amplification detected by FISH (Fig. 5A-5B) was found predominantly in GCB-DLBCL (only two cases of ABC-DLBCL), with a frequency of 4.2% of overall DLBCL, or 7.1% of GCB-DLBCL. REL amplification correlated with significantly higher REL mRNA levels (Fig. 5C-5D), but not with c-Rel nuclear expression (Fig. 5E), clinical parameters (Table 5) or patient survival either in overall- or GCB-DLBCL (Fig. 5F-5G), suggesting the importance of posttranslational regulations for c-Rel activation and function.
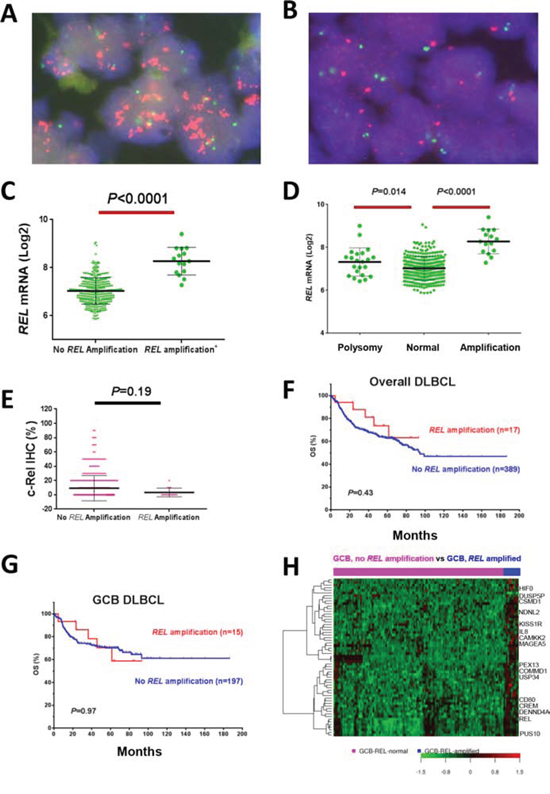
Figure 5: REL amplification analysis in DBLCL. A–B. Representative DLBCL cases positive or negative for REL amplification by fluorescence in situ hybridization analysis. C–D. REL amplification correlated with significantly higher REL mRNA levels. E. REL amplification did not correlate with c-Rel nuclear expression levels. F–G. REL amplification did not correlate with patient survival in overall- or GCB-DLBCL. H. Heatmap of gene expression profiling analysis for REL amplification in GCB-DLBCL.
Table 5: Clinicopathologic characteristics of 407 de novo DLBCL patients tested for REL amplification status
Variables |
DLBCL |
P |
GCB-DLBCL |
P |
||
REL amp+ |
REL amp− |
REL amp+ |
REL amp− |
|||
N (%) |
N (%) |
N (%) |
N (%) |
|||
Patients |
17(100) |
390(100) |
15(100) |
198(100) |
||
Gender |
||||||
Male |
7 (41) |
239 (61) |
.097 |
6 (40) |
120 (61) |
.17 |
Female |
10 (59) |
151 (39) |
9 (60) |
78 (39) |
||
Age (yr) |
||||||
<60 |
8 (47) |
170 (44) |
.77 |
8 (53) |
103 (52) |
1.0 |
≥60 |
9 (53) |
220 (56) |
7 (47) |
95 (48) |
||
Stage |
||||||
I-II |
10 (59) |
180 (48) |
.37 |
9 (60) |
107 (56) |
.75 |
III-IV |
7 (41) |
198 (52) |
6 (40) |
85 (44) |
||
B-symptoms |
||||||
No |
13 (77) |
242 (65) |
.35 |
12 (80) |
130 (70) |
.42 |
Yes |
4 (23) |
128 (35) |
3 (20) |
55 (30) |
||
Serum LDH |
||||||
Normal |
8 (47) |
144 (41) |
.60 |
7 (47) |
77 (43) |
.81 |
Elevated |
9 (53) |
210 (59) |
8 (53) |
100 (57) |
||
# of extranodal sites |
||||||
0–1 |
16 (94) |
287 (76) |
.085 |
14 (93) |
148 (78) |
.17 |
≥2 |
1 (6) |
90 (24) |
1 (6) |
41 (22) |
||
Performance score |
||||||
0–1 |
17 (100) |
289 (84) |
.068 |
15 (100) |
145 (85) |
.11 |
≥2 |
0 (0) |
59 (16) |
0 (0) |
25 (15) |
||
Size of largest tumor |
||||||
<5cm |
8 (57) |
176 (59) |
.91 |
7 (54) |
90 (61) |
.62 |
≥5cm |
6 (43) |
124 (41) |
6 (46) |
58 (39) |
||
IPI risk group |
||||||
0–2 |
14 (82) |
239 (89) |
.11 |
13 (87) |
130 (68) |
.14 |
3–5 |
3 (18) |
139 (11) |
2 (13) |
62 (32) |
||
Therapy response |
||||||
CR |
14 (82) |
295 (76) |
.77 |
12 (80) |
146 (74) |
1.0 |
PR |
0 |
51 |
0 |
24 |
||
SD |
0 |
16 |
0 |
10 |
||
PD |
3 |
28 |
3 |
18 |
||
Cell-of-origin |
||||||
ABC |
2 (12) |
190 (49) |
.0024 |
0 (0) |
0 (0) |
- |
GCB |
15 (88) |
198 (51) |
15 (100) |
198 (100) |
||
Primary origin |
||||||
Nodal |
9 (53) |
253 (66) |
.30 |
7 (53) |
131 (68) |
.10 |
Extranodal |
8 (47) |
130 (34) |
8 (47) |
63 (32) |
||
Ki-67 |
||||||
<70% |
5 (29) |
147 (38) |
.61 |
5 (33) |
82 (42) |
.59 |
≥70% |
12 (71) |
238 (62) |
10 (68) |
112 (58) |
||
TP53 mutation |
||||||
MUT TP53 |
6 (35) |
79 (22) |
.20 |
5 (33) |
46 (25) |
.49 |
WT TP53 |
11 (65) |
280 (78) |
10 (67) |
136 (25) |
||
p53 expression |
||||||
+ |
8 (47) |
126 (36) |
.44 |
7 (47) |
66 (37) |
.58 |
− |
9 (53) |
227 (64) |
8 (53) |
113 (63) |
||
MYC translocation |
||||||
+ |
1 (8) |
31 (12) |
1.0 |
1 (10) |
21 (17) |
1.0 |
− |
11 (92) |
228 (88) |
9 (90) |
102 (83) |
||
BCL2 translocation |
||||||
+ |
5 (29) |
54 (16) |
.18 |
5 (33) |
45 (29) |
.77 |
− |
12 (71) |
273 (84) |
10 (67) |
112 (71) |
||
BCL6 translocation |
||||||
+ |
5 (33) |
88 (32) |
.91 |
5 (38) |
33 (24) |
.24 |
− |
10 (67) |
187 (68) |
8 (62) |
106 (76) |
||
Bcl-2 expression |
||||||
+ |
5 (29) |
191 (50) |
.13 |
4 (27) |
80 (41) |
.41 |
− |
12 (71) |
194 (50) |
11 (73) |
115 (59) |
||
Myc expression |
||||||
+ |
5 (29) |
117 (30.5) |
1.0 |
4 (27) |
55 (29) |
1.0 |
− |
12 (71) |
266 (69.5) |
11 (73) |
137 (71) |
||
pAKT |
||||||
+ |
1 (6) |
75 (20) |
.21 |
1 (6) |
37 (19) |
.31 |
− |
16 (94) |
307 (80) |
14 (94) |
156 (81) |
||
p16 |
||||||
+ |
10 (67) |
95 (29) |
.0038 |
9 (69) |
58 (35) |
.017 |
− |
5 (87) |
230 (71) |
4 (31) |
110 (65) |
||
Nuclear p50 |
||||||
+ |
6 (40) |
188 (52.7) |
.43 |
6 (46) |
78 (42) |
.78 |
− |
9 (60) |
169 (47.3) |
7 (54) |
106 (58) |
||
Nuclear p52 |
||||||
+ |
5 (33.3) |
99 (27) |
.56 |
4 (31) |
56 (30) |
1.0 |
− |
10 (66.7) |
268 (73) |
9 (69) |
129 (70) |
||
Nuclear p65 |
||||||
+ |
8 (50) |
223 (60.6) |
.44 |
7 (50) |
113 (61) |
.41 |
− |
8 (50) |
145 (39.4) |
7 (50) |
72 (39) |
||
Nuclear RelB |
||||||
+ |
0 (0) |
58 (15.9) |
.14 |
0 (0) |
27 (15) |
.22 |
− |
15 (100) |
306 (84.1) |
13 (100) |
159 (85) |
||
Abbreviations: DLBCL, diffuse large B-cell lymphoma; GCB, germinal center B-cell like; ABC, activated B-cell like; LDH, lactate dehydrogenase; IPI, international prognostic index; CR, complete remission; PR, partial response; SD, stable disease; PD, progressive disease.
Note: Immunohistochemistry cutoff for biomarkers: c-Rel, p50, p65, RelB, 5%; p53, ≥ 20%; Myc, 70%; Bcl-2, ≥ 70%; PAKT, ≥ 70%; p16, >10%.
REL amplification showed distinct GEP signatures in either overall or GCB-DLBCL (Table 4; Fig. 5H). Except CCT4 gene which was also mapped to 2p as REL, these DEGs were not overlapping with those associated with 2p gain in chronic lymphocytic leukemia [53]. USP34 (mapped to 2p; encoding a deubiquitinase which negatively regulates NF-κB activation), COMMD1 (mapped to 2p; COMMD1 can enhance p65 nuclear degradation), RNF180 (E3 ubiquitin-protein ligase), and XPO1 (mapped to 2p; encoding CRM1 which enhances p65 nuclear export) were upregulated. Upregulated MAGEA3, which stimulates p53 ubiquitination by enhancing TRIM28 ubiquitin ligase activity, could negatively regulate p53 levels. However, proapoptotic PUS10 (mapped to 2p) and the tumor suppressor genes CSMD1, KISS1R, NDNL2, TUSC1 and DENND4A (repressing MYC transcription) were upregulated, which may also explain the lack of prognostic significance of REL amplification.
DISCUSSION
c-Rel is a unique NF-κB member important for lymphocyte development, proliferation and survival [4, 17], however, the clinical relevance of c-Rel activities in DLBCL has not been well studied with inconsistent results. In a cohort of 460 DLBCL patients, we found c-Rel nuclear expression positive in 26% of DLBCL patients at lower levels than p65 and p50, and associated with extranodal DLBCL. c-Rel nuclear expression conferred adverse impact in ABC-DLBCL with context-dependent prognostic significance. Remarkably, c-Rel nuclear expression had significantly synergistic effects with TP53 mutations. Although c-Rel positivity did not show prognostic significance in DLBCL with WT-p53, multivariate analysis indicated that c-Rel was an independent adverse prognostic factor after adjusting clinical parameters. Compared with studies in the literature, the positivity frequency in our study is lower than the 65% and 64% by two previous reports (0% and 30% cutoff respectively) [34, 35], and higher than the 18% by another study using a >50% cutoff [54]; the prognostic significance of c-Rel nuclear expression in MUT-p53 and various ABC-DLBCL subsets demonstrated in our cohort have not been reported previously. Moreover, we also found that REL amplifications in 4.2% of DLBCL had no correlation with nuclear accumulation of c-Rel (consistent with a previous study [33]) or prognosis (no earlier studies have been reported). In fact, if polysomy cases (46% are of ABC subtype) are also included into REL amplified cases which resulted in a frequency of 12% for REL amplification in DLBCL, REL amplification correlated with better patient survival in ABC- but not in GCB-DLBCL. We further found that several genes, which are also mapped to 2p, and involved in deubiquitination of IκB, degradation, nuclear export of NF-κB, or proapoptosis, were highly expressed in REL amplified cases likely due to co-amplification.
The lack of prognostic impact of c-Rel nuclear expression in GCB-DLBCL probably results from the decrease in Myc, AKT and p53 expression, and the complicated interaction and relationships with other NF-κB subunits. Upregulation of FOXP3 [42], FOXO3 [46], A20 [39, 40], IKK2 and IκBs [41, 49] in c-Rel+ GCB-DLBCL may be relevant for the reductions as well as the phosphorylation-dependent ubiquitin-proteasome system which mediates c-Rel activation and degradation of Myc and p53 [43, 55]. Decreased p53 and Myc levels in c-Rel+ GCB-DLBCL may be necessary for GC reaction [56] due to the proapoptotic function of p53 and Myc [22]. In addition, that c-Rel target FOXP3 in turn represses c-Rel activation and inhibits c-Rel function shown by an earlier study [57] may also explain the lack of prognostic effect of c-Rel expression in GCB-DLBCL. In contrast, in ABC-DLBCL, elevated IKKs and other activated signaling (such as BCR) may have increased Myc protein stability [40]; and overexpressed Myc in turn inhibits FOXO3 function [58].
In agreement with a recent study that demonstrated c-Rel is required for the GC maintenance [17], our data showed distinctive c-Rel signatures in GCB-DLBCL but not in the overall ABC-DLBCL cohort (Fig. 3J); BCL6, essential for GC maintenance, was upregulated in both c-Rel+/Bcl-2− and c-Rel+/p63− DLBCL (Fig. 3K-3L). c-Rel may have different functions by forming different NF-κB dimers. In ABC-DLBCL, c-Rel function depends on p50 and p65 suggested by GEP (Supplementary Fig. S2O-2P) and survival analysis (Fig. 2E-2F). Moreover, in Bcl-2− DLBCL especially Bcl-2− ABC-DLBCL, c-Rel+ correlated with significantly poorer survival (Fig. 2D), supporting the idea that c-Rel exerted its oncogenic function via Bcl-2-independent pathways [17].
We attempted to understand the dependence and differences between c-Rel and other NF-κB members. Coexpression in patients and coimmunoprecipitation analysis in primary DLBCL cells suggest c-Rel can form complexes with all NF-κB subunits. However, by GEP and survival analyses dissecting c-Rel function and prognostic impact with and without concurrent activation of other NF-κB subunits, our results suggested that the oncogenic c-Rel dimers with clinical significance are likely predominated of c-Rel/p65 and c-Rel/p50 in ABC-DLBCL, and potentially c-Rel/c-Rel dimers in GCB-DLBCL, which are all activated via the canonical pathway [4, 17, 68, 69].
Our data suggested crosstalk exist between c-Rel and the p53 pathway, including MUT-TP53 induction at the transcriptional level in c-Rel+ ABC-DLBCL, the gain or loss of correlation with expression levels of genes involved in cell cycle (p21, AURKB), apoptosis (BIRC5, BCL2L11), TNF pathways (TRAF2, TANK), and tumor suppressor TP63. Concurrent c-Rel positivity and TP53 mutation correlated with significantly worse patient survival. This may excel result from formation of different c-Rel/NF-κB dimers, functional alterations, posttranslational modification [59], or increased REL mutations in patients with MUT-p53 [60]. In contrast, WT-p53 and p63 may excel tumor suppressor function towards c-Rel signaling by cell cycle arrest, proapoptosis and BCR signaling inhibition therefore abolished the prognostic effect of c-Rel activation.
In summary, c-Rel nuclear expression but not REL amplification has an adverse prognostic effect in DLBCL which synergized with TP53 mutations. c-Rel has distinctive and overlapping functions compared with other NF-κB subunits, and c-Rel/p65 and c-Rel/p50 dimers may be relevant for the oncogenic role of c-Rel in DLBCL. The biology revealed by c-Rel GEP signatures from this study has gained insight into the NF-κB pathways providing important information for further functional study, and suggest that therapeutic approaches targeting BCR, cell cycle, cytokine, and the p53 pathway, as well as BET inhibitors, but not proteasome inhibitors, may have clinical benefits in c-Rel+ DLBCL patients.
PATIENTS AND METHODS
Patients
This study included 460 patients with de novo DLBCL treated with standard R-CHOP immunochemotherapy consisting of rituximab plus cyclophosphamide, hydroxydaunomycin (doxorubicin), oncovin (vincristine), and prednisone. The diagnosis, review process, and cell-of-origin classification according to GEP or the immunohistochemical algorithms of Visco-Young and/or Choi have been described previously [36, 61]. Patients were excluded if they had HIV infection, primary cutaneous or nervous system DLBCL, primary mediastinal large B-cell lymphoma, or a history of low-grade B-cell lymphoma with transformation to DLBCL. This study was conducted in accordance with the Declaration of Helsinki, and informed consent was obtained from all patients whose tumor samples were used. The study protocol and material transfer agreement were approved by the institutional review boards of all participating centers. The overall study was approved by the Institutional Review Board of The University of Texas MD Anderson Cancer Center.
Tissue microarray (TMA) and immunohistochemical assay
Immunohistochemical analysis for c-Rel, p50, p52, p65, RelB, p53, p63, Myc, Bcl-2, pSTAT3, pAKT, MDM2, and Ki-67 was performed on the TMA prepared with formalin-fixed, paraffin-embedded (FFPE) tissue blocks from all of the 460 DLBCL patients using methods previously described [36, 61, 67]. The results were analyzed independently by a group of hematopathologists (LL, CYO, AT, KHY), and disagreements were resolved by joint review with use of a multi-head microscope [70, 71].
TP53 mutation and fluorescence in situ hybridization (FISH) analysis
Genomic DNAs extracted from FFPE tissues were used for TP53 exon sequencing analysis with use of the AmpliChip (Roche Molecular Systems) [36]. FISH analysis for REL amplification used a customer developed dual-color mix (Agilent Technologies, G100258R-8) consisting of a 2p16.1 (REL-locus) probe labeled with Spectrum Orange and a reference probe (chromosome 2 centromere) labeled with Spectrum Green. Dual-color FISH was performed on 4 micron sections of the TMAs. Fluorescence signals were scored by counting the number of single-copy genes and reference probe signals in 200 well-defined nuclei. High-level amplification was defined as the presence of either 6 gene signals or tight clusters of at least five gene signals per cell. Low level gains were considered when the ratio between REL and CEP2 signals exceeded 2. Cases were considered polysomic for chromosome 2e if the number of tumor cell nuclei with three or more signals exceeded the mean +3 s.d. of polysomic nuclei in the reference cases (i.e. 15%). Five tonsils were used as references.
Probes and methods of FISH analysis for MYC, BCL2, and BCL6 translocation have been described previously [62].
Gene expression profiling
Total RNAs were extracted from FFPE tissues and used for GEP by Affymetrix GeneChips array as described previously [36, 61]. GEP was achieved in 453 DLBCL patients. The CEL files are deposited in the National Center for Biotechnology Information Gene Expression Omnibus repository (GSE#31312).61 The microarray data were quantified and normalized by the frozen robust multiarray analysis (RMA) algorithm. The DEGs were identified by using multiple t-tests. Pathway analysis for the DEGs was performed with use of the Ingenuity Pathway Analysis software program (http://www.qiagen.com/ingenuity).
Cell culture and coimmunoprecipitation
Human-derived DLBCL cell lines (MS, DB, LR, LP) were established from tissue biopsy or effusion specimens from patients as described previously [63, 64]. The cells were cultured in RPMI medium (Gibco, Rockville, MD) containing 15% fetal calf serum (FCS; Hyclone, Logan, UT). Coimmunoprecipitation was carried out as described previously [65, 66].
Statistical analysis
The clinical and pathologic features at the time of presentation were compared between various DLBCL subgroups by using the Chi-square test. Correlation between expression of different genes or proteins was evaluated by the Spearman rank correlation method and unpaired t tests. Overall survival was calculated from the date of diagnosis to the date of last follow-up or death. Progression-free survival was defined as the time period from the date of diagnosis to the date of progression or death. OS and PFS curves of the various groups were analyzed by GraphPad Prism 6 (GraphPad Software, San Diego, CA) using the Kaplan-Meier method, and differences were compared with use of the log-rank (Mantel-Cox) test. Multivariate analysis was conducted by using the Cox proportional hazards regression model with the SPSS software (version 19.0; IBM Corporation, Armonk, NY). Any difference with a P value of < 0.05 was considered statistically significant.
ACKNOWLEDGMENTS AND FUNDING
This study was supported by the National Cancer Institute/National Institutes of Health (R01CA138688 and 1RC1CA146299 to K.H.Y). KHY is supported by The University of Texas MD Anderson Cancer Center Institutional Research and Development Fund, an Institutional Research Grant Award, an MD Anderson Cancer Center Lymphoma Specialized Programs on Research Excellence (SPORE) Research Development Program Award, an MD Anderson Cancer Center Myeloma SPORE Research Development Program Award, a Gundersen Lutheran Medical Foundation Award, and MD Anderson Cancer Center Collaborative Funds with Roche Molecular System, Dai Sanyo Pharmaceutical, Adaptive Biotechnology, and HTG Molecular Diagnostics, and partially supported by the National Cancer Institute/National Institutes of Health (P50CA136411 and P50CA142509). Dr. Ling Li is the recipient of Medical Oncology Scholarship Award. GM is supported by a grant from the Michael and Susan Dell Foundation. Dr. Xu-Monette is the recipient of the Shannon Timmins Leukemia Fellowship Award at The University of Texas MD Anderson Cancer Center.
Author Contribution
Contribution: L.L, Z.Y.X-M, and K.H.Y designed and conducted the research and performed the statistical analysis; L.L, Z.Y.X.-M., C.Y.O., A.T., G.C.M., Z.L., C.V., M.Z., S.M.M., K.D., A.C., A.O., Y.Z., G.B., K.L.R., E.D.H., W.W.L.C., J.H.K., J.H., M.P., A.J.M.F., M.B.M., F.B., J.P.F., M.A.P., J.N.W., L.J.M., and K.H.Y. contributed vital new reagents, resources, technology, and analytical tools; Z.Y.X.-M., C.Y.O., A.T., C.V., S.M.M., K.D., A.C., A.O., Y.Z., G.B., K.L.R., E.D.H., W.W.L.C., J.H.K., J.H., M.P., A.J.M.F., M.B.M., J.P.F., M.A.P., J.N.W., and K.H.Y. collected clinical and follow-up data under approval by the Institutional Review Boards and the material transfer agreement; L.L, Z.Y.X-M, L.J.M., and K.H.Y. edited the manuscript; and all authors contributed vital strategies, participated in discussions, and provided scientific input.
CONFLICTS OF INTEREST
The authors declare no conflicts of interest.
Editorial note
This paper has been accepted based in part on peer-review conducted by another journal and the authors’ response and revisions as well as expedited peer-review in Oncotarget.
REFERENCES
1. Shaffer AL 3rd, Young RM, Staudt LM. Pathogenesis of human B cell lymphomas. Annu Rev Immunol. 2012; 30:565–610.
2. Staudt LM. Oncogenic activation of NF-kappaB. Cold Spring Harb Perspect Biol. 2010; 2:a000109.
3. Jin J, Hu H, Li HS, Yu J, Xiao Y, Brittain GC, Zou Q, Cheng X, Mallette FA, Watowich SS, Sun SC. Noncanonical NF-kappaB pathway controls the production of type I interferons in antiviral innate immunity. Immunity. 2014; 40:342–54.
4. Gilmore TD, Gerondakis S. The c-Rel Transcription Factor in Development and Disease. Genes Cancer. 2011; 2:695–711.
5. Clark JM, Aleksiyadis K, Martin A, McNamee K, Tharmalingam T, Williams RO, Memet S, Cope AP. Inhibitor of kappa B epsilon (IkappaBepsilon) is a non-redundant regulator of c-Rel-dependent gene expression in murine T and B cells. PLoS One. 2011; 6:e24504.
6. Alves BN, Tsui R, Almaden J, Shokhirev MN, Davis-Turak J, Fujimoto J, Birnbaum H, Ponomarenko J, Hoffmann A. IkappaBepsilon is a key regulator of B cell expansion by providing negative feedback on cRel and RelA in a stimulus-specific manner. J Immunol. 2014; 192:3121–32.
7. Refaat A, Zhou Y, Suzuki S, Takasaki I, Koizumi K, Yamaoka S, Tabuchi Y, Saiki I, Sakurai H. Distinct roles of transforming growth factor-beta-activated kinase 1 -c-Rel and interferon regulatory factor 4 (IRF4) pathways in human T cell lymphotropic virus 1-transformed T helper 17 cells producing interleukin-9. J Biol Chem. 2011; 286:21092–9.
8. Thome M, Charton JE, Pelzer C, Hailfinger S. Antigen receptor signaling to NF-kappaB via CARMA1, BCL10, and MALT1. Cold Spring Harb Perspect Biol. 2010; 2:a003004.
9. Fontan L, Yang C, Kabaleeswaran V, Volpon L, Osborne MJ, Beltran E, Garcia M, Cerchietti L, Shaknovich R, Yang SN, Fang F, Gascoyne RD, Martinez-Climent JA, et al. MALT1 small molecule inhibitors specifically suppress ABC-DLBCL in vitro and in vivo. Cancer Cell. 2012; 22:812–24.
10. O’Connor S, Shumway SD, Amanna IJ, Hayes CE, Miyamoto S. Regulation of constitutive p50/c-Rel activity via proteasome inhibitor-resistant IkappaBalpha degradation in B cells. Mol Cell Biol. 2004; 24:4895–908.
11. Li Q, Verma IM. NF-kappaB regulation in the immune system. Nat Rev Immunol. 2002; 2:725–34.
12. Isomura I, Palmer S, Grumont RJ, Bunting K, Hoyne G, Wilkinson N, Banerjee A, Proietto A, Gugasyan R, Wu L, McNally A, Steptoe RJ, Thomas R, et al. c-Rel is required for the development of thymic Foxp3+ CD4 regulatory T cells. J Exp Med. 2009; 206:3001–14.
13. Yu Y, Wang D, Kaosaard K, Liu C, Fu J, Haarberg K, Anasetti C, Beg AA, Yu XZ. c-Rel is an essential transcription factor for the development of acute graft-versus-host disease in mice. Eur J Immunol. 2013; 43:2327–37.
14. Lu YC, Kim I, Lye E, Shen F, Suzuki N, Suzuki S, Gerondakis S, Akira S, Gaffen SL, Yeh WC, Ohashi PS. Differential role for c-Rel and C/EBPbeta/delta in TLR-mediated induction of proinflammatory cytokines. J Immunol. 2009; 182:7212–21.
15. Banerjee A, Grumont R, Gugasyan R, White C, Strasser A, Gerondakis S. NF-kappaB1 and c-Rel cooperate to promote the survival of TLR4-activated B cells by neutralizing Bim via distinct mechanisms. Blood. 2008; 112:5063–73.
16. Kaileh M, Sen R. NF-kappaB function in B lymphocytes. Immunol Rev. 2012; 246:254–71.
17. Heise N, De Silva NS, Silva K, Carette A, Simonetti G, Pasparakis M, Klein U. Germinal center B cell maintenance and differentiation are controlled by distinct NF-kappaB transcription factor subunits. J Exp Med. 2014; 211:2103–18.
18. Chen G, Hardy K, Bunting K, Daley S, Ma L, Shannon MF. Regulation of the IL-21 gene by the NF-kappaB transcription factor c-Rel. J Immunol. 2010; 185:2350–9.
19. Tian W, Liou HC. RNAi-mediated c-Rel silencing leads to apoptosis of B cell tumor cells and suppresses antigenic immune response in vivo. PLoS One. 2009; 4:e5028.
20. Burkitt MD, Williams JM, Duckworth CA, O’Hara A, Hanedi A, Varro A, Caamano JH, Pritchard DM. Signaling mediated by the NF-kappaB sub-units NF-kappaB1, NF-kappaB2 and c-Rel differentially regulate Helicobacter felis-induced gastric carcinogenesis in C57BL/6 mice. Oncogene. 2013; 32:5563–73.
21. Meylan E, Dooley AL, Feldser DM, Shen L, Turk E, Ouyang C, Jacks T. Requirement for NF-kappaB signalling in a mouse model of lung adenocarcinoma. Nature. 2009; 462:104–7.
22. Gasparini C, Celeghini C, Monasta L, Zauli G. NF-kappaB pathways in hematological malignancies. Cell Mol Life Sci. 2014; 71:2083–102.
23. Cooks T, Pateras IS, Tarcic O, Solomon H, Schetter AJ, Wilder S, Lozano G, Pikarsky E, Forshew T, Rosenfeld N, Harpaz N, Itzkowitz S, Harris CC, et al. Mutant p53 prolongs NF-kappaB activation and promotes chronic inflammation and inflammation-associated colorectal cancer. Cancer Cell. 2013; 23:634–46.
24. Schwitalla S, Ziegler PK, Horst D, Becker V, Kerle I, Begus-Nahrmann Y, Lechel A, Rudolph KL, Langer R, Slotta-Huspenina J, Bader FG, Prazeres da Costa O, Neurath MF, et al. Loss of p53 in enterocytes generates an inflammatory microenvironment enabling invasion and lymph node metastasis of carcinogen-induced colorectal tumors. Cancer Cell. 2013; 23:93–106.
25. Gu L, Zhu N, Findley HW, Woods WG, Zhou M. Identification and characterization of the IKKalpha promoter: positive and negative regulation by ETS-1 and p53, respectively. J Biol Chem. 2004; 279:52141–9.
26. Rocha S, Martin AM, Meek DW, Perkins ND. p53 represses cyclin D1 transcription through down regulation of Bcl-3 and inducing increased association of the p52 NF-kappaB subunit with histone deacetylase 1. Mol Cell Biol. 2003; 23:4713–27.
27. Scian MJ, Stagliano KE, Anderson MA, Hassan S, Bowman M, Miles MF, Deb SP, Deb S. Tumor-derived p53 mutants induce NF-kappaB2 gene expression. Mol Cell Biol. 2005; 25:10097–110.
28. Yang X, Lu H, Yan B, Romano RA, Bian Y, Friedman J, Duggal P, Allen C, Chuang R, Ehsanian R, Si H, Sinha S, Van Waes C, et al. DeltaNp63 versatilely regulates a Broad NF-kappaB gene program and promotes squamous epithelial proliferation, migration, and inflammation. Cancer Res. 2011; 71:3688–700.
29. King KE, Ponnamperuma RM, Allen C, Lu H, Duggal P, Chen Z, Van Waes C, Weinberg WC. The p53 homologue DeltaNp63alpha interacts with the nuclear factor-kappaB pathway to modulate epithelial cell growth. Cancer Res. 2008; 68:5122–31.
30. Lu H, Yang X, Duggal P, Allen CT, Yan B, Cohen J, Nottingham L, Romano RA, Sinha S, King KE, Weinberg WC, Chen Z, Van Waes C. TNF-alpha promotes c-REL/DeltaNp63alpha interaction and TAp73 dissociation from key genes that mediate growth arrest and apoptosis in head and neck cancer. Cancer Res. 2011; 71:6867–77.
31. Shono Y, Tuckett AZ, Ouk S, Liou HC, Altan-Bonnet G, Tsai JJ, Oyler JE, Smith OM, West ML, Singer NV, Doubrovina E, Pankov D, Undhad CV, et al. A small-molecule c-Rel inhibitor reduces alloactivation of T cells without compromising antitumor activity. Cancer Discov. 2014; 4:578–91.
32. Shono Y, Tuckett AZ, Ouk S, Liou HC, Altan-Bonnet G, Tsai JJ, Oyler JE, Smith OM, West ML, Singer NV, Doubrovina E, Pankov D, et al. A small-molecule c-Rel inhibitor reduces alloactivation of T cells without compromising antitumor activity. Cancer Discov. 2014; 4:578–91.
33. Houldsworth J, Olshen AB, Cattoretti G, Donnelly GB, Teruya-Feldstein J, Qin J, Palanisamy N, Shen Y, Dyomina K, Petlakh M, Pan Q, Zelenetz AD, Dalla-Favera R, et al. Relationship between REL amplification, REL function, and clinical and biologic features in diffuse large B-cell lymphomas. Blood. 2004; 103:1862–8.
34. Curry CV, Ewton AA, Olsen RJ, Logan BR, Preti HA, Liu YC, Perkins SL, Chang CC. Prognostic impact of C-REL expression in diffuse large B-cell lymphoma. J Hematop. 2009; 2:20–6.
35. Odqvist L, Montes-Moreno S, Sanchez-Pacheco RE, Young KH, Martin-Sanchez E, Cereceda L, Sanchez-Verde L, Pajares R, Mollejo M, Fresno MF, Mazorra F, Ruiz-Marcellan C, Sanchez-Beato M, et al. NFkappaB expression is a feature of both activated B-cell-like and germinal center B-cell-like subtypes of diffuse large B-cell lymphoma. Mod Pathol. 2014; 27:1331–7.
36. Xu-Monette ZY, Wu L, Visco C, Tai YC, Tzankov A, Liu WM, Montes-Moreno S, Dybkaer K, Chiu A, Orazi A, Zu Y, Bhagat G, Richards KL, et al. Mutational profile and prognostic significance of TP53 in diffuse large B-cell lymphoma patients treated with R-CHOP: report from an International DLBCL Rituximab-CHOP Consortium Program Study. Blood. 2012; 120:3986–96.
37. Boone DL, Turer EE, Lee EG, Ahmad RC, Wheeler MT, Tsui C, Hurley P, Chien M, Chai S, Hitotsumatsu O, McNally E, Pickart C, Ma A. The ubiquitin-modifying enzyme A20 is required for termination of Toll-like receptor responses. Nat Immunol. 2004; 5:1052–60.
38. Scott ML, Fujita T, Liou HC, Nolan GP, Baltimore D. The p65 subunit of NF-kappa B regulates I kappa B by two distinct mechanisms. Genes Dev. 1993; 7:1266–76.
39. Yang WL, Wang J, Chan CH, Lee SW, Campos AD, Lamothe B, Hur L, Grabiner BC, Lin X, Darnay BG, Lin HK. The E3 ligase TRAF6 regulates Akt ubiquitination and activation. Science. 2009; 325:1134–8.
40. Yeh PY, Lu YS, Ou DL, Cheng AL. IkappaB kinases increase Myc protein stability and enhance progression of breast cancer cells. Mol Cancer. 2011; 10:53.
41. Tergaonkar V, Pando M, Vafa O, Wahl G, Verma I. p53 stabilization is decreased upon NFkappaB activation: a role for NFkappaB in acquisition of resistance to chemotherapy. Cancer Cell. 2002; 1:493–503.
42. Katoh H, Zheng P, Liu Y. Signalling through FOXP3 as an X-linked tumor suppressor. Int J Biochem Cell Biol. 2010; 42:1784–7.
43. Yang Y, Staudt LM. Protein ubiquitination in lymphoid malignancies. Immunol Rev. 2015; 263:240–56.
44. Bunting K, Rao S, Hardy K, Woltring D, Denyer GS, Wang J, Gerondakis S, Shannon MF. Genome-wide analysis of gene expression in T cells to identify targets of the NF-kappa B transcription factor c-Rel. J Immunol. 2007; 178:7097–109.
45. Ceribelli M, Kelly PN, Shaffer AL, Wright GW, Xiao W, Yang Y, Mathews Griner LA, Guha R, Shinn P, Keller JM, Liu D, Patel PR, Ferrer M, et al. Blockade of oncogenic IkappaB kinase activity in diffuse large B-cell lymphoma by bromodomain and extraterminal domain protein inhibitors. Proc Natl Acad Sci U S A. 2014; 111:11365–70.
46. Peck B, Ferber EC, Schulze A. Antagonism between FOXO and MYC Regulates Cellular Powerhouse. Front Oncol. 2013; 3:96.
47. Franzoso G, Bours V, Park S, Tomita-Yamaguchi M, Kelly K, Siebenlist U. The candidate oncoprotein Bcl-3 is an antagonist of p50/NF-kappa B-mediated inhibition. Nature. 1992; 359:339–42.
48. Ganchi PA, Sun SC, Greene WC, Ballard DW. A novel NF-kappa B complex containing p65 homodimers: implications for transcriptional control at the level of subunit dimerization. Mol Cell Biol. 1993; 13:7826–35.
49. Kashatus D, Cogswell P, Baldwin AS. Expression of the Bcl-3 proto-oncogene suppresses p53 activation. Genes Dev. 2006; 20:225–35.
50. Park KJ, Gaynor RB, Kwak YT. Heat shock protein 27 association with the I kappa B kinase complex regulates tumor necrosis factor alpha-induced NF-kappa B activation. J Biol Chem. 2003; 278:35272–8.
51. Parcellier A, Schmitt E, Gurbuxani S, Seigneurin-Berny D, Pance A, Chantome A, Plenchette S, Khochbin S, Solary E, Garrido C. HSP27 is a ubiquitin-binding protein involved in I-kappaBalpha proteasomal degradation. Mol Cell Biol. 2003; 23:5790–802.
52. Lopez-Mateo I, Villaronga MA, Llanos S, Belandia B. The transcription factor CREBZF is a novel positive regulator of p53. Cell Cycle. 2012; 11:3887–95.
53. Fabris S, Mosca L, Cutrona G, Lionetti M, Agnelli L, Ciceri G, Barbieri M, Maura F, Matis S, Colombo M, Gentile M, Recchia AG, Anna Pesce E, et al. Chromosome 2p gain in monoclonal B-cell lymphocytosis and in early stage chronic lymphocytic leukemia. Am J Hematol. 2013; 88:24–31.
54. Rodig SJ, Savage KJ, LaCasce AS, Weng AP, Harris NL, Shipp MA, Hsi ED, Gascoyne RD, Kutok JL. Expression of TRAF1 and nuclear c-Rel distinguishes primary mediastinal large cell lymphoma from other types of diffuse large B-cell lymphoma. Am J Surg Pathol. 2007; 31:106–12.
55. Adams J. The proteasome: a suitable antineoplastic target. Nat Rev Cancer. 2004; 4:349–60.
56. Phan RT, Dalla-Favera R. The BCL6 proto-oncogene suppresses p53 expression in germinal-centre B cells. Nature. 2004; 432:635–639.
57. Loizou L, Andersen KG, Betz AG. Foxp3 interacts with c-Rel to mediate NF-kappaB repression. PLoS One. 2011; 6:e18670.
58. Amente S, Zhang J, Lavadera ML, Lania L, Avvedimento EV, Majello B. Myc and PI3K/AKT signaling cooperatively repress FOXO3a-dependent PUMA, and GADD45a gene expression. Nucleic Acids Res. 2011; 39:9498–507.
59. Garbati MR, Alco G, Gilmore TD. Histone acetyltransferase p300 is a coactivator for transcription factor REL and is C-terminally truncated in the human diffuse large B-cell lymphoma cell line RC-K8. Cancer Lett. 2010; 291:237–45.
60. Chin M, Herscovitch M, Zhang N, Waxman DJ, Gilmore TD. Overexpression of an activated REL mutant enhances the transformed state of the human B-lymphoma BJAB cell line and alters its gene expression profile. Oncogene. 2009; 28:2100–11.
61. Visco C, Li Y, Xu-Monette ZY, Miranda RN, Green TM, Li Y, Tzankov A, Wen W, Liu WM, Kahl BS, d’Amore ES, Montes-Moreno S, Dybkaer K, et al. Comprehensive gene expression profiling and immunohistochemical studies support application of immunophenotypic algorithm for molecular subtype classification in diffuse large B-cell lymphoma: a report from the International DLBCL Rituximab-CHOP Consortium Program Study. Leukemia. 2012; 26:2103–13.
62. Tzankov A, Xu-Monette ZY, Gerhard M, Visco C, Dirnhofer S, Gisin N, Dybkaer K, Orazi A, Bhagat G, Richards KL, Hsi ED, Choi WW, van Krieken JH, et al. Rearrangements of MYC gene facilitate risk stratification in diffuse large B-cell lymphoma patients treated with rituximab-CHOP. Mod Pathol. 2014; 27:958–71.
63. Ford RJ, Goodacre A, Ramirez I, Mehta SR, Cabanillas F. Establishment and characterization of human B-cell lymphoma cell lines using B-cell growth factor. Blood. 1990; 75:1311–8.
64. Pham LV, Fu L, Tamayo AT, Bueso-Ramos C, Drakos E, Vega F, Medeiros LJ, Ford RJ. Constitutive BR3 receptor signaling in diffuse, large B-cell lymphomas stabilizes nuclear factor-kappaB-inducing kinase while activating both canonical and alternative nuclear factor-kappaB pathways. Blood. 2011; 117:200–10.
65. Zhou HJ, Pham LV, Tamayo AT, Lin-Lee YC, Fu L, Yoshimura LC, Ford RJ. Nuclear CD40 interacts with c-Rel and enhances proliferation in aggressive B-cell lymphoma. Blood. 2007; 110:2121–7.
66. Pham LV, Tamayo AT, Yoshimura LC, Lin-Lee YC, Ford RJ. Constitutive NF-kappaB and NFAT activation in aggressive B-cell lymphomas synergistically activates the CD154 gene and maintains lymphoma cell survival. Blood. 2005; 106:3940–7.
67. Ok CY, Xu-Monette ZY, Li L, Manyam GC, Montes-Moreno S, Tzankov A, Visco C, Dybkær K, Routbort MJ, Zhang L, Chiu A, Orazi A, et al. Evaluation of NF-κB subunit expression and signaling pathway activation demonstrates that p52 expression confers better outcome in germinal center B-cell-like diffuse large B-cell lymphoma in association with CD30 and BCL2 functions. Mod Pathol. 2015 Jun 26 PMID:26111978.
68. Testoni M, Zucca E, Young KH, Bertoni F. Genetic lesions in diffuse large B-cell lymphomas. Ann Oncol 2015; 26:1069–80
69. Young KH, Medeiros LJ, Chan WC. Diffuse large B-cell lymphoma. In: Orazi A, Weiss LM, Foucar K, Knowles DM (eds). Neoplastic Hematopathology, Lippincott Willaims & Wilkins: Philadelphia, PA, USA, 2014, pp 502–565.
70. Chen J, Xu-Monette ZY, Deng L, Shen Q, Manyam GC, Martinez-Lopez A, Zhang L, Montes-Moreno S, Visco C, Tzankov A, Yin L, Dybkaer K,et al. Dysregulated CXCR4 expression promotes lymphoma cell survival and independently predicts disease progression in germinal center B-cell-like diffuse large B-cell lymphoma. Oncotarget. 2015; 6:5597–614.
71. Xu-Monette ZY, Tu M, Jabbar KJ, Cao X, Tzankov A, Visco C, Cai Q, Montes-Moreno S, An Y, Dybkaer K, Chiu A, Orazi A, et al. Clinical and biological significance of de novo CD5+ diffuse large B-cell lymphoma in Western countries. Oncotarget. 2015; 6:5615–33.