
INTRODUCTION
Multiple myeloma is the second most common hematological malignancy and accounts for about 2% of cancer-related deaths. The cancer cells arise from post-germinal center plasma cells and usually reside in the bone marrow. Myeloma is preceded by a benign condition termed monoclonal gammopathy of undetermined significance (MGUS), [1] and the annual risk of progression to myeloma is about 1%. [2] Treatment of multiple myeloma has improved during the last decades by the introduction of proteasome inhibitors such as bortezomib and carfilzomib as well as immunomodulatory drugs (IMIDs) such as thalidomide and lenalidomide. However; the median overall survival time from diagnosis is still no more than 5–7 years. [3, 4]
The transcription factor c-MYC (hereafter termed MYC) and the related N-MYC and L-MYC oncogenes are involved in the development of up to 70% of all cancers. [5] Under normal conditions MYC increases cell proliferation and halts differentiation. [6] Abnormal MYC activity has been shown to be associated with many features of cancer cells including cell metabolism and proliferation. [7] In multiple myeloma it was commonly thought that activation of MYC was a late-stage event. [8] The importance of MYC in myeloma disease progression has lately become clearer, and increased MYC activity has been implicated in progression from MGUS to full-blown myeloma. [9–12] Recently, two papers showed that complex rearrangements positioning MYC in the proximity of super-enhancers caused elevated MYC expression in primary myeloma cells. [13, 14] Moreover, MYC was shown to be the most frequent translocation partner in aberrations involving the immunoglobulin light chains. [15] Altogether, MYC rearrangements were found in nearly half of the myeloma patients leaving MYC the most commonly mutated gene in multiple myeloma. [13]
We have earlier shown that MYC expression was important for in vitro survival of myeloma cells using different approaches for targeting MYC. [16–18] The question we wanted to address in this study was whether the vulnerability of multiple myeloma cells for MYC inhibition correlated to cellular levels of MYC. Pharmacological targeting of MYC activity has been challenging. One option is to use small molecule inhibitors that target MYC-MAX heterodimerization thereby preventing transactivation of MYC target genes. [19, 20] We found that the small molecule inhibitor of MYC, 10058-F4, suppressed proliferation and survival of myeloma cells, arguing for a distinct role of MYC in multiple myeloma. The importance of MYC was further supported by an inverse correlation between IC50 of the inhibitor and the level of MYC in myeloma cell lines.
RESULTS
We have earlier shown that the small molecule MYC inhibitor 10058-F4 induces apoptosis in myeloma cell lines and primary cells. [17, 20] The inhibitor downregulated MYC protein and mRNA in a dose-dependent manner in myeloma cells (Supplemenatry Figure 1A–1C). We wanted to find out if the baseline MYC expression could determine myeloma cell sensitivity to 10058-F4. A panel (n = 11) of myeloma cell lines were treated with increasing amounts of inhibitor for three days. The combined effects on cell proliferation and viability were determined using CellTiter Glo which measures the ATP content in cells (Supplementary Figure 2). IC50 values were determined from dose-response curves and related to MYC transcript numbers measured by the nCounter Nanostring technology (Figure 1A, Supplementary Figure 3A) and protein levels using immunoblotting (Figure 1B, Supplementary Figure 3B, 3C). There was a negative correlation between IC50 values and mRNA (R2 = 0, 548) or protein (R2 = 0, 585) levels. Taken together, the correlation between MYC expression and sensitivity to the 10058-F4 compound, supports that 10058-F4 is a relatively specific inhibitor of MYC activity. Secondly, the finding that the cell lines with the highest MYC concentration were the most sensitive suggests that cell lines expressing high levels of MYC are more dependent on the MYC expression for proliferation or survival than cell lines expressing lower amounts of MYC.
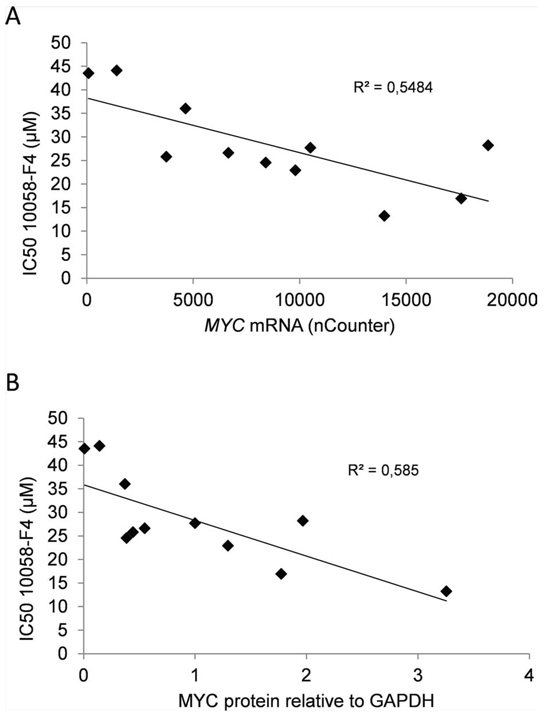
Figure 1: MYC gene copy numbers determine expression of MYC mRNA and protein in myeloma cell lines. In a panel of myeloma cell lines the levels of MYC gene copy numbers as measured by PCR was related to A. MYC mRNA measured using nCounter, and B. MYC protein levels measured using immunoblotting and normalized to GAPDH. The slope and R2-values are shown in the plots.
Next, we measured MYC gene copy numbers in all 11 myeloma cell lines using PCR with primers for exon 3 (Supplementary Figure 3D) and correlated the copy numbers with MYC mRNA, as well as with protein levels (Supplementary Figure 3A, 3B and 3C). In cell lines, the MYC gene copy numbers varied from two to nine. The measured copy numbers were almost identical using primers that were specific for exon 1 and exon 2 (Supplementary Figure 3D), indicating the presence of the whole gene rather than fragments of the gene. Interestingly, the MYC gene copy numbers correlated well with both mRNA (R2 = 0.847) and protein (R2 = 0.607) levels (Figure 2A and 2B). The results thus indicate that the main determinant of elevated MYC expression in myeloma cell lines is amplification of the MYC gene.
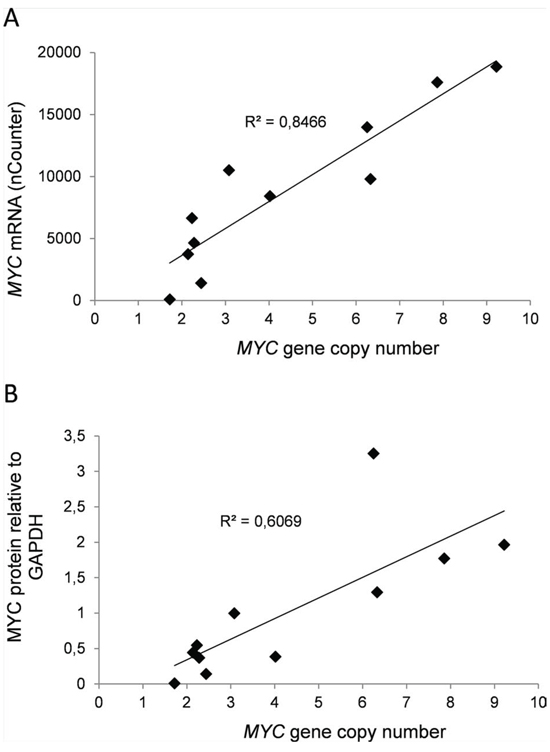
Figure 2: Expression of MYC in myeloma cell lines correlated positively with sensitivity to MYC inhibition. The IC50-values of the MYC inhibitor 10058-F4 calculated from the results shown in Supplementary Figure 2 was compared with A. MYC mRNA values or B. MYC/GAPDH relative protein levels. The slope and R2-values are shown in the plots.
We went on to investigate the variation in MYC gene copy numbers in myeloma patient samples by the same method as applied for cell lines. Interestingly, most of the primary samples (n = 21) had two copies of the MYC gene and the samples deviating from this (n = 7) had MYC gene copies varying from 1 to 4 (data not shown). The levels of MYC mRNA, on the other hand, showed remarkable variation (Figure 3A). Thus, in contrast to myeloma cell lines, MYC levels in primary cells apparently are not determined by the number of gene copies as measured here, but by other mechanisms.
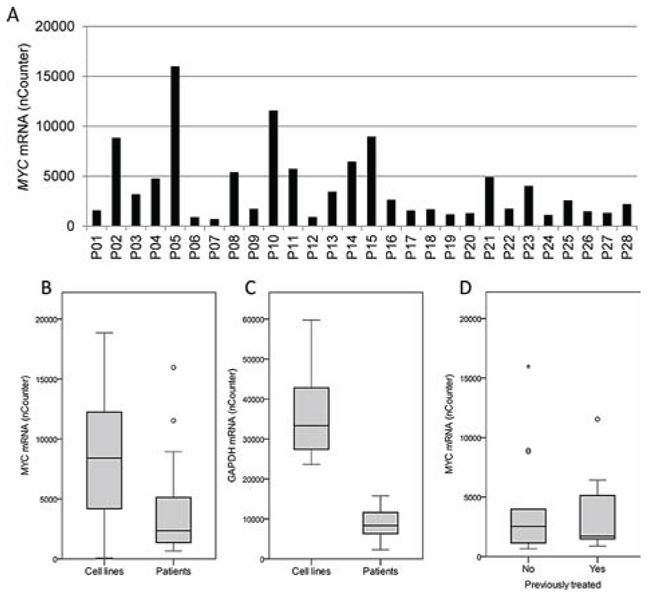
Figure 3: MYC and GAPDH mRNA levels in primary myeloma cells. A. The levels of MYC mRNA in myeloma patient samples (n = 28), P01-P28, were measured using nCounter and the calculated mRNA copy numbers were plotted. Box plots comparing the levels of MYC B. and GAPDH C. mRNA in 28 isolated plasma cells from myeloma patients with 11 myeloma cell lines. D. The levels of MYC mRNA measured as in A were plotted for treated (n = 15) versus untreated (n = 13) patients in a box plot. The upper and lower borders of the box indicate upper and lower quartile, whereas the line inside the box indicates the median value. Whiskers indicate upper and lower adjacent values, whereas outside values are indicated by (o) and far out values are indicated by asterisks (*).
Interestingly, we originally compared MYC mRNA levels in cell lines and primary cells applying GAPDH mRNA as the only reference, getting higher MYC levels in primary cells than in myeloma cell lines. However, when comparing GAPDH mRNA levels in cell lines with primary cells using the Nanostring nCounter technology and using several genes as reference; it turned out that the difference in GAPDH mRNA was even greater than the difference in MYC mRNA. Thus, when comparing MYC mRNA levels in primary cells and cell lines, the patient cells as a group had lower MYC expression levels than cell lines (Figure 3B). Patients (n = 28) had a median MYC level of 2345, range 660–15969, whereas the cell lines (N = 11) had a median level of 8411, range 85–18859. Furthermore, the cell lines had a median GAPDH level of 33347, range 23653–59757, whereas the primary cells had a median GAPDH level of 8345, range 2297–15769 (Figure 3C). We also treated the primary myeloma samples with the MYC inhibitor to obtain IC50 values. However, the cell viability varied and only 18 out of 28 samples had a viability > 50% without treatment. Those samples were included in analysis (data not shown). When comparing IC50 values for 10058-F4 in the samples with baseline viability > 50% with MYC mRNA expression, we were not able to see the same correlation as in cell lines. However, analysis of only 18 samples may not be sufficient to see such correlations. There was no correlation between cell viability in the patient samples and 10058-F4 IC50 values (n = 28, data not shown).
The primary cells studied were both from newly diagnosed, untreated patients (n = 13), as well as from treated patients (n = 15), i.e. patients at a later stage of disease. Clinical characteristics of the patient samples are found in Supplementary Table I. Interestingly, the MYC mRNA levels were not different between previously treated and untreated patients (Figure 3D), indicating that untreated patients had myeloma cells with as high MYC expression as patients in later stages of disease. These observations suggest that both untreated and treated patients may have plasma cells with high MYC expression that possibly could be targeted by MYC inhibition.
DISCUSSION
The most important data presented here is that there was a positive correlation between MYC expression and sensitivity to the MYC activity inhibitor, 10058-F4, in myeloma cell lines. That finding supports that MYC is important for myeloma cell survival and that the inhibitor specifically targets MYC. Secondly, although both myeloma cell lines and primary cells expressed high amounts of MYC, there are differences in the underlying mechanisms behind the expression. And thirdly, MYC expression was in the same range in plasma cells from untreated compared to treated patients indicating that MYC activation is an early oncogenic event in multiple myeloma.
Cell lines expressing the highest levels of MYC were the most sensitive to MYC-inhibition, indicating that these cells were more dependent on MYC for survival and proliferation than low-expressors. Thus, we hypothesize that patients with myeloma cells expressing high levels of MYC could benefit from MYC inhibition. MYC protein and mRNA are very unstable and may be rapidly degraded. When isolating primary myeloma cells from bone marrow samples the procedure usually takes a few hours and there is a risk that MYC protein and mRNA levels are not maintained at the same levels as when the cells are situated in the bone marrow. Thus, the most reliable way to measure MYC levels in patients could be by quantitative in situ immunohistochemistry using bone marrow biopsies. Unfortunately, it was not possible for us to perform such experiments in this study.
A major concern when applying small molecule inhibitors is the specificity of the inhibitor. The 10058-F4 drug has been proposed to be a specific inhibitor of MYC-MAX heterodimerization at concentrations < 100 μM. [20, 21] However, even if 10058-F4 clearly inhibits the MYC-MAX interaction, the compound may also affect other molecules within a cell. The correlation between MYC expression and sensitivity for the 10058-F4 drug found in cell lines indicated that the activity of the drug was specifically directed towards MYC activity. As MYC is a factor that is functionally non-redundant it may be particularly attractive as a therapeutic target. [22] MYC could already indirectly be targeted in the clinic since many drugs, such as dexamethasone and lenalidomide, have been shown to kill myeloma cells concomitantly with partial suppression of MYC, [23, 24] albeit, these drugs clearly also have other effects.
We found higher MYC mRNA levels in myeloma cell lines than in primary cells; although the range was approximately the same in these two groups. Nevertheless, gene copy number variations in MYC were only common in cell lines, indicating that primary cells had other ways of increasing MYC levels than cell lines. Indeed, recent publications indicate that different rearrangements involving MYC cause elevated MYC expression in nearly half of newly diagnosed patients. [13–15] MYC expression has been reported to affect cell proliferation and energy metabolism in rapidly proliferating cancer cells. [7] Amplification of the MYC gene seen in myeloma cell lines may be a consequence of the selection pressure for proliferation and survival in tissue culture flasks. Cell lines are highly proliferating, whereas primary myeloma cells in the bone marrow in general proliferate very slowly, with a Ki-67 labelling index less than 5% for most patients. [25] Amplification of the MYC gene may be a simple way of achieving high MYC levels in cell lines that over years have been selected for cell proliferation in vitro. Another difference is that, unlike myeloma cell lines, primary cells depend on the bone marrow microenvironment and are unable to survive in tissue culture. There was also a difference in GAPDH expression levels between cell lines and primary cells that could reflect differences in utilization of glycolysis for ATP production.
In patients, a negative relationship between MYC expression and progression-free and overall survival has been described, suggesting an important role for MYC in the regulation of tumor mass. [14, 26–28] We compared the MYC mRNA expression with clinical information on progression-free and overall survival in our patient samples, but could not find any relationship (data not shown). However, the number of informative patients was too low to draw any conclusions. Nevertheless, our findings that MYC mRNA is as high in untreated patients as in patients at later stages of disease suggest that MYC may be important during the whole course of disease.
To summarize, our results suggest that many myeloma patients, but first of all patients with cells expressing high MYC levels, might benefit from MYC inhibition. If a specific and clinically applicable MYC-inhibitor became available, it would be important to characterize which patients might benefit from inhibition of MYC.
MATERIALS AND METHODS
Cell lines and reagents
A panel of 11 myeloma cell lines was used. Four of the cell lines were in-house: OH-2, IH-1, URVIN and KJON, whereas 7 were from other sources: INA-6, CAG, JJN3 and ANBL-6 were kind gifts from Dr M. Gramatzki (University of Erlangen-Nurnberg, Erlangen, Germany), Dr J. Epstein (University of Arkansas for Medical Sciences, Little Rock, AR, USA), Dr J. Ball (University of Birmingham, UK), and Dr D. Jelinek (Mayo Clinic, Rochester, MN, USA), respectively, KMS-12-BM was obtained from DSMZ (Braunschweig Germany), and RPMI-8226 and U266 were from ATCC (Rockville, MD, USA). URVIN, INA-6 and ANBL-6 cells were grown in 10% heat inactivated fetal calf serum (FCS) in RPMI-1640 (RPMI) supplemented with interleukin (IL)-6 (1 ng/mL) (Biosource, Camarillo, CA, USA). CAG, JJN3, KMS-12-BM, RPMI-8226 and U266 were grown in RPMI with 10, 10, 20, 20 or 15% FCS, respectively. OH-2 and IH-1 were maintained in 10% heat-inactivated human serum (HS) (Department of Immunology and Transfusion Medicine, St. Olav’s University Hospital, Trondheim, Norway) whereas KJON was maintained in 5% HS, all in RPMI and IL-6 (2 ng/mL). Cells were cultured at 37°C in a humidified atmosphere containing 5% CO2. For experiments 2% HS in RPMI was used as medium, with IL-6 (1 ng/mL) added for all IL-6 dependent cell lines.
Primary cells
Primary CD138+ myeloma cells were isolated from bone marrow specimens included in the Norwegian Myeloma Biobank using RoboSep automated cell separator and Human CD138 Positive Selection Kit (StemCell Technologies, Grenoble, France). The study was approved by the Regional Ethics Committee (approval # 2011/2029) and all patients had given informed consent. Peripheral blood mononuclear cells (PBMC) were obtained from EDTA-blood from healthy controls by density gradient centrifugation using Lymphoprep (Axis-Shield, Oslo, Norway).
Nucleic acid extraction
Genomic DNA and total RNA were extracted from frozen cell pellets using AllPrep DNA/RNA Micro Kit and Qiacube (Qiagen, Venlo, the Netherlands) following the manufacturer’s instructions. The concentration and quality of DNA and RNA was determined using NanoDrop spectrophotometer (Thermo Fisher Scientific, Waltham, MA, USA), and samples were stored at −80°C until further use.
Real-time quantitative reverse transcription PCR (qRT-PCR)
Complementary DNA (cDNA) was synthesized from total RNA using the High Capacity RNA-to-cDNA kit (Applied Biosystems, Carlsbad, CA, USA). PCR was performed using StepOne Real-Time PCR System and Taqman Gene Expression Assays (Applied Biosystems). The comparative Ct method was used to estimate relative changes in gene expression using MYC Taqman assay (Hs00153408_m1) and GAPDH (Hs99999905_m1) as housekeeping gene.
Copy number variation (CNV)
Real-time reverse transcriptase quantitative polymerase chain reaction (real-time qPCR) was performed using the TaqMan Copy Number Assay Hs01764918_cn (MYC, exon 3), Hs00834648_cn (MYC, exon 2), Hs02758348_cn (MYC, exon 1), and TaqMan Copy Number Reference Assay (RNAse P) for internal control (Applied Biosystems). All PCR reactions were performed in triplets with genomic DNA using a StepOnePlus PCR system (Applied Biosystems). CNV was analyzed using CopyCaller Software (Applied Biosystems) and DNA isolated from PBMC was used for calibration.
Gene expression analysis
For mRNA transcript counting the nCounter Human Cancer Reference Kit (cat.no GXA-CR1–12) and nCounter Technology (Nanostring Technologies, Seattle, WA, USA) was used. The standard mRNA Gene-expression experiment protocol provided by Nanostring was used, the only exception being that kit probes were diluted 1:2. Briefly, 100 ng total RNA from myeloma cell lines or patient samples was hybridized with reporter probes overnight at 65°C. The nSolver Analysis Software (Nanostring) was used for calculations of transcript numbers. Sample data was normalized against internal kit positive controls and the following housekeeping genes: CLTC, GAPDH, GUSB, HPRT1, PGK1, and TUBB.
Immunoblotting
Cells were treated as indicated, washed with ice-cold phosphate-buffered saline (PBS) and lysed for 30′ on ice. The lysis buffer contained 1% NP40 (Sigma-Aldrich, St Louis, MO, USA), 150 mM NaCl, 50 mM Tris-HCl (pH 7.5), a protease inhibitor cocktail (Roche, Basel, Switzerland), 1 mM Na3VO4 and 50 mM NaF. Samples were electrophoresed on pre-cast agarose gels and blotted onto nitrocellulose membranes using the NuPAGE system (Life Technologies, Carlsbad, CA, USA). The membranes were blocked with 5% nonfat dry milk in Tris-buffered saline with 0.01% Tween 20 (TBS-T). The primary antibodies used were c-MYC (RRID: AB_2148606, Cat# 551102, BD Biosciences, Trondheim, Norway), and GAPDH (RRID:AB_2107448, Cat# Ab8245, Abcam, Cambridge, UK). The secondary antibody was horseradish peroxidase-conjugated goat-anti-mouse (Dako Cytomation, Glostrup, Denmark). Positive bands were detected using the luminescence substrate SuperSignal West Femto (Thermo Fisher Scientific) and Odyssey Fc imager (LI-COR Biosciences, Ltd., Cambridge, UK).
Cell proliferation assay
Cell proliferation was estimated using the CellTiter-Glo assay (Promega, Madison, WI, USA), that measures the cells’ ATP content. The cells were seeded in 100 μL per well in white opaque 96 well plates and treated with increasing doses of inhibitor for 72 hours. The cell lines have different growth rates and, thus, the cell numbers that were seeded for each cell line varied from 10000 – 50000 per well. Assay reagent was added and the plates were mixed for 2 min on a shaker. After a 10 min incubation in room temperature luminescence was detected using a Victor 1420 multilabel counter (PerkinElmer Inc., Waltham, MA, USA).
Statistical analysis
Statistical analysis and box plots were made in IBM SPSS Statistics 20 (IBM Corp., Armonk, NY, USA).
ACKNOWLEDGMENTS
The authors are grateful for technical help provided by Lill-Anny Gunnes Grøseth, Solveig Kvam, Berit Størdal and Hanne Hella.
FUNDING
This work was funded by grants from the Norwegian Cancer Society, the Liaison Committee between the Central Norway Regional Health Authority and the Norwegian University of Science and Technology, and the KG Jebsen Foundation for Medical Research. The funding sources did not participate in study design, collection, analysis or interpretation of the data, writing of the paper or deciding to submit the paper for publication.
CONFLICTS OF INTEREST
The authors state no conflicts of interest.
REFERENCES
1. Landgren O, Kyle RA, Pfeiffer RM, Katzmann JA, Caporaso NE, Hayes RB, Dispenzieri A, Kumar S, Clark RJ, Baris D, Hoover R, Rajkumar SV. Monoclonal gammopathy of undetermined significance (MGUS) consistently precedes multiple myeloma: a prospective study. Blood. 2009; 113:5412–5417.
2. Morgan GJ, Johnson DC, Weinhold N, Goldschmidt H, Landgren O, Lynch HT, Hemminki K, Houlston RS. Inherited genetic susceptibility to multiple myeloma. Leukemia: official journal of the Leukemia Society of America, Leukemia Research Fund. UK: 2014; 28:518–524.
3. Lonial S, Boise LH. The future of drug development and therapy in myeloma. Seminars in oncology. 2013; 40:652–658.
4. Raab MS, Podar K, Breitkreutz I, Richardson PG, Anderson KC. Multiple myeloma. Lancet. 2009; 374:324–339.
5. Dang CV. MYC on the path to cancer. Cell. 2012; 149:22–35.
6. Varlakhanova N, Cotterman R, Bradnam K, Korf I, Knoepfler PS. Myc and Miz-1 have coordinate genomic functions including targeting Hox genes in human embryonic stem cells. Epigenetics & chromatin. 2011; 4:20.
7. Wahlstrom T, Henriksson MA. Impact of MYC in regulation of tumor cell metabolism. Biochim Biophys Acta. 2015; 1849:563–569.
8. Avet-Loiseau H, Gerson F, Magrangeas F, Minvielle S, Harousseau JL, Bataille R. Rearrangements of the c-myc oncogene are present in 15% of primary human multiple myeloma tumors. Blood. 2001; 98:3082–3086.
9. Chesi M, Robbiani DF, Sebag M, Chng WJ, Affer M, Tiedemann R, Valdez R, Palmer SE, Haas SS, Stewart AK, Fonseca R, Kremer R, Cattoretti G, et al. AID-dependent activation of a MYC transgene induces multiple myeloma in a conditional mouse model of post-germinal center malignancies. Cancer cell. 2008; 13:167–180.
10. Anguiano A, Tuchman SA, Acharya C, Salter K, Gasparetto C, Zhan F, Dhodapkar M, Nevins J, Barlogie B, Shaughnessy JD Jr, Potti A. Gene expression profiles of tumor biology provide a novel approach to prognosis and may guide the selection of therapeutic targets in multiple myeloma. Journal of clinical oncology: official journal of the American Society of Clinical Oncology. 2009; 27:4197–4203.
11. Chng WJ, Huang GF, Chung TH, Ng SB, Gonzalez-Paz N, Troska-Price T, Mulligan G, Chesi M, Bergsagel PL, Fonseca R. Clinical and biological implications of MYC activation: a common difference between MGUS and newly diagnosed multiple myeloma. Leukemia: official journal of the Leukemia Society of America, Leukemia Research Fund. UK. 2011; 25:1026–1035.
12. Chiecchio L, Dagrada GP, Protheroe RK, Stockley DM, Smith AG, Orchard KH, Cross NC, Harrison CJ, Ross FM. Loss of 1p and rearrangement of MYC are associated with progression of smouldering myeloma to myeloma: sequential analysis of a single case. Haematologica. 2009; 94:1024–1028.
13. Affer M, Chesi M, Chen WD, Keats JJ, Demchenko YN, Tamizhmani K, Garbitt VM, Riggs DL, Brents LA, Roschke AV, Van Wier S, Fonseca R, Bergsagel PL, et al. Promiscuous MYC locus rearrangements hijack enhancers but mostly super-enhancers to dysregulate MYC expression in multiple myeloma. Leukemia: official journal of the Leukemia Society of America, Leukemia Research Fund. UK. 2014; 28:1725–1735.
14. Walker BA, Wardell CP, Brioli A, Boyle E, Kaiser MF, Begum DB, Dahir NB, Johnson DC, Ross FM, Davies FE, Morgan GJ. Translocations at 8q24 juxtapose MYC with genes that harbor superenhancers resulting in overexpression and poor prognosis in myeloma patients. Blood cancer journal. 2014; 4:e191.
15. Turkmen S, Binder A, Gerlach A, Niehage S, Theodora Melissari M, Inandiklioglu N, Dorken B, Burmeister T. High prevalence of immunoglobulin light chain gene aberrations as revealed by FISH in multiple myeloma and MGUS. Genes, chromosomes & cancer. 2014; 53:650–656.
16. Holien T, Vatsveen TK, Hella H, Rampa C, Brede G, Groseth LA, Rekvig M, Borset M, Standal T, Waage A, Sundan A. Bone morphogenetic proteins induce apoptosis in multiple myeloma cells by Smad-dependent repression of MYC. Leukemia: official journal of the Leukemia Society of America, Leukemia Research Fund. UK. 2012; 26:1073–1080.
17. Holien T, Vatsveen TK, Hella H, Waage A, Sundan A. Addiction to c-MYC in multiple myeloma. Blood. 2012; 120:2450–2453.
18. Holien T, Sundan A. Oncogene addiction to c-MYC in myeloma cells. Oncotarget. 2012; 3:739–740.
19. Berg T. Small-molecule modulators of c-Myc/Max and Max/Max interactions. Current topics in microbiology and immunology. 2011; 348:139–149.
20. Wang H, Hammoudeh DI, Follis AV, Reese BE, Lazo JS, Metallo SJ, Prochownik EV. Improved low molecular weight Myc-Max inhibitors. Molecular cancer therapeutics. 2007; 6:2399–2408.
21. Gomez-Curet I, Perkins RS, Bennett R, Feidler KL, Dunn SP, Krueger LJ. c-Myc inhibition negatively impacts lymphoma growth. Journal of pediatric surgery. 2006; 41:207–211. discussion 207-211.
22. Sodir NM, Evan GI. Finding cancer’s weakest link. Oncotarget. 2011; 2:1307–1313.
23. Chauhan D, Auclair D, Robinson EK, Hideshima T, Li G, Podar K, Gupta D, Richardson P, Schlossman RL, Krett N, Chen LB, Munshi NC, Anderson KC. Identification of genes regulated by dexamethasone in multiple myeloma cells using oligonucleotide arrays. Oncogene. 2002; 21:1346–1358.
24. Lopez-Girona A, Heintel D, Zhang LH, Mendy D, Gaidarova S, Brady H, Bartlett JB, Schafer PH, Schreder M, Bolomsky A, Hilgarth B, Zojer N, Gisslinger H, et al. Lenalidomide downregulates the cell survival factor, interferon regulatory factor-4, providing a potential mechanistic link for predicting response. Br J Haematol. 2011; 154:325–336.
25. Alexandrakis MG, Passam FH, Kyriakou DS, Dambaki K, Niniraki M, Stathopoulos E. Ki-67 proliferation index: correlation with prognostic parameters and outcome in multiple myeloma. American journal of clinical oncology. 2004; 27:8–13.
26. Sekiguchi N, Ootsubo K, Wagatsuma M, Midorikawa K, Nagata A, Noto S, Yamada K, Takezako N. The impact of C-Myc gene-related aberrations in newly diagnosed myeloma with bortezomib/dexamethasone therapy. International journal of hematology. 2014; 99:288–295.
27. Xiao R, Cerny J, Devitt K, Dresser K, Nath R, Ramanathan M, Rodig SJ, Chen BJ, Woda BA, Yu H. MYC protein expression is detected in plasma cell myeloma but not in monoclonal gammopathy of undetermined significance (MGUS). The American journal of surgical pathology. 2014; 38:776–783.
28. Glitza IC, Lu G, Shah R, Bashir Q, Shah N, Champlin RE, Shah J, Orlowski RZ, Qazilbash MH. Chromosome 8q24.1/c-MYC abnormality: a marker for high-risk myeloma. Leukemia & lymphoma. 2014;1–6.