
INTRODUCTION
In recent years, important advances have been achieved in the identification of the genetic and molecular alterations of pancreatic ductal adenocarcinoma (PDAC). Such studies have also shown that PDAC is a genetically highly-heterogeneous and complex group of tumors [1-6]. However, the knowledge about the precise mechanisms underlying the development and malignant transformation of PDAC, still remain largely unknown. In this regard, global gene expression profiling (GEP) at both the mRNA and the protein levels has proven to allow identification of distinct molecular tumor subtypes in many different human cancer types [7-9]. In recent years, many GEP studies have been also reported in PDAC [4, 10-24]; such studies, have mainly focused on the definition of molecular signatures associated with disease progression; but, to the best of our knowledge, only Collisson et al. [25] described (three) PDAC subtypes based on microarray analysis of GEP which were associated with different clinical outcomes and therapeutic responses: the classical, quasi-mesenchymal and exocrine-like subtypes of PDAC tumors. Currently, it is well-established that the cellular mechanisms involved in tumor genesis and progression depend, not only on the protein-coding GEP, but also on the expression profile of post-transcriptional regulators such as the miRNAs. Thus, simultaneous assessment of the mRNA and the non-coding RNA gene expression profiles may contribute to a better understanding of the molecular pathways of PDAC and a more accurate definition of the distinct molecular subtypes of these tumors. To date, only a few studies by Donahue et al. [26] and Frampton et al. [27] have combined global mRNA and miRNA expression analysis of PDAC tumors. In the former study, combined GEP data and DNA copy number alterations were investigated in a cohort of 25 primary PDAC tumors in an attempt to identify tumoral molecular profiles associated with a distinct patient survival. By contrast, Frampton et al. [27] analysed the impact of miRNA expression on the whole mRNA GEP in a small cohort of PDAC tumors (n = 9) and cell lines (n = 2) aiming at the identification of functional miRNA-mRNA interactions that could contribute to PDAC growth.
Here we evaluate the molecular heterogeneity of PDAC tumors based on simultaneous assessment of the overall GEP of both coding mRNA and non-coding RNA genes -including miRNA, small nucleolar and large intergenic RNAs- in primary tumor samples from 27 consecutive PDAC patients vs. non-tumoral pancreatic tissue. Overall, our results define a common GEP for all PDAC tumors, at the same time they confirm and extend on previous observations about the existence of two clearly distinct molecular subtypes of PDAC.
RESULTS
The global transcription profile of PDAC tumors
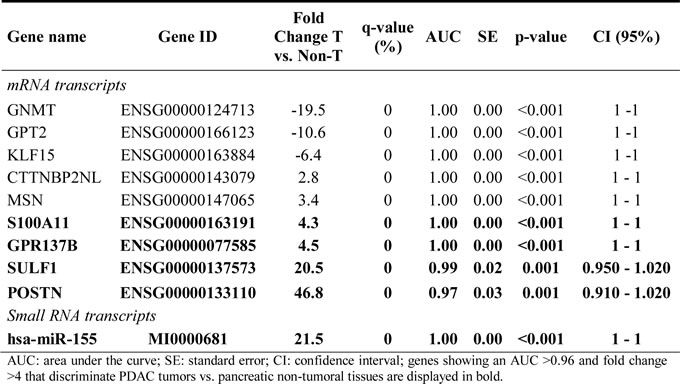
Supervised analysis of the PDAC GEP showed a total of 1,428 mRNA and 171 small RNA deregulated genes, with an average expression level ≥ 2-fold difference in PDAC tumors (n = 27) vs. non-PDAC pancreatic tissues (n = 5) (FDR < .0001; Supplementary Tables 2 and 3). More than half of these mRNA transcripts were up-regulated in PDAC samples (923/1428; 64%) while most small RNA transcripts (135/171; 78%) were down-regulated in PDAC samples. Among other genes, POSTN, SULF1, GREM1 and DKK1 mRNAs and the miR-203, miR-708, miR-31 and miR-4298 miRNA transcripts were those found to be overexpressed at the greatest levels, while the ALB, PDIA2, SYNCN, RBPJL mRNAs and the miR-216-a and miR-216-b, miR-217, miR-148a and miR-4286 miRNAs were those showing the most pronounced down-regulation across all PDAC samples analyzed (Table 1). ROC curve analysis based on those mRNA and miRNA transcripts differentially expressed in PDAC vs. non-tumoral pancreatic tissues, revealed a combination of just 5 genes (S100A11, GPR137B, SULF1, POSTN and miR-155) that allowed accurate classification (32/32 samples correctly classified) of PDAC tumor vs. non-tumoral pancreatic tissues (Table 2).
Table 1. Top 20 up- and down-regulated mRNA and miRNA and other small non-coding RNA transcripts in PDAC (n=27) vs non-tumoral pancreatic tissues (n=5).
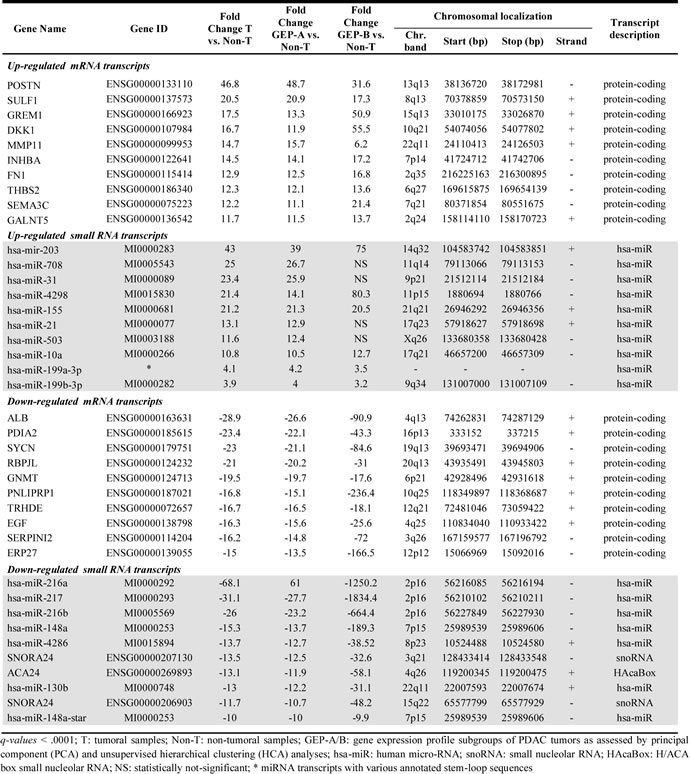
Table 2: Receiver operating characteristic (ROC) curve analysis for genes previously selected by the prediction algorithms which better contributed to the discrimination between tumoral and non-tumoral pancreatic tissues (n=27 vs. n=5, respectively).
The gene expression profiling of PDAC vs. non-tumoral pancreatic tissues defines two molecular subgroups of PDAC tumors
Despite there were global differences in the GEP of PDAC vs. non-tumoral pancreatic tissues (Table 1; Supplementary Tables 2 and 3), both unsupervised PCA (Figure 1A) and HCA (Figure 1B), showed two well-defined subgroups of PDAC tumor samples with distinct GEP: 1) a major group consisting of 24/27 PDAC samples (GEP-A subgroup of tumors) and 2) a minor subgroup of three PDAC tumors which clustered together, clearly apart from the GEP-A PDAC tumors (GEP-B subgroup of PDAC). Of note both the GEP-A and GEP-B subgroups of PDAC tumors also clustered separately from the non-tumoral pancreatic tissue samples (n = 5; Figure 1).
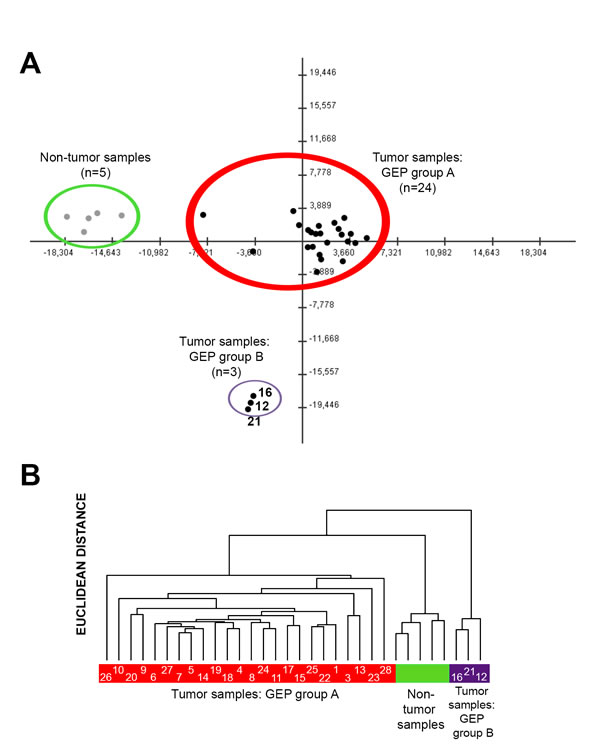
Figure 1: Classification of PDAC tumors and non-tumoral pancreatic tissues based on coding (mRNA) and non-coding (small nuclear and microRNA) gene expression profiles (GEP). Both principal component (Panel A) and unsupervised hierarchical clustering (Panel B) analyses differentiated tumoral vs. non-tumoral tissues (n = 5; color coded in green), at the same time they showed the existence of two major subgroups of PDAC tumors: GEP group A (n = 24; color coded in red) and GEP group B (n = 3; color coded in purple). Case ID of tumors are shown inside the colored bars.
Taking in account these GEP-based subgroups of PDAC tumors, supervised analysis showed a total of 2,594 mRNA and 214 small RNA altered genes among GEP-A and GEP-B tumors vs. non-tumoral pancreatic tissue samples (Table 1; Supplementary Tables 2 and 3). Upon comparing the GEP of the GEP-A and GEP-B subgroups of PDAC tumors: 1,605/2,594 (62%) and 181/214 (85%) differentially expressed mRNA and small RNA genes were associated with the GEP-A cluster, respectively, while 1,522/2,594 (59%) and 103/214 (48%) mRNA and small RNA genes were associated with the GEP-B cluster, respectively; a total of 533 (21%) mRNA and 70 (33%) small RNA transcripts were simultaneously altered in the two subgroups of PDAC tumors (Supplementary Tables 2 and 3). The altered gene profile common to the GEP-A and GEP-B tumors included increased expression of mRNA coding for the RAC1 and RHOC GTP-binding proteins, the insulin-like growth factor binding protein 3 (IGFBP3), several members of the S100A and the MMP gene families (e.g.: S100A6, 11 and 16, and MMP2, 11 and 14), as well as the PDAC-associated miRNAs miR-155 and miR-203, which are known to be typically altered in PDAC; in addition, both subgroups of PDAC tumors also showed loss of expression of normal pancreatic genes such as the CELA2A (pancreatic elastase), the CEL, PNLIP, PNLIPRP1 and PNLIPRP2 genes (pancreatic lipases and related proteins), the SERPINI2 serin peptidase inhibitor gene and the miR-216, miR-217 and miR-148 miRNAs. In turn, those genes which were found to be differentially altered in the GEP-A and GEP-B tumor subgroups, included, among other, the KRAS oncogene, the CEACAM1 and CEACAM5 epithelial marker carcinoembrionary antigens, the SERPINB5 gene, as well as the miR-21, miR-221 and miR-222 miRNAs which were all overexpressed in GEP-A vs. GEP-B tumors (Supplementary Tables 2 and 3).
Supervised analysis further showed differential expression for another 20 genes in GEP-A vs. GEP-B PDAC tumors (Supplementary Table 2). Among other altered genes, these included greater expression in GEP-A (vs. GEP-B) PDAC of the CEACAM6 gene, as well as of genes associated with the inflammatory response and chronic pancreatic diseases such as the integrin β4 and β6 genes (ITGB4 and ITGB6), the cytochrome b-245 beta polypeptide (CYBB), lysozyme (LZY), the SERPINA1 antiproteinase and the antitrypsin serpin peptidase inhibitor genes, together with genes involved in tumor metastasis and invasion –e.g. the MMP7 matrix metalloproteinase and the tetraspanin 8 (TSPAN8) genes- (Supplementary Table 2).
Functional characterization of deregulated GEP in PDAC tumors
Analysis of the biological and functional significance of the deregulated GEPs observed in our PDAC tumors, revealed > 55 significantly altered canonical pathways vs. non-tumoral pancreatic tissues. Among those pathways more commonly altered in PDAC tumors we observed increased expression of genes involved in axonal guidance, the actin cytoskeleton and/or endocytosis processes such as integrins (TGA5, ITGB1), GTP-ases (RRAS and RAC1) and actin-related proteins (ACTR3); in addition, genes that participate in the early steps of inflammatory cell responses, such as genes associated with leukocyte extravasation, cell adhesion and diapedesis, and with IL-8 signaling, together with genes involved in cell motility, were altered in tumoral tissues from both groups of PDAC, as reflected by an increased expression of the MMP2, MMP11 and MMP14 matrix metalloproteinases and the MSN (moesin), CDH11 (cadherin 11), RHOC (Ras homolog C) and CFL1 (cofilin 1) genes, in parallel to a decreased expression of the CLDN3 (claudin 3) gene (Figure 2A; Supplementary Table 4). Both subgroups of tumors also displayed increased expression of genes involved in bladder cancer signaling pathways and glioma invasiveness (Figure 2).
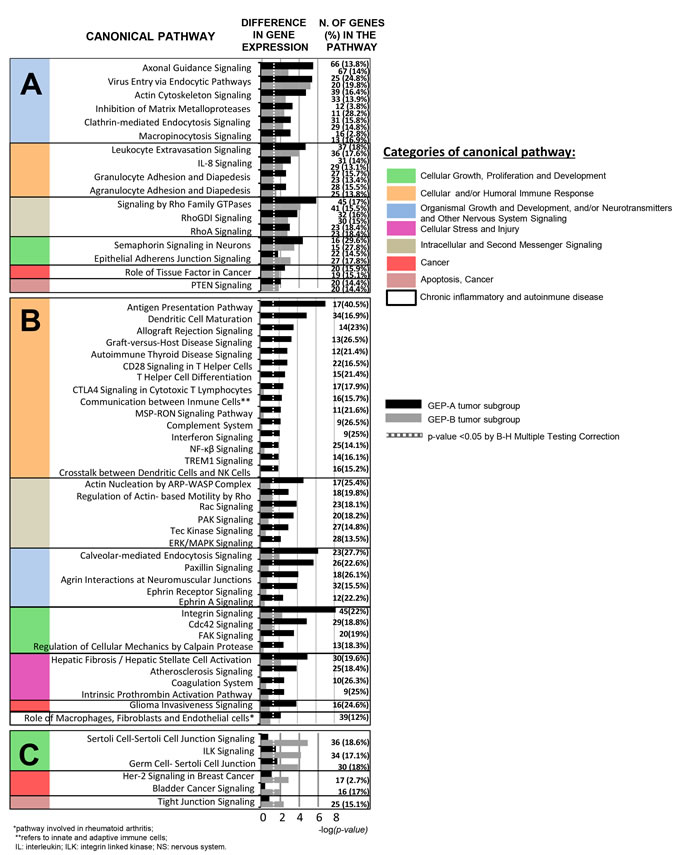
Figure 2: Most representative canonical pathways involved in PDAC tumors as defined by their GEP for both coding and non-coding RNAs (n = 27; p < .05). Shared canonical pathways by the two GEP-A and GEP-B subgroups of PDAC tumors are shown in panel A, while those pathways specific for the GEP-A and GEP-B subgroups of PDAC tumors are displayed in panels B and C, respectively.
Functional characterization of GEP differentially altered in GEP-A and GEP-B PDAC
Canonical pathways found to be deregulated in GEP-A vs. GEP-B PDAC (Figure 2B and 2C) included multiple genes involved in innate and adaptive cellular and humoral immune responses. Among others, these included interleukin 18 (IL18), several IL receptors (IL2RA, IL2RG, IL10RA) and the IL1RN IL-1 antagonist, the CD80 receptor gene, major histocompatibility complex class I (HLA-A, HLA-B, HLA-E and HLA-F) and class II (HLA-DRA, HLA-DMA, HLA-DMB, HLA-DPA1 and -DQB1) molecules, toll-like receptors 4 and 6 (TLR-4 and TLR-6) and both the janus kinase family members 1 and 2 genes (JAK1 and JAK2) and their signal transducer and activator of transcription 2 gene (STAT2). In contrast to GEP-B cases, GEP-A tumors also displayed an altered expression of genes involved in cell stress, injury responses and chronic inflammatory disease pathways; this included overexpression of the COL3A1 and COL10A1 collagen genes, the PLA2G7, 10 and 16 phospholipases, the APOL1 and APOC1 apolipoproteins and the PLAT and PLAU plasminogen activator-associated kinase genes (Figure 2B and Supplementary Table 5). Conversely, GEP-B tumors displayed a less altered GEP, which consisted of decreased expression of genes related with cell junction and intercellular adhesion -e.g. the E-cadherin (CDH1), OCLN (occludin) and CGN (cingulin) genes, and several members of the claudin gene family (CLDN1, CLDN4, CLDN7 and CLDN10)- together with increased expression of the ILK signaling pathway, due to overexpression of the ILK gene and of other genes involved in the ephitelial-to-mesenchymal transition (EMT) such as SNAI1, SNAI2 and vimentin (VIM) (Figure 2C and Supplementary Table 6). Of note, GEP-B tumors also showed a GEP which was associated with other key elements of the GEP signature of EMT; thus, they showed overexpression of the N-cadherin (CDH2), TWIST1 and S100A4 mesenchymal phenotype-associated markers, together with decreased expression of epithelial phenotype markers such as the CDH1, cytokeratins (KRT8 and KRT18), desmoplakin (DSP), the chymotrypsinogen B1 (CTRB1), insulin (INS) and GCG genes.
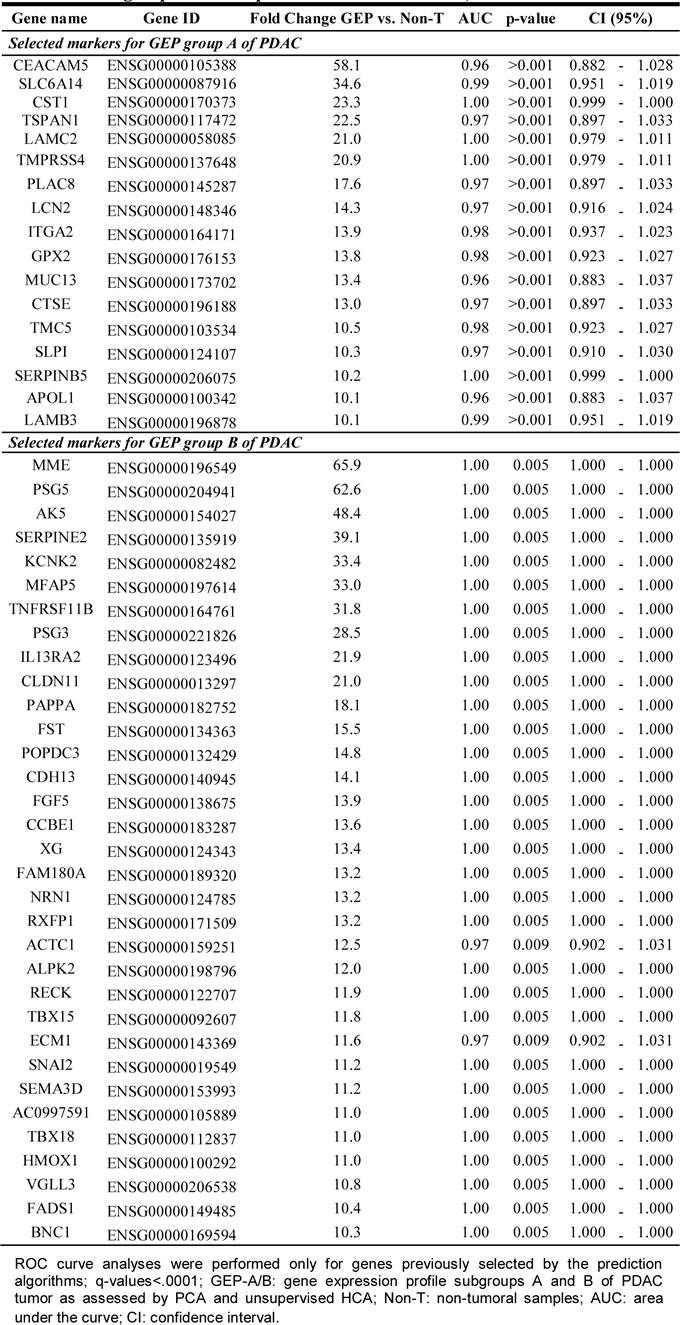
From all differentially expressed RNA transcripts, a combination of 63 mRNA genes overexpressed in GEP-A and 97 mRNA genes overexpressed in GEP-B tumors (vs. non-tumoral pancreatic tissues) allowed for a clear cut discrimination of these two subgroups of PDAC tumors (Supplementary Table 7). A list of those highly-discriminant genes which were found to be most differentially expressed (≥10 fold difference) in GEP-A and GEP-B tumors, with a power to classify them with a 100% accuracy, are shown in Table 3. These genes included PDAC epithelial markers (e.g., CEACAM5 and SERPINB5) for the definition of GEP-A tumors and the SNAI2 mesenchymal marker for GEP-B tumors.
Table 3: Receiver operating characteristic (ROC) curve analysis for the most overexpressed (≥10 fold greater expression) genes which contribute most to the discrimination between PDAC tumor GEP group A (24 group A tumors vs. 3 group B tumors plus 5 non-tumoral tissues) and group B (3 group B tumors vs. 24 group A tumors plus 5 non-tumoral tissues).
Validation of tumor-associated markers with high discriminating power between the GEP-A vs. GEP-B subgroups of PDAC
The discriminating value of those genes differentially expressed (overexpressed) in GEP-A vs. GEP-B PDAC tumors (Supplementary Table 7) was further validated using GEP data from an independent series of PDAC available at the public GEO database (n = 27; Figure 3). In line with the findings described above for our cases, 14/14 (100%) PDAC samples previously classified by Collisson et al. [25] as showing a “classical PDAC” GEP were shown to have GEP-A-associated markers; in contrast, 7/8 (89%) “quasi-mesenchymal PDAC” tumors as defined by Collisson et al. [25] had a typical GEP-B phenotype. In this series, the most discriminating GEP-A and GEP-B genes (higher variation between samples with an SD = 1) were: 1) ADAM28, CEACAM5, CTSE, CXCR4, EGLN3, LY75, PLAC8, SLC6A14, S100P, TMC5 and TMEM45B, and 2) HOXC6, PAPPA, SNAI2 and VGLL3, respectively (Figure 3).
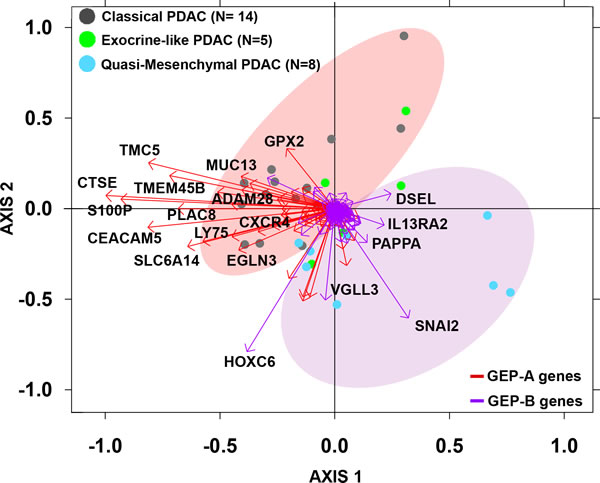
Figure 3: Biplot analysis of 27 PDAC tumors from an independent external validation dataset [25] evaluated for the expression of GEP-A and GEP-B overexpressed tumor markers identified in our series. PDAC samples previously classified by Collisson et al. as “classical PDAC” tumors (grey dots) were mostly represented by the expression of GEP-A associated genes (red vectors) while “quasi-mesenchymal PDAC” tumors (light blue dots) were grouped by the expression of GEP-B associated markers (purple vectors).
miRNAs genes which may inhibit gene expression in PDAC
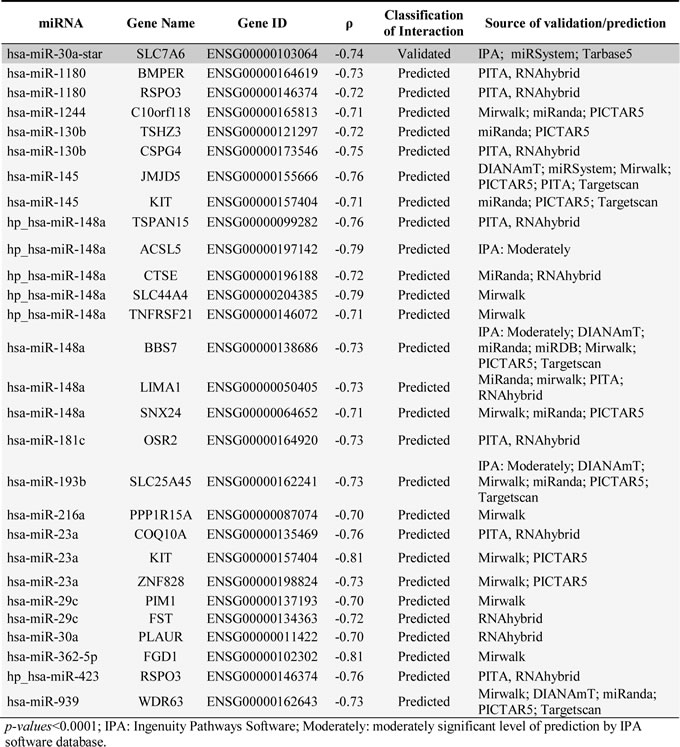
In order to determine the impact of the miRNAs signature on the GEP of PDAC tumors, both the miRNA and mRNA gene expression data sets were combined to investigate potential correlations between miRNAs and mRNA genes which are altered in PDAC. Evaluation of each pair of potential miRNA-mRNA interacting genes identified potential interactions for 51 inversely correlated and 139 positively correlated (absolute value of R ≥0.7; p < .0001) pairs of miRNA-mRNA genes. Based on currently available miRNA target prediction and database tools, such interactions corresponded to 27 predictable and 1 experimentally validated (miR-30a-star/SLC7A6) interactions for the negatively correlated miRNA-mRNA pairs (Table 4). Of note, both the experimentally validated pair of mRNA/miRNA genes and other 4 predicted miRNA-mRNA interactions (miR-130b-star/TSHZ3, miR-148a/BBS7, miR-148a/LIMA1 and miR-30a/PLAUR) were systematically altered in the 27 PDAC samples analyzed; in turn, another 10 predicted miRNA-mRNA pairs were specifically altered in GEP-A cases (miR-148a stem loop transcript/ACSL5, CTSE, SLC44A4, TNFRSF21 or TSPAN15, and miR-23a/COQ10A) or in GEP-B tumors (miR-1180/BMPER, miR-1244/C10orf118, miR-362-5p/FGD1 and the miR-423 stem loop transcript/RSPO3).
Table 4: miRNA-mRNA interactions in PDAC samples (n=27) identified by Spearman correlation analysis of the expression signal identified for those transcripts differentially expressed in pancreatic tumoral vs. non-tumoral tissues as detected by the Affymetrix HuGene 1.0 ST and microRNA 2.0 expression arrays.
DISCUSSION
PDAC is currently recognized as a genetically heterogeneous group of tumors, but limited information exists about the biological significance of such variability. In order to gain insight into the genetic heterogeneity of PDAC, here we analyzed for the first time, the global coding and non-coding GEP of a relatively large cohort of PDAC tumors vs. non-tumoral pancreatic tissues. Overall, our results showed two clearly defined subtypes of PDAC which shared a GEP clearly distinct from that of non-tumoral pancreatic tissues. Globally, this included increased expression of genes linked to PDAC cell proliferation, local invasion and metastatic capacity. Thus, the most top-ranked altered networks (e.g.: axonal guidance, inhibition of matrix metalloproteinases, semaphorin, epithelial adherent junction and Rho family of GTPases signaling pathways) are directly involved in cell-cell and cell-matrix adhesion, extracellular matrix degradation and tissue remodeling, angiogenesis, tumor cell migration and invasiveness [28-31]. In addition, cytoskeleton remodeling which is essential for cell movement and growth, is also altered in PDAC tumor cells as reflected by the alteration of axonal guidance, actin cytoskeleton, virus-entry via endocytosis, clathrin-mediated endocytosis, macropinocytosis signaling, as well as signaling pathways activated by the Rho family of GTPases [28-30, 32]; of note, many of such processes had been previously described to be altered in PDAC [27, 29, 30, 33]. PDAC tumors also showed a significant alteration of the early steps of cellular immune responses; this is possibly due to a host response against the tumor [34], as reflected by the alteration of cell adhesion, diapedesis and extravasation, IL8 signaling and antigen presentation via macropinocytosis signaling [35]. However, since the tumors here analyzed represented relatively advanced stages of the disease, alteration of such pathways could also be due to inflammation-mediated cell migration mechanisms [36]. Altogether, these processes found to be altered in PDAC encompass a pro-tumoral scenario; in such scenario PDAC tumor cells secrete factors that actively enhance recruitment of immune cells, while activated immune cells, produce cytokines and growth factors that may exert a direct effect on the tumor cells and the stroma [37]. This hypothesis was fully supported by the observation of areas containing significant leucocyte infiltrates in the tumoral vs. non-tumoral pancreatic tissues, through immunostainings for CD45 and CD15 of formalin-fixed, paraffin-embedded tissues from the same cases (data not shown).
Interestingly, in addition to the common GEP, the two subgroups of PDAC here identified also showed clearly different GEPs. Thus, enrichment in genes involved in the innate and adaptative immune response was predominantly detected in GEP-A vs. GEP-B cases, even when both subgroups of tumors presented similar levels of infiltration by inflammatory cells (data not shown). These findings, together with the increased expression of genes correlated to immune and chronic pancreatic diseases, cellular stress and injury conditions, among GEP-A vs. GEP-B cases, point out the potential involvement of immune selection mechanisms (e.g.: selection of non-immunogenic tumor-cell variants) in the former subgroup of PDAC [30]. Additionally, GEP-A tumors also showed an altered expression of genes involved in cell proliferation, angiogenesis, cell motility, invasion and tumor progression (e.g. genes involved in the MSP-RON, actin nucleation by the AR-WASP complex and by the Rho, Rac, PAK, Cdc42, integrin, ERK/MAPK, Paxilin, FAK, NF-KB, calpain protease and glioma tumor invasiveness pathways [28, 38-48], among other genes [31, 49, 50]), would confer a highly-aggressive phenotype to GEP-A tumor cells. Of note, GEP-A tumors retained an epithelial GEP phenotype which includes an increased expression of epithelial markers, carcinoembrionary antigens (CEACAM1, CEACAM6 and CEACAM 5) and cytokeratins (KRT7 and KRT19).
In contrast to GEP-A tumors, GEP-B PDAC cases showed fewer specifically altered canonical pathways, despite an overall similar number of altered genes was found in both subgroups of tumors (1,183 vs. 1,012 altered genes in GEP-A vs. GEP-B cases, respectively). Of note, GEP-B cases showed no specific GEPs associated to tumor cell proliferation; moreover, they had decreased expression of genes linked to canonical pathways associated with immune responses. Thus, GEP-B tumors had: i) enhanced self-defense mechanisms against complement-dependent cytotoxicity, as reflected by overexpression of the KIT mast cell-associated molecule [51]; ii) defective expression of major histocompatibility complex (MHC) molecules which are that frequently involved in tumor immune escape [52], and/or; iii) greater cancer-driven immunosuppression as a consequence of increased expression of the programmed cell death 1 ligand 2 (PDCD1LG2) [53] and the VGFC [51] genes. Most interestingly, our results indicate activation of epithelial-mesenchymal transition (EMT) genes in GEP-B tumors as depicted by their higher expression of mesenchymal signature genes (e.g: CDH2, SNAI1, SNAI2 and VIM) and other EMT-related genes (e.g. S100A4), together with decreased expression of epithelial markers (e.g: CEACAM6, EPCAM, CDH1, KRT8 and KRT18) [54-56], which activate the integrin linked kinase (ILK) signaling pathway [57], inhibit genes involved in cell-cell junction signaling pathways and expression of adhesion molecules (e.g: DSG2, DSC2 and PKP2 genes) [58]. Altogether, these results suggest that in GEP-B tumors, immunosuppression linked to an EMT phenotype could be involved in the pathogenesis of PDAC. Whether immunosuppression precedes or develops after acquisition of an EMT phenotype, remains to be determined.
Overall, the above results confirm and extend on previous observations about the existence of distinct molecular subgroups of PDAC tumors as identified by GEP, including a “classical epithelial” and a “quiasi-mesenchymal” subtype of PDAC [25]. However, despite this, we failed to detect a third subtype of PDAC tumors with an exocrine-like phenotype, as previously described by Collisson et al. in a larger patient cohort [25]. Such apparently discrepant results could potentially be due to differences in the size of the cohort analyzed (27 tumoral samples in our study vs. 63 PDAC samples in the series of Collisson et al.), the methodology used (e.g. macrodissected freshly-frozen PDAC tissues vs. a mixture of formalin-fixed paraffin-embedded and freshly-frozen PDAC tissues, with or without microdissection), and/or the comparison against non-pancreatic reference tissues done in our series, but not in the study by Collisson et al. [25]. Of note, we also failed to confirm the previously reported association between specific GEP and the clinical and histopathological features of the disease (e.g.: the association between a mesenchymal phenotypes and both adverse tumor features and a poorer prognosis) [25, 56, 59]. Independently of the pathogenic significance of the distinct GEP and tumor phenotypes here described, the understanding of such biological pathways may contribute to better identify more efficient treatment strategies and to e.g. avoid standard PDAC therapy with gemcitabine and 5-fluorouracil in patients with GEP-B, due to the high chemoresistance of PDAC cells with an EMT phenotype to these treatments [56, 60].
Despite all the above, a major concern remains regarding the functional effect of microRNA expression levels on the mRNA transcript expression. Here we identified several miRNAs to be significantly correlated with expression of specific genes at the mRNA level. Among other miRNA-mRNA pairs, the miR-30a-star emerged in our series, as significantly correlated with an increased expression of the SLC7A6 gene transcript. The SLC7A6 (solute carrier 7 member of this family of genes) has known functions in the transport of leucin, being involved in promoting cell growth in many cancers [61, 62] and podocyte development [63]. Furthermore, expression of the miR-30 family of miRNAs is a key element during embryonic pancreatic development to maintain the epithelial phenotype of pancreatic tissues [64], their inhibition mediating an EMT phenotype in several types of cancer [65, 66]. Although, we were not able to detect any other (validated) inverse correlation for other miR-30 elements-genes, decreased expression of miR-30a, miR-30c and miR-30d was found in both GEP-A and GEP-B tumors with an epithelial vs. EMT phenotype, respectively; these results suggest that the EMT phenotype is potentially promoted in all PDAC tumors, but only those tumors carrying additional molecular/genomic alterations associated with immunosuppression and/or activation of ILK signaling could more clearly acquire a mesenchymal phenotype. Other miRNAs found to be altered in PDAC were exclusively deregulated among GEP-A or GEP-B tumors. Interestingly deregulated miRNA genes in GEP-A tumors included the stem loop transcript of miR-148a. The miR-148a miRNA possibly mediates overexpression of genes involved in tumor cell growth (e.g. acetyl-CoA sintetase, ACSL5), migration (e.g. the TSPAN15 tetraspanin) with an effect also on both apoptosis and immune responses (e.g. the TNFRSF21 tumor necrosis factor receptor); in turn miR-23a inhibits the antioxidative effect of the coenzyme Q10 homologe A (COQ10A) gene. In contrast, those miRNA genes which were overexpressed in GEP-B tumors included the miR-1180, miR-362-5p and the miR-423, all of which promote tumor cell proliferation and invasion through e.g. the BMP binding endothelial regulator (BMPER), the FYVE Rho GEF and PH domain containing 1 (FGD1) and the R-spondin 3 (RSPO3) genes.
Interestingly, clear cut discrimination between GEP-A and GEP-B tumors carrying an epithelial vs. mesenchymal-like molecular profile could be obtained via a set of 63 and 97 mRNA genes overexpressed in GEP-A and GEP-B tumors, respectively, as also confirmed in an external series of 27 PDAC patients [25]. These results indicate that these gene signatures could potentially serve in the future as prior knowledge for the discovery of biomarker candidates (i.e: CEACAM5, GPX2, MUC13, S100P and TMEM45B for GEP-A cases, and PAPPA and VGLL3 for GEP-B tumors) that may contribute to more efficient treatment and/or monitoring of both subtypes of PDAC tumors. In addition, in our series a small panel of 5 overexpressed PDAC markers (S100A11, GPR137B, SULF1, POSTN and miR-155) would allow precise distinction between PDAC and non-tumoral pancreatic tissues. In line with this hypothesis, strong expression of the S100A11 and GPR137B genes has been reported at the protein level in PDAC tissues, while SULF1 and POSTN are expressed at more variable patterns [67-69]; of note all four proteins have been also found to be secreted and present in both tumor tissues and the plasma [67, 68, 70] from PDAC patients. Altogether, secretion of these proteins outside the tumor cell, supports the potential utility of these genes as candidate markers for the diagnosis and monitoring of PDAC patients.
In summary, the present study provides evidence for a common GEP of tumor cells in PDAC, at the same time it confirms the genetic complexity and heterogeneity of these tumors with at least two clearly distinct and unique GEPs (e.g. epithelial-like vs. mesenchymal-like genomic profiles), potentially reflecting different pathways involved in the oncogenesis and progression of PDAC. In addition, our results also highlight the potential role of the tumor microenvironment, particularly of the immune system, in PDAC, with potential diagnostic and therapeutic implications.
MATERIALS AND METHODS
Patients and samples
Tumor tissue specimens were obtained at diagnostic surgery from 27 consecutive sporadic PDAC patients (18 males and 9 females; mean age of 67 years, ranging from 41 to 79 years); in addition, non-tumoral pancreatic tissue specimens were also collected from another 5 patients each having a different pancreatic disease (pancreatic fibrosis with inflammation, chronic pancreatitis, an ampullary tumor, a neuroendocrine tumor and a PDAC, respectively). All PDAC patients underwent surgical tumor resection at the Division of Hepatobiliary and Pancreatic Surgery of the University Hospital of Salamanca (Salamanca, Spain). PDAC tumors were diagnosed and classified according to Adsay et al. [71] with the following distribution: 8 cases corresponded to well-differentiated/grade I tumors; 11 to moderately-differentiated/grade II, and; 8 to poorly-differentiated/grade III PDAC. Histopathological grade was confirmed in all cases in a second independent evaluation by an experienced pathologist. Most tumors (21/27, 78%) were localized in the head of the pancreas, while the remaining six cases were localized in the pancreatic body (1/27, 4%), the tail (3/27, 11%) and the pancreatic body/tail (2/27, 7%). Mean tumor size at diagnostic surgery was of 3.0±0.82 cm, 6 cases corresponding to TNM stage IIA tumors and 21 to TNM stage IIB. The most relevant clinical and laboratory patient characteristics are summarized in Supplementary Table 1.
Pancreatic tissue samples were collected immediately after surgical resection, snap frozen and stored in OCT at -80°C (Tumor Biobank of the University Hospital of Salamanca, Red de Bancos de Tumores de Castilla y León, Salamanca, Spain). The study was approved by the local ethics committee of the University Hospital of Salamanca (Salamanca, Spain) and informed consent was given by each individual prior to entering the study, according to the Declaration of Helsinki. Once the histopathological diagnosis had been established, sections from the paraffin-embedded tissue samples were cut from three different areas representative of the tumoral tissue with > 70% tumor cell infiltration by hematoxylin-eosin staining, excluding stroma-enriched tumor areas. Selection of the neighbour areas of the tumor containing ≥70% tumor cells was performed on dissected samples stored in OCT.
RNA extraction and gene expression profiling (GEP) microarray studies
For GEP, sample preparation was performed as described in the Affymetrix GeneChip Expression Analysis Manual (Santa Clara, CA, USA). Briefly, each frozen tissue (≥0.3 g) was crushed to powder at cryogenic temperatures and homogeneized in Trizol (Life Technologies, Inc., Rockville, MD). Total RNA was then extracted using the miRNeasy mini kit according to the manufacturer’s protocol (Qiagen, Valencia, CA); subsequently, the quality and integrity of the RNA was evaluated in an Agilent 2100 Bioanalyzer (Agilent Technologies Inc., Santa Clara, CA, USA). Total RNA (100-1,000ng) from both tumoral and non-tumoral pancreatic tissues was hybridized to both the Affymetrix Human Gene ST 1.0 Expression and the microRNA 2.0 Expression arrays, according to the instructions of the manufacturer. Fluorescence signals were detected using the GeneChip Scanner 3000 7G (Affymetrix) and data stored as .CEL files.
For data analysis, GEP raw data derived from the Affymetrix Human Gene Expression ST 1.0 microarray and the microRNA 2.0 microarray, was normalized with the Robust Multi-array Average (RMA) algorithm; this included sequentially background correction, intra- and inter-microarray well normalization, probe set summarization and calculation of expression signals, respectively [72]. Unsupervised classification of samples and genes -28,869 mRNA and 4,544 human small non-coding RNA transcripts- was performed by principal component (PCA) and hierarchical clustering analyses (HCA) using the expression signal detected for each gene for each probe set, and the MultiExperiment Viewer (MeV, version 4.8.1) [73] and Cluster 3.0 software programs (PAM software; http://www-stat.stanford.edu/~tibs/PAM). Clustering was run using an Euclidean correlation metric and the average linkage method. For visualization of dendograms, the TreeView software (version 1.0.4) [74] was used. Differentially expressed genes between all tumor samples or GEP-defined subgroups of PDAC samples vs. non-tumoral samples were identified by supervised two-class unpaired Significance Analysis of Microarray (SAM; MeV software) [75] based on a false discovery rate (FDR) cut off of < .0001 and an absolute fold change cutoff of ≥2.0.
In order to identify the best combination of genes for the discrimination between the GEP of PDAC tumors and non-neoplastic pancreatic tissues, a two-step strategy was used. In the first step, five prediction algorithms were used: 1) PAM (PAM software v 2.1; University of Stanford, CA) [76], 2) Partial Least Squares algorithms (PLS; SIMFIT software v.6.9.9; www.simfit.org.uk), 3) Support Vector Machines (SVM), 4) K-Nearest Neigbour (KNN) and, 5) Random Forest algorithms; the latter three algorithms are implemented in the Babelomics suite (http://babelomics.bioinfo.cipf.es/) [77]. For this purpose, GEP data from two-thirds of the tumoral samples was randomly selected as a training dataset, while the remaining were used to build the validation dataset. In this first step, informative genes were defined as those represented in ≥ 4/5 analyses. In the second step, the discriminative power of each informative gene was assessed by receiver operating curve (ROC) analysis (SPSS 15.0 Inc, Chicago, IL, USA). Finally, those genes which depicted a high predictive power -area under the curve (AUC) ≥0.96- together with an expression fold change (vs. non-tumoral tissues) > 4, were selected. Validation of genes was performed in the same pancreatic sample series (27 tumoral plus 5 pancreatic non-tumoral samples) applying the PAM and SVM models, using a 10-fold and a leave-one-out-cross validation method, respectively.
For the identification of miRNA candidates acting as gene-regulators in PDAC samples, Spearman correlation analyses were performed to identify significant correlations between individual miRNA and mRNA gene transcripts across tumoral (n = 27) and non-tumoral (n = 5) samples. Each miRNA-mRNA interaction identified was subsequently evaluated with the Ingenuity Pathway Analysis software (IPA, Ingenuity Systems, www.ingenuity.com), as well as with available databases of experimentally validated miRNA interactions (TarBase 6.0 and miRWalk-database) and miRNA target prediction tools (DIANA-microT-CDS v5.0, miRWalk-database and miRecords) [78, 79]. Functional enrichment analysis of deregulated genes, analysis of canonical pathways, correlation networks, as well as gene-gene and gene-miRNA interactions were defined using the IPA software.
Validation of gene expression profiles by quantitative real-time PCR assays
TaqMan Gene Expression Assays were used to validate GEP in the same samples used for microarray studies via the Step One Plus Real-Time PCR System -Applied Biosystems (ABI; Foster City, CA, USA) according to the manufacturer’s instructions. The assays ID for the genes studied were as follows: Hs_00429010_m1 (PDIA2), Hs_00170815_m1 (POSTN), Hs_00418420_m1 (SCYN), 002220 (hsa-miR-216a), 002337 (hsa-miR-217), 002623 (hsa-miR-155) and 000507 (hsa-miR-203). Each PCR was carried out in duplicate in a final volume of 10 uL using the TaqMan Fast Universal Mastermix (ABI) and the following cycling parameters: incubation at 95ºC (20 s), followed by 50 cycles at 95ºC (1s) and an incubation at 60ºC (20s). GEP and miRNA expression data was normalized against the GAPDH internal housekeeping gene and the RNU43 internal control, and it was further analyzed using the StepOne software (v2.0; ABI). The relative amounts of the quantified genes were calculated using the following equation: 2-ΔCT (ΔCT = CT GENE-CT GAPDH or RNU43) expressed as arbitrary units (AU); results showed a high degree of correlation between data from both microarrays and RQ-PCR methods, for all genes evaluated (r2≥ 0.66, p < .0001; Supplementary Figure 1).
External validation series of PDAC tumors
External validation of the predictive value of the differentially expressed genes that discriminated between the distinct GEP-defined subgroups of PDAC tumors found in our series, was performed in a group of previously reported PDAC patients (n = 27). GEP array data files (Affymetrix Human Genome U133 Plus 2.0 Array) are publicly available at the GEO database (accession number GSE17891) [25]. Downloaded data CEL files were normalized using the RMA algorithm and overlapping probe sets were defined on the basis of probe specificity, using the GATExplorer server [80]. Probe sets with the best specificity to the interrogated genes (see Supplementary Table 7) were selected, and the expression signals detected for each gene for each probe set were further analyzed using the column metric preserving biplot assay [81] implemented in the SIMFIT statistical software (http://www.simfit.org.uk/).
Other statistical methods
The Mann-Whitney U test and a linear regression model were used to evaluate the statistical significance of differences observed between groups and to explore the degree of correlation between different variables, respectively (SPSS 15.0 Inc.). P-values ≤.05 were considered to be associated with statistical significance.
ACknowlEdgments
We thank Diego Alonso-López from the Bioinformatics Unit, Cancer Research Center (IBMCC-CSIC/USAL), for his technical advice on microarray data analysis.
FINANCIAL DISCLOSURE
This work has been partially supported by grants from the Gerencia Regional de Salud de Castilla y León, Valladolid, Spain (GRS861/A/13), RTICC from the Instituto de Salud Carlos III, Ministerio de Sanidad y Consumo, Madrid, Spain (RD06/0020/0035-FEDER; RD12/0036/0048-FEDER), Fundación Memoria de Don Samuel Solórzano Barruso, Salamanca, Spain (FS/13-2012 and FS/16-2013). JM Sayagués is supported by grant CP05/00321 from the Ministerio de Ciencia e Innovación, Madrid, Spain.
CONFLICTs OF INTEREST
None to declare.
References
1. Gutierrez ML, Sayagues JM, Abad MM, Bengoechea O, Gonzalez-Gonzalez M, Orfao A and Munoz-Bellvis L. Cytogenetic heterogeneity of pancreatic ductal adenocarcinomas: identification of intratumoral pathways of clonal evolution. Histopathology. 2011; 58:486-497.
2. Gutierrez ML, Munoz-Bellvis L, Abad MM, Bengoechea O, Gonzalez-Gonzalez M, Orfao A and Sayagues JM. Association between genetic subgroups of pancreatic ductal adenocarcinoma defined by high density 500 K SNP-arrays and tumor histopathology. PLoSOne. 2011; 6:e22315.
3. Harada T, Okita K, Shiraishi K, Kusano N, Kondoh S and Sasaki K. Interglandular cytogenetic heterogeneity detected by comparative genomic hybridization in pancreatic cancer. Cancer Res. 2002; 62:835-839.
4. Nakamura T, Kuwai T, Kitadai Y, Sasaki T, Fan D, Coombes KR, Kim SJ and Fidler IJ. Zonal heterogeneity for gene expression in human pancreatic carcinoma. Cancer Res. 2007; 67:7597-7604.
5. Iacobuzio-Donahue CA, Fu B, Yachida S, Luo M, Abe H, Henderson CM, Vilardell F, Wang Z, Keller JW, Banerjee P, Herman JM, Cameron JL, Yeo CJ, et al. DPC4 gene status of the primary carcinoma correlates with patterns of failure in patients with pancreatic cancer. JClinOncol. 2009; 27:1806-1813.
6. Gorunova L, Hoglund M, Andren-Sandberg A, Dawiskiba S, Jin Y, Mitelman F and Johansson B. Cytogenetic analysis of pancreatic carcinomas: intratumor heterogeneity and nonrandom pattern of chromosome aberrations. Genes ChromosomesCancer. 1998; 23:81-99.
7. Bogaert J and Prenen H. Molecular genetics of colorectal cancer. Ann Gastroenterol. 2014; 27:9-14.
8. Lei Z, Tan IB, Das K, Deng N, Zouridis H, Pattison S, Chua C, Feng Z, Guan YK, Ooi CH, Ivanova T, Zhang S, Lee M, et al. Identification of molecular subtypes of gastric cancer with different responses to PI3-kinase inhibitors and 5-fluorouracil. Gastroenterology. 2013; 145:554-565.
9. Allison KH and Sledge GW, Jr. Heterogeneity and Cancer. Oncology (Williston Park). 2014; 28.
10. Balagurunathan Y, Morse DL, Hostetter G, Shanmugam V, Stafford P, Shack S, Pearson J, Trissal M, Demeure MJ, Von Hoff DD, Hruby VJ, Gillies RJ and Han H. Gene expression profiling-based identification of cell-surface targets for developing multimeric ligands in pancreatic cancer. Mol Cancer Ther. 2008; 7:3071-3080.
11. Lowe AW, Olsen M, Hao Y, Lee SP, Taek Lee K, Chen X, van de Rijn M and Brown PO. Gene expression patterns in pancreatic tumors, cells and tissues. PLoS One. 2007; 2:e323.
12. Jones S, Zhang X, Parsons DW, Lin JC, Leary RJ, Angenendt P, Mankoo P, Carter H, Kamiyama H, Jimeno A, Hong SM, Fu B, Lin MT, et al. Core signaling pathways in human pancreatic cancers revealed by global genomic analyses. Science. 2008; 321:1801-1806.
13. Heidenblad M, Lindgren D, Veltman JA, Jonson T, Mahlamaki EH, Gorunova L, van Kessel AG, Schoenmakers EF and Hoglund M. Microarray analyses reveal strong influence of DNA copy number alterations on the transcriptional patterns in pancreatic cancer: implications for the interpretation of genomic amplifications. Oncogene. 2005; 24:1794-1801.
14. Iacobuzio-Donahue CA, Ashfaq R, Maitra A, Adsay NV, Shen-Ong GL, Berg K, Hollingsworth MA, Cameron JL, Yeo CJ, Kern SE, Goggins M and Hruban RH. Highly expressed genes in pancreatic ductal adenocarcinomas: a comprehensive characterization and comparison of the transcription profiles obtained from three major technologies. Cancer Res. 2003; 63:8614-8622.
15. Iacobuzio-Donahue CA, Maitra A, Shen-Ong GL, van Heek T, Ashfaq R, Meyer R, Walter K, Berg K, Hollingsworth MA, Cameron JL, Yeo CJ, Kern SE, Goggins M, et al. Discovery of novel tumor markers of pancreatic cancer using global gene expression technology. Am J Pathol. 2002; 160:1239-1249.
16. Liang WS, Craig DW, Carpten J, Borad MJ, Demeure MJ, Weiss GJ, Izatt T, Sinari S, Christoforides A, Aldrich J, Kurdoglu A, Barrett M, Phillips L, et al. Genome-wide characterization of pancreatic adenocarcinoma patients using next generation sequencing. PLoSOne. 2012; 7:e43192.
17. Nones K, Waddell N, Song S, Patch AM, Miller D, Johns A, Wu J, Kassahn KS, Wood D, Bailey P, Fink L, Manning S, Christ AN, et al. Genome-wide DNA methylation patterns in pancreatic ductal adenocarcinoma reveal epigenetic deregulation of SLIT-ROBO, ITGA2 and MET signaling. Int J Cancer. 2014; 135:1110-1118.
18. Stratford JK, Bentrem DJ, Anderson JM, Fan C, Volmar KA, Marron JS, Routh ED, Caskey LS, Samuel JC, Der CJ, Thorne LB, Calvo BF, Kim HJ, et al. A six-gene signature predicts survival of patients with localized pancreatic ductal adenocarcinoma. PLoS Med. 2010; 7:e1000307.
19. Mees ST, Mardin WA, Schleicher C, Colombo-Benkmann M, Senninger N and Haier J. Role of tumor microenvironment on gene expression in pancreatic cancer tumor models. J Surg Res. 2011; 171:136-142.
20. Zhang G, Schetter A, He P, Funamizu N, Gaedcke J, Ghadimi BM, Ried T, Hassan R, Yfantis HG, Lee DH, Lacy C, Maitra A, Hanna N, et al. DPEP1 inhibits tumor cell invasiveness, enhances chemosensitivity and predicts clinical outcome in pancreatic ductal adenocarcinoma. PLoS One. 2012; 7:e31507.
21. Wang L, Tsutsumi S, Kawaguchi T, Nagasaki K, Tatsuno K, Yamamoto S, Sang F, Sonoda K, Sugawara M, Saiura A, Hirono S, Yamaue H, Miki Y, et al. Whole-exome sequencing of human pancreatic cancers and characterization of genomic instability caused by MLH1 haploinsufficiency and complete deficiency. Genome Res. 2012; 22:208-219.
22. Buchholz M, Braun M, Heidenblut A, Kestler HA, Kloppel G, Schmiegel W, Hahn SA, Luttges J and Gress TM. Transcriptome analysis of microdissected pancreatic intraepithelial neoplastic lesions. Oncogene. 2005; 24:6626-6636.
23. Prasad NB, Biankin AV, Fukushima N, Maitra A, Dhara S, Elkahloun AG, Hruban RH, Goggins M and Leach SD. Gene expression profiles in pancreatic intraepithelial neoplasia reflect the effects of Hedgehog signaling on pancreatic ductal epithelial cells. Cancer Res. 2005; 65:1619-1626.
24. Sun T, Kong X, Du Y and Li Z. Aberrant MicroRNAs in Pancreatic Cancer: Researches and Clinical Implications. Gastroenterol Res Pract. 2014; 2014:386561.
25. Collisson EA, Sadanandam A, Olson P, Gibb WJ, Truitt M, Gu S, Cooc J, Weinkle J, Kim GE, Jakkula L, Feiler HS, Ko AH, Olshen AB, et al. Subtypes of pancreatic ductal adenocarcinoma and their differing responses to therapy. Nat Med. 2011; 17:500-503.
26. Donahue TR, Tran LM, Hill R, Li Y, Kovochich A, Calvopina JH, Patel SG, Wu N, Hindoyan A, Farrell JJ, Li X, Dawson DW and Wu H. Integrative survival-based molecular profiling of human pancreatic cancer. ClinCancer Res. 2012; 18:1352-1363.
27. Frampton AE, Castellano L, Colombo T, Giovannetti E, Krell J, Jacob J, Pellegrino L, Roca-Alonso L, Funel N, Gall TM, De Giorgio A, Pinho FG, Fulci V, et al. MicroRNAs cooperatively inhibit a network of tumor suppressor genes to promote pancreatic tumor growth and progression. Gastroenterology. 2014; 146:268-277 e218.
28. Heasman SJ and Ridley AJ. Mammalian Rho GTPases: new insights into their functions from in vivo studies. Nat Rev Mol Cell Biol. 2008; 9:690-701.
29. Biankin AV, Waddell N, Kassahn KS, Gingras MC, Muthuswamy LB, Johns AL, Miller DK, Wilson PJ, Patch AM, Wu J, Chang DK, Cowley MJ, Gardiner BB, et al. Pancreatic cancer genomes reveal aberrations in axon guidance pathway genes. Nature. 2012; 491:399-405.
30. Schiarea S, Solinas G, Allavena P, Scigliuolo GM, Bagnati R, Fanelli R and Chiabrando C. Secretome analysis of multiple pancreatic cancer cell lines reveals perturbations of key functional networks. J Proteome Res. 2010; 9:4376-4392.
31. Crivellato E. The role of angiogenic growth factors in organogenesis. Int J Dev Biol. 2011; 55:365-375.
32. Pyrzynska B, Pilecka I and Miaczynska M. Endocytic proteins in the regulation of nuclear signaling, transcription and tumorigenesis. Mol Oncol. 2009; 3:321-338.
33. Sousa CM and Kimmelman AC. The complex landscape of pancreatic cancer metabolism. Carcinogenesis. 2014; 35:1441-1450.
34. Inman KS, Francis AA and Murray NR. Complex role for the immune system in initiation and progression of pancreatic cancer. World J Gastroenterol. 2014; 20:11160-11181.
35. Kerr MC and Teasdale RD. Defining macropinocytosis. Traffic. 2009; 10:364-371.
36. Reymond N, d’Agua BB and Ridley AJ. Crossing the endothelial barrier during metastasis. Nat Rev Cancer. 2013; 13:858-870.
37. Luo G, Long J, Zhang B, Liu C, Xu J, Ni Q and Yu X. Stroma and pancreatic ductal adenocarcinoma: an interaction loop. Biochim Biophys Acta. 2012; 1826:170-178.
38. Yao HP, Zhou YQ, Zhang R and Wang MH. MSP-RON signalling in cancer: pathogenesis and therapeutic potential. Nat Rev Cancer. 2013; 13:466-481.
39. Yamaguchi H, Lorenz M, Kempiak S, Sarmiento C, Coniglio S, Symons M, Segall J, Eddy R, Miki H, Takenawa T and Condeelis J. Molecular mechanisms of invadopodium formation: the role of the N-WASP-Arp2/3 complex pathway and cofilin. J Cell Biol. 2005; 168:441-452.
40. Kwiatkowska A and Symons M. Signaling determinants of glioma cell invasion. Adv Exp Med Biol. 2013; 986:121-141.
41. Fang JY and Richardson BC. The MAPK signalling pathways and colorectal cancer. Lancet Oncol. 2005; 6:322-327.
42. Moreno-Layseca P and Streuli CH. Signalling pathways linking integrins with cell cycle progression. Matrix Biol. 2014; 34:144-153.
43. Radu M, Semenova G, Kosoff R and Chernoff J. PAK signalling during the development and progression of cancer. Nat Rev Cancer. 2014; 14:13-25.
44. Whale A, Hashim FN, Fram S, Jones GE and Wells CM. Signalling to cancer cell invasion through PAK family kinases. Front Biosci (Landmark Ed). 2011; 16:849-864.
45. Wells A, Huttenlocher A and Lauffenburger DA. Calpain proteases in cell adhesion and motility. Int Rev Cytol. 2005; 245:1-16.
46. Tsuda M and Tanaka S. Roles for crk in cancer metastasis and invasion. Genes Cancer. 2012; 3:334-340.
47. Sulzmaier FJ, Jean C and Schlaepfer DD. FAK in cancer: mechanistic findings and clinical applications. Nat Rev Cancer. 2014; 14:598-610.
48. Noort AR, van Zoest KP, Weijers EM, Koolwijk P, Maracle CX, Novack DV, Siemerink MJ, Schlingemann RO, Tak PP and Tas SW. NF-kappaB-inducing kinase is a key regulator of inflammation-induced and tumour-associated angiogenesis. J Pathol. 2014; 234:375-385.
49. Roh-Johnson M, Bravo-Cordero JJ, Patsialou A, Sharma VP, Guo P, Liu H, Hodgson L and Condeelis J. Macrophage contact induces RhoA GTPase signaling to trigger tumor cell intravasation. Oncogene. 2014; 33:4203-4212.
50. Iozzo RV, Zoeller JJ and Nystrom A. Basement membrane proteoglycans: modulators Par Excellence of cancer growth and angiogenesis. Mol Cells. 2009; 27:503-513.
51. Evans A and Costello E. The role of inflammatory cells in fostering pancreatic cancer cell growth and invasion. Front Physiol. 2012; 3:270.
52. Chen XH, Liu ZC, Zhang G, Wei W, Wang XX, Wang H, Ke HP, Zhang F, Wang HS, Cai SH and Du J. TGF-beta and EGF induced HLA-I downregulation is associated with epithelial-mesenchymal transition (EMT) through upregulation of snail in prostate cancer cells. Mol Immunol. 2015; 65:34-42.
53. Messal N, Serriari NE, Pastor S, Nunes JA and Olive D. PD-L2 is expressed on activated human T cells and regulates their function. Mol Immunol. 2011; 48:2214-2219.
54. Steinestel K, Eder S, Schrader AJ and Steinestel J. Clinical significance of epithelial-mesenchymal transition. Clin Transl Med. 2014; 3:17.
55. Xu X, Su B, Xie C, Wei S, Zhou Y, Liu H, Dai W, Cheng P, Wang F and Guo C. Sonic hedgehog-Gli1 signaling pathway regulates the epithelial mesenchymal transition (EMT) by mediating a new target gene, S100A4, in pancreatic cancer cells. PLoS One. 2014; 9:e96441.
56. Satoh K, Hamada S and Shimosegawa T. Involvement of epithelial to mesenchymal transition in the development of pancreatic ductal adenocarcinoma. J Gastroenterol. 2014.
57. Oloumi A, McPhee T and Dedhar S. Regulation of E-cadherin expression and beta-catenin/Tcf transcriptional activity by the integrin-linked kinase. Biochim Biophys Acta. 2004; 1691:1-15.
58. Franke WW and Rickelt S. Mesenchymal-epithelial transitions: spontaneous and cumulative syntheses of epithelial marker molecules and their assemblies to novel cell junctions connecting human hematopoietic tumor cells to carcinomatoid tissue structures. Int J Cancer. 2011; 129:2588-2599.
59. Lee SH, Kim H, Hwang JH, Shin E, Lee HS, Hwang DW, Cho JY, Yoon YS, Han HS and Cha BH. CD24 and S100A4 expression in resectable pancreatic cancers with earlier disease recurrence and poor survival. Pancreas. 2014; 43:380-388.
60. Wang Z, Li Y, Kong D, Banerjee S, Ahmad A, Azmi AS, Ali S, Abbruzzese JL, Gallick GE and Sarkar FH. Acquisition of epithelial-mesenchymal transition phenotype of gemcitabine-resistant pancreatic cancer cells is linked with activation of the notch signaling pathway. Cancer Res. 2009; 69:2400-2407.
61. Wang Q, Bailey CG, Ng C, Tiffen J, Thoeng A, Minhas V, Lehman ML, Hendy SC, Buchanan G, Nelson CC, Rasko JE and Holst J. Androgen receptor and nutrient signaling pathways coordinate the demand for increased amino acid transport during prostate cancer progression. Cancer Res. 2011; 71:7525-7536.
62. Wang Q, Tiffen J, Bailey CG, Lehman ML, Ritchie W, Fazli L, Metierre C, Feng YJ, Li E, Gleave M, Buchanan G, Nelson CC, Rasko JE, et al. Targeting amino acid transport in metastatic castration-resistant prostate cancer: effects on cell cycle, cell growth, and tumor development. J Natl Cancer Inst. 2013; 105:1463-1473.
63. Sekine Y, Nishibori Y, Akimoto Y, Kudo A, Ito N, Fukuhara D, Kurayama R, Higashihara E, Babu E, Kanai Y, Asanuma K, Nagata M, Majumdar A, et al. Amino acid transporter LAT3 is required for podocyte development and function. J Am Soc Nephrol. 2009; 20:1586-1596.
64. Joglekar MV, Patil D, Joglekar VM, Rao GV, Reddy DN, Mitnala S, Shouche Y and Hardikar AA. The miR-30 family microRNAs confer epithelial phenotype to human pancreatic cells. Islets. 2009; 1:137-147.
65. Baraniskin A, Birkenkamp-Demtroder K, Maghnouj A, Zollner H, Munding J, Klein-Scory S, Reinacher-Schick A, Schwarte-Waldhoff I, Schmiegel W and Hahn SA. MiR-30a-5p suppresses tumor growth in colon carcinoma by targeting DTL. Carcinogenesis. 2012; 33:732-739.
66. Kao CJ, Martiniez A, Shi XB, Yang J, Evans CP, Dobi A, deVere White RW and Kung HJ. miR-30 as a tumor suppressor connects EGF/Src signal to ERG and EMT. Oncogene. 2014; 33:2495-2503.
67. Chelala C, Hahn SA, Whiteman HJ, Barry S, Hariharan D, Radon TP, Lemoine NR and Crnogorac-Jurcevic T. Pancreatic Expression database: a generic model for the organization, integration and mining of complex cancer datasets. BMCGenomics. 2007; 8:439.
68. Thomas JK, Kim MS, Balakrishnan L, Nanjappa V, Raju R, Marimuthu A, Radhakrishnan A, Muthusamy B, Khan AA, Sakamuri S, Tankala SG, Singal M, Nair B, et al. Pancreatic Cancer Database: an integrative resource for pancreatic cancer. Cancer Biol Ther. 2014; 15:963-967.
69. Uhlen M, Oksvold P, Fagerberg L, Lundberg E, Jonasson K, Forsberg M, Zwahlen M, Kampf C, Wester K, Hober S, Wernerus H, Bjorling L and Ponten F. Towards a knowledge-based Human Protein Atlas. Nat Biotechnol. 2010; 28:1248-1250.
70. Nanjappa V, Thomas JK, Marimuthu A, Muthusamy B, Radhakrishnan A, Sharma R, Ahmad Khan A, Balakrishnan L, Sahasrabuddhe NA, Kumar S, Jhaveri BN, Sheth KV, Kumar Khatana R, et al. Plasma Proteome Database as a resource for proteomics research: 2014 update. Nucleic Acids Res. 2014; 42:D959-965.
71. Adsay NV, Basturk O, Bonnett M, Kilinc N, Andea AA, Feng J, Che M, Aulicino MR, Levi E and Cheng JD. A proposal for a new and more practical grading scheme for pancreatic ductal adenocarcinoma. AmJSurgPathol. 2005; 29:724-733.
72. Irizarry RA, Hobbs B, Collin F, Beazer-Barclay YD, Antonellis KJ, Scherf U and Speed TP. Exploration, normalization, and summaries of high density oligonucleotide array probe level data. Biostatistics. 2003; 4:249-264.
73. Saeed AI, Sharov V, White J, Li J, Liang W, Bhagabati N, Braisted J, Klapa M, Currier T, Thiagarajan M, Sturn A, Snuffin M, Rezantsev A, et al. TM4: a free, open-source system for microarray data management and analysis. Biotechniques. 2003; 34:374-378.
74. Saldanha AJ. Java Treeview—extensible visualization of microarray data. Bioinformatics. 2004; 20:3246-3248.
75. Tusher VG, Tibshirani R and Chu G. Significance analysis of microarrays applied to the ionizing radiation response. ProcNatlAcadSciUSA. 2001; 98:5116-5121.
76. Tibshirani R, Hastie T, Narasimhan B and Chu G. Diagnosis of multiple cancer types by shrunken centroids of gene expression. ProcNatlAcadSciUSA. 2002; 99:6567-6572.
77. Medina I, Carbonell J, Pulido L, Madeira SC, Goetz S, Conesa A, Tarraga J, Pascual-Montano A, Nogales-Cadenas R, Santoyo J, Garcia F, Marba M, Montaner D, et al. Babelomics: an integrative platform for the analysis of transcriptomics, proteomics and genomic data with advanced functional profiling. Nucleic Acids Res. 2010; 38:W210-W213.
78. Dweep H, Sticht C, Pandey P and Gretz N. miRWalk—database: prediction of possible miRNA binding sites by “walking” the genes of three genomes. JBiomedInform. 2011; 44:839-847.
79. Xiao F, Zuo Z, Cai G, Kang S, Gao X and Li T. miRecords: an integrated resource for microRNA-target interactions. Nucleic Acids Res. 2009; 37:D105-D110.
80. Risueno A, Fontanillo C, Dinger ME and De Las Rivas J. GATExplorer: genomic and transcriptomic explorer; mapping expression probes to gene loci, transcripts, exons and ncRNAs. BMC Bioinformatics. 2010; 11:221.
81. Gabriel KR. The biplot graphic display of matrices with application to principal component analysis. Biometrika. 1971; 58:453-467.