
INTRODUCTION
Several genes encode small functional RNA molecules (of ~22 nucleotides) named microRNAs (miRNAs), which regulate the expression of up to 30% protein coding genes [1]. Primary transcripts (pri-miRNAs) of mature miRNAs, folding into a stable hairpin/stem loop structure, generate miRNA precursors (pre-miRNA). The loop of pre-miRNA is then removed to form a short double-stranded RNA (dsRNA), each single strand can act as a mature miRNA obtained by a special RNaseIII-like endonuclease, called Dicer, which integrates the mature miRNA into the RNA induced silencing complex (RISC) [1]. The RISC complex negatively regulates gene expression through the inhibition of the translation elongation or triggering mRNA destruction, depending on the degree of miRNA complementary with its target [1]. However, it has been also reported that miRNAs may also increase the translation of selected mRNAs in certain cell contexts [2]. Usually, miRNA target sites are located within the 3’ untranslated regions (3’-UTRs) of the mRNAs [3]. The expression of miRNAs displays a cell type and tissue specificity, indicating that miRNAs are closely associated with cell differentiation and development [4, 5]. In addition, miRNAs exert a regulatory role in numerous physiologic and pathologic processes, including many types of tumors [6, 7].
One of the first solid tumors profiled for miRNAs expression is breast cancer, the most common female malignancy in western countries [8]. Among the most significant miRNAs overexpressed in breast carcinoma, miRNA-21 has been shown to mediate cell survival and proliferation by targeting onco-suppressor genes such as PTEN and PDCD4 [9]. Moreover, miRNA21 expression has been associated with advanced clinical stage, lymph node metastasis and poor prognosis [10]. On the contrary, the ectopic expression of miRNA205 in breast cancer cells decreased proliferation and improved the responsiveness to tyrosine kinase inhibitors like gefitinib [11]. miRNAs expression was also related to some biological features of breast carcinoma including the expression of the estrogen receptor (ER) and the progesterone receptor (PR) as well as the tumor grade, stage and invasion [9]. For instance, it was demonstrated that miRNA206 targets directly ERα [9], whereas miRNA221 and miRNA222 may confer a tamoxifen resistance regulating p27 [12] and ERα [13]. In addition, miRNA191 and miRNA425 were reported to be regulated by ERα [14]. As it concerns the hepatocellular carcinoma, the expression levels of miRNA222, miRNA106a, miRNA17/92 and miRNA 135b were associated with tumor differentiation [15, 16], while miRNA125b was correlated with a good survival [17]. The gene encoding human miR144 is located on chromosome 17 and includes a transcriptional unit that encodes also miRNA451 [18].. In erythroid cells, miR144 and miRNA451 form a miRNA cluster which was found decreased in erythroid hyperplasia, ineffective erythropoiesis and mild anemia [19]. However, the role of miR144 in terminal erythropoiesis remains to be determined as its function is still unknown [19]. In solid tumors like breast carcinoma, the expression and action of miR144 have not been fully evaluated. In nasopharyngeal carcinoma, the up-regulation of miR144 led to cell proliferation [20], whereas its reduction was associated with a poor prognosis in patients with colorectal tumors [21]. In human neuroblastoma cells, increased levels of miR144 were found to occur through the nuclear transcription factor AP-1 [22], whereas in rat and human pancreatic islets miR144 expression was found to be up-regulated by 17β estradiol (E2) [23].
Estrogens influence the proliferation, differentiation and physiology of normal and malignant tissues mainly binding to the estrogen receptor (ER)α and ERβ [24]. In recent years, the G protein estrogen receptor namely GPER/GPR30 has been also involved in the estrogen action in numerous types of normal and tumor cells [25, 26]. Estrogenic GPER signalling induces relevant biological responses like gene expression changes, cell proliferation and migration [27-33] by activating several transduction pathways like the epidermal growth factor receptor (EGFR), the mitogen-activated protein kinase/extracellular regulated protein kinase (MAPK/ERK), the phosphatidylinositol 3-kinase/protein kinase B (PI3K/Akt), cyclic adenosine mono-phosphate (cAMP) and phospholipase C (PLC) [25].
In this study, we show that E2 and the selective GPER ligand G-1 up-regulate miR144 expression through the GPER and the involvement of the PI3K/ERK1/2/Elk1 transduction pathway in both breast cancer and hepatocarcinoma cells. Next, we demonstrate that miR144 and its target, namely the onco-suppressor Runx1, are involved in the stimulation of cell cycle progression upon exposure to E2. In addition, we evidence that E2 and G-1 regulate through GPER the expression of miR144 and Runx1 in cancer-associated fibroblasts (CAFs), which are main stimulatory components of the tumor microenvironment. Results similar to those reported above were partially recapitulated in tumor xenografts. Altogether, our data provide new insights into the molecular mechanisms triggered by estrogenic GPER signalling towards miRNA regulation and cancer progression.
RESULTS
Transduction mechanisms involved in the up-regulation of miR144 by E2 and G-1
On the basis of previous data indicating that E2 regulates certain miRNAs as miR144 [23], ER-negative SkBr3 breast cancer and HepG2 hepatocarcinoma cells (Supplementary Figure 1) [27, 29] were treated with 100nM E2 and 100nM G-1 to assess miR144 expression by real-time PCR. Worthy, the increase of miR144 levels induced by both compounds (Figure 1A, 1E) was no longer evident silencing GPER in SkBr3 and HepG2 cells (Figure 1B-1D and 1F-1H). Then, we ascertained that two main transduction pathways involved in GPER signalling, like ERK1/2 and PI3K-Akt [25], contribute to the up-regulation of miR144 by 100nM E2 and 100nM G-1 as this response was abrogated in the presence of 1µM MEK inhibitor PD or 1µM PI3K inhibitor Wm (Figure 1I, 1J). Next, a rapid Akt and ERK1/2 phosphorylation (5 min) triggered by 100nM E2 and 100nM G-1 was abolished silencing GPER expression (Figure 1K-1R). To further investigate the mechanisms involved in the transcription of miR144, we analyzed its ~-1kb promoter region (http://www.ncbi.nlm.nih.gov; http://www.generegulation.com) identifying a putative Elk1 binding site (Figure 2A). Hence, we transfected cells with a Gal4-Elk1 construct together with the reporter gene Gal4-Luc, detecting a substantial luciferase activity upon treatment with 100nM E2 and 100nM G-1 (Figure 2B). In accordance with these results, the protein levels of Elk1 were up-regulated treating cells for 2h with 100nM E2 and 100nM G-1, however this response was prevented silencing GPER (Figure 2C-2J) or in the presence of 1µM PD or 1µM Wm (Figure 2K-2N). Thereafter, in both SkBr3 and HepG2 cells ChIP analysis revealed that Elk1 is recruited within the miR144 promoter region upon a 2h exposure to 100nM E2 and 100nM G-1, however this recruitment was no longer evident silencing GPER (Figure 2O, 2Q) or treating cells with 1µM PD or 1µM Wm (Figure 2P, 2R). Altogether, these findings indicate that the up-regulation of miR144 induced by E2 and G-1 involves GPER and a transduction network in SkBr3 and HepG2 cells.
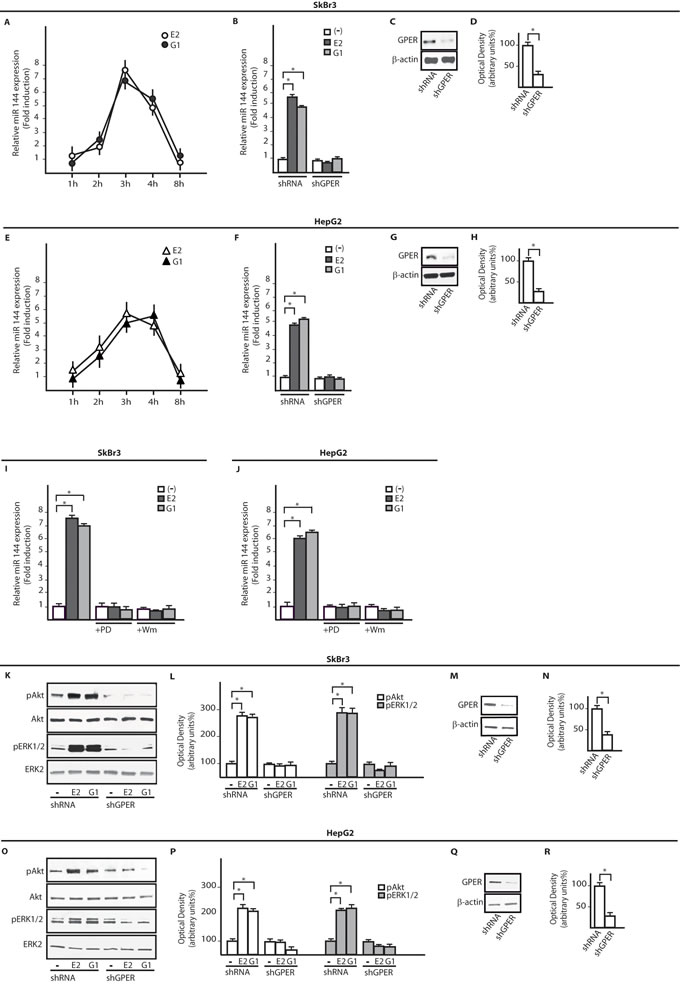
Figure 1: E2 and G-1 up-regulate miR144 expression through GPER and the PI3K-Akt/ERK1/2 transduction pathways. miR144 expression in SkBr3 A. and HepG2 cells E. upon stimulation with 100nM E2 and 100nM G-1, as indicated. Each point is plotted as fold changes of cells receiving treatments respect to cells treated with vehicle and represents the mean ± SD of three independent experiments performed in triplicate. miR144 levels upon a 3h treatment with 100nM E2 and 100nM G-1 in SkBr3 B. and HepG2 F. cells transfected with shRNA or shGPER. Each column represents the mean ± SD of three independent experiments performed in triplicate. Efficacy of GPER protein silencing in SkBr3 C., D. and HepG2 G., H. cells as determined by densitometric analysis of GPER expression normalized to β-actin levels. miR144 levels in SkBr3 I. and HepG2 J. cells treated for 3h with 100nM E2 and 100nM G-1 alone and in presence of 1µM PD98059 (PD) or 1µM Wortmannin (Wm). Each column represents the mean ± SD of three independent experiments performed in triplicate. Akt and ERK1/2 phosphorylation in SkBr3 K. and HepG2 O. cells transfected with shRNA or shGPER and treated for 5 min with 100nM E2 and 100nM G-1. Densitometric analysis of pAkt and pERK1/2 expression normalized to Akt and ERK2 levels, respectively in SkBr3 L. and HepG2 P. cells. Efficacy of GPER silencing in SkBr3 M., N. and HepG2 Q., R. cells as determined by densitometric analysis of GPER expression normalized to β-actin levels. *, p < 0.05, for cells receiving treatments vs cells treated with vehicle (-).
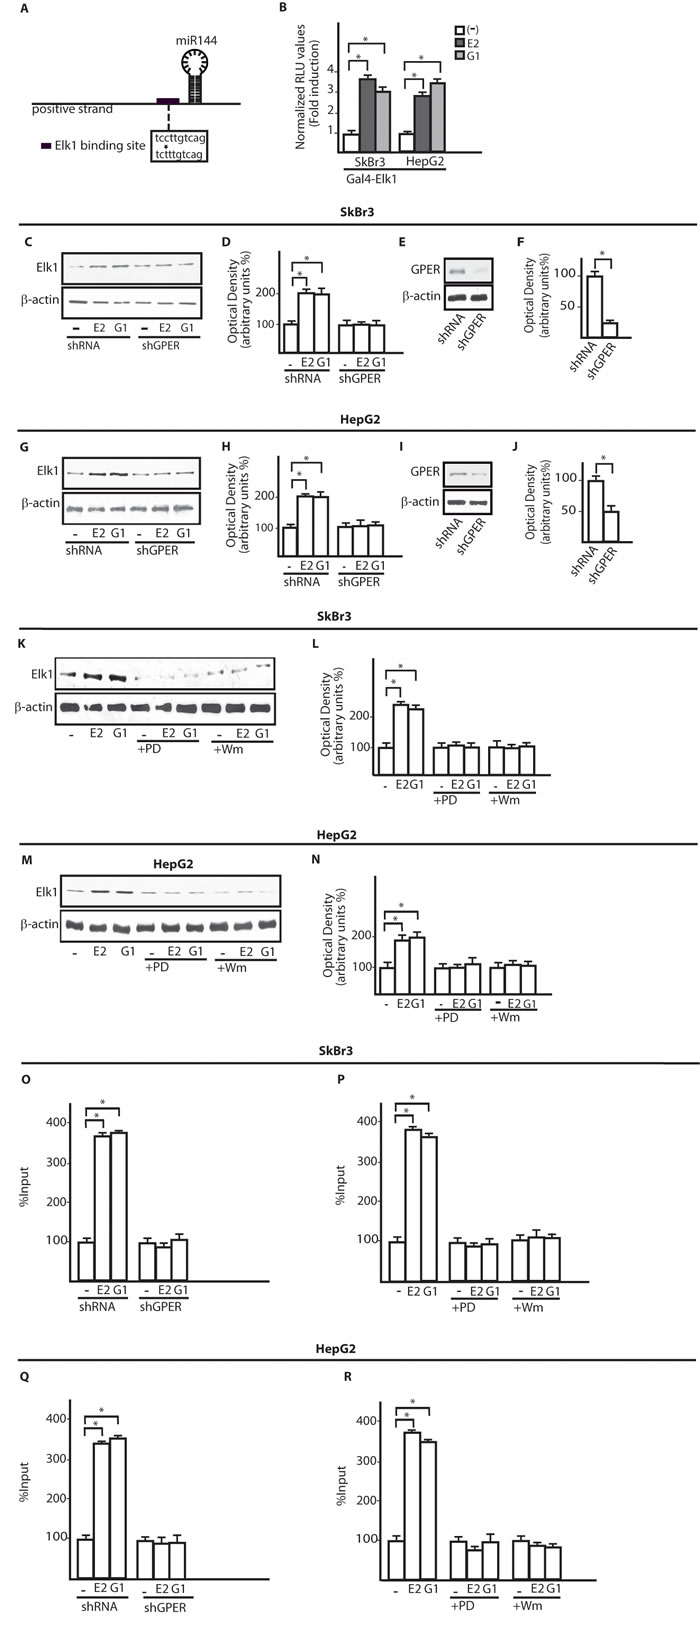
Figure 2: The transcription factor Elk1 is involved in the up-regulation of miR144 by E2 and G-1. A. Schematic representation of a putative Elk1 binding site located within the miR144 promoter region. B. Luciferase activity in SkBr3 and HepG2 cells transfected with a Gal4-reporter plasmid along with the expression vector Gal4-Elk1 and then treated for 18h with 100nM E2 and 100nM G-1. Each column represents the mean ± SD of three independent experiments performed in triplicate. Elk1 protein levels in SkBr3 C. and HepG2 G. cells transfected with shRNA or shGPER and treated for 2h with 100nM E2 and 100nM G-1. Densitometric analysis of Elk1 expression normalized to β-actin levels in SkBr3 D. and HepG2 H. cells. Efficacy of GPER silencing in SkBr3 E., F. and HepG2 cells. I., J. as determined by densitometric analysis of GPER expression normalized to β-actin levels. Elk1 protein levels in SkBr3 K. and HepG2 M. cells treated for 2h with 100nM E2 and 100nM G-1 alone or in the presence of 1µM PD98059 (PD) and 1µM Wortmannin (Wm). Densitometric analysis of Elk1 expression normalized to β-actin levels in SkBr3 L. and HepG2 N. cells. Recruitment of Elk1 to the miR144 promoter sequence in SkBr3 O. and HepG2 Q. cells transfected with shRNA or shGPER and treated for 2h with 100nM E2 and 100nM G-1. Recruitment of Elk1 to the miR144 promoter sequence in SkBr3 P. and HepG2 R. cells treated for 2h with 100nM E2 and 100nM G-1 alone and in the presence of 1µM PD98059 (PD) or 1µM Wortmannin (Wm). Each column represents the mean ± SD of three independent experiments performed in triplicate. *, p < 0.05, for cells receiving treatments vs cells treated with vehicle (-).
miR144 regulates the onco-suppressor Runx1
Using available bioinformatics algorithms (http://www.microrna.org; http://www.miRNAbase.org; http://www.targetscan.org), we determined that miR144 may regulate Runx1 on the basis of the putative target sequences located within the 3’-UTR Runx1 region (Figure 3A). A further bioinformatic analysis (http://ecrbrowser.dcode.org) revealed that the putative MiRNA Responsive Elements (MREs) to miR144 located within the 3’-UTR Runx1 sequence are conserved in Vertebrates (Supplementary Tab. 1). Taking into account the aforementioned data, we transfected SkBr3 and HepG2 cells with a miR144 mimic sequence which triggered a decrease of Runx1 protein levels (Figure 3B-3E). Thereafter, we analyzed the Runx1 mRNA expression in SkBr3 and HepG2 cells upon treatment with 100nM E2 and 100nM G-1, as these ligands induce the up-regulation of miR144. Interestingly, the mRNA expression of Runx1 decreased in a time-dependent manner (Figure 3F, 3J), however this response was no longer evident silencing GPER (Figure 3G-3I and Figure 3K-3M). Further confirming these results, the Runx1 protein levels were lowered treating SkBr3 and HepG2 cells for 3h with 100nM E2 and 100nM G-1 (Figure 4A, 4B and 4E, 4F). Worthy, the decrease of Runx1 protein was prevented transfecting cells with the shGPER construct, but not co-transfecting the miR144 mimic sequence (Figure 4A-4H). Biologically, the treatment for 24h with 100nM E2 induced in SkBr3 and HepG2 the progression of cell cycle (Figure 5A, 5B), however this response was abolished silencing GPER or transfecting cells with an expression vector of Runx1 (pRunx1) (Figure 5A, 5B). Taken together, our results suggest that in SkBr3 and HepG2 cancer cells E2 and G-1 through GPER induce miR144 expression which negatively regulates the levels of its target gene Runx1.
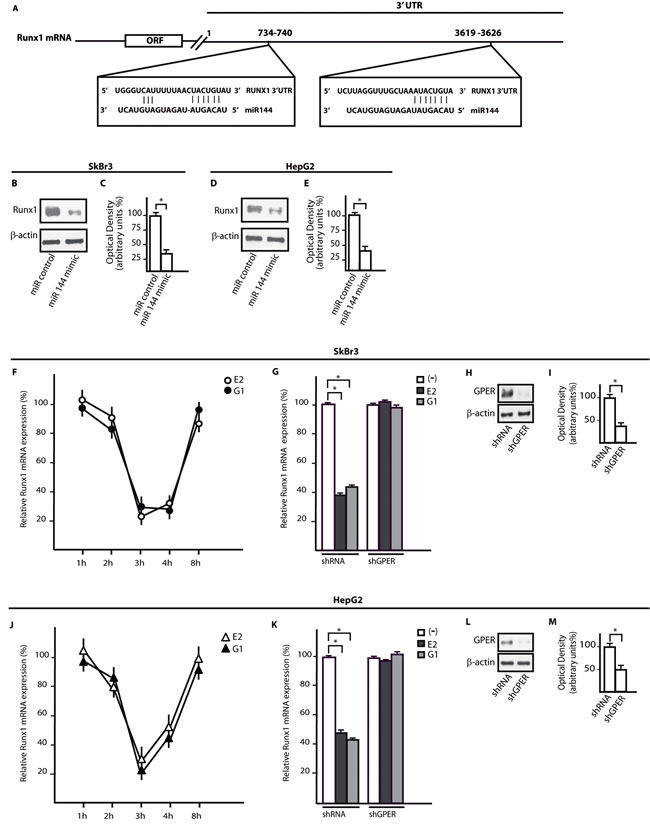
Figure 3: Runx1 is a target gene of mir144 and its expression is down-regulated by E2 and G-1 through GPER. A. Alignment between the miR144 sequence and the 3’-UTR mRNA region of Runx1. Runx1 protein levels in SkBr3 B. and HepG2 D. cells transfected with a mimic miR144 sequence. Densitometric analysis of the Runx1 expression normalized to β-actin levels in SkBr3 C. and HepG2 E. cells. The mRNA levels of Runx1 are down-regulated in SkBr3 F. and HepG2 J. cells treated with 100nM E2 and 100nM G-1, as indicated. Each point is plotted as fold changes of cells receiving treatments respect to cells treated with vehicle and represents the mean ± SD of three independent experiments performed in triplicate. Runx1 mRNA expression in SkBr3 G. and HepG2 K. cells transfected with shRNA or shGPER and treated for 3h with 100 nM E2 and 100nM G-1. Each column represents the mean ± SD of three independent experiments performed in triplicate. Efficacy of GPER silencing in SkBr3 H., I. and HepG2 L., M. cells as determined by densitometric analysis of GPER expression normalized to β-actin levels. *, p < 0.05, for cells receiving treatments vs cells treated with vehicle (-).
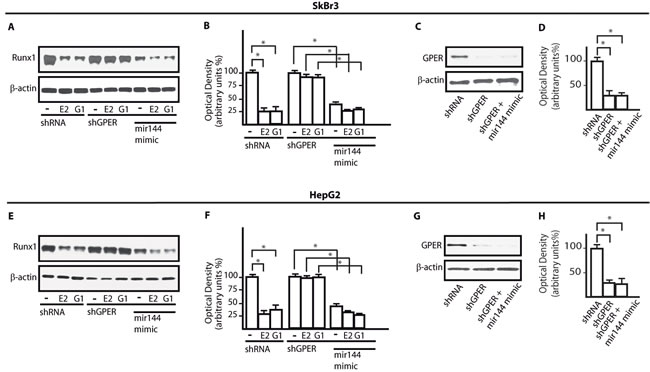
Figure 4: GPER and miR144 are involved in the down-regulation of Runx1 protein expression induced by E2 and G-1. Runx1 protein expression in SkBr3 A. and HepG2 E. cells transfected with shRNA, shGPER alone and in combination with a mimic miR144 sequence and treated for 3h with 100nM E2 and 100nM G-1. Densitometric analysis of the Runx1 expression normalized to β-actin levels in SkBr3 B. and HepG2 F. cells. Efficacy of GPER silencing in SkBr3 C., D. and HepG2 G., H. cells as determined by densitometric analysis of GPER expression normalized to β-actin levels. *, p < 0.05, for cells receiving treatments vs cells treated with vehicle (-).
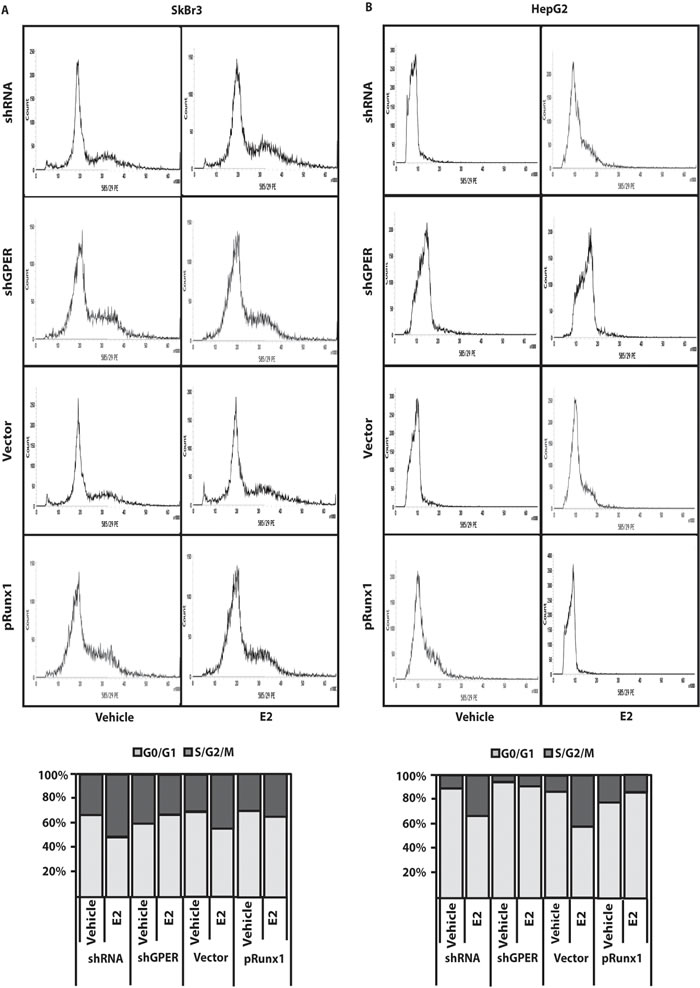
Figure 5: GPER silencing and Runx1 over-expression prevent cell-cycle progression induced by E2. Cell cycle analysis in SkBr3 A. and HepG2 B. cells transfected for 24h with shRNA, shGPER and plasmids encoding for a vector or Runx1 (pRunx1), then treated for 24h with 100nM E2. The histograms show the percentage of cells in G0/G1 and S/G2/M phases of the cell cycle. Values represent the mean ± SD of three independent experiments.
E2 and G-1 through GPER up-regulate miR144 expression which lowers the levels of Runx1 in CAFs
Considering the relevant contribution of the microenvironment to cancer cell growth and invasiveness [34], we examined the regulation of miR144 and Runx1 expression in CAFs, which are key components of the tumor microenvironment. We found that the treatments with 100nM E2 and 100nM G-1 increase miR144 expression (Figure 6A), however this response was prevented silencing GPER expression (Figure 6B-6D). Worthy, the down-regulation of Runx1 mRNA and protein levels observed in CAFs treated whit 100nM E2 and 100nM G-1 was no longer evident knocking down GPER or transfecting the miR144 mimic sequence (Figure 6E-6L). Altogether, these results indicate that GPER mediates the regulation of miR144 and Runx1 by E2 and G-1 also in CAFs, which play relevant stimulatory effects through a functional interaction with cancer cells [34].
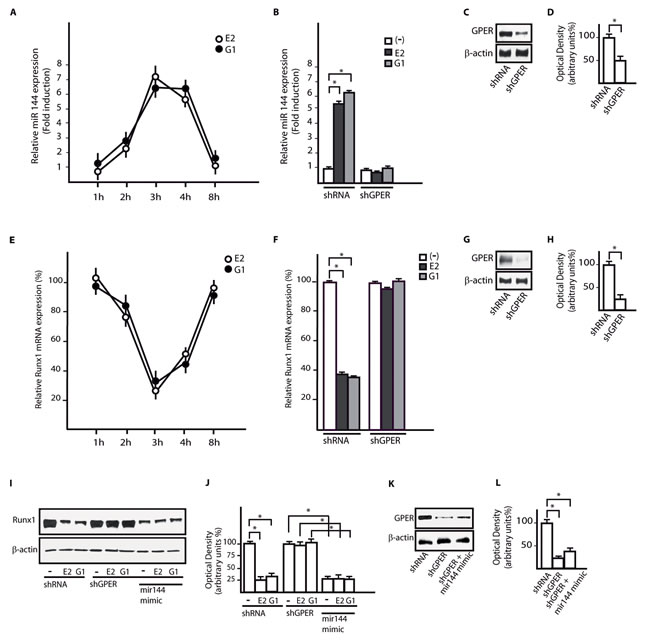
Figure 6: GPER mediates the up-regulation of miR144 and the reduction of Runx1 induced by E2 and G-1 in CAFs. A. miR144 expression in CAFs upon stimulation with 100nM E2 and 100nM G-1, as indicated. Each point is plotted as fold changes of cells receiving treatments respect to cells treated with vehicle and represents the mean ± SD of three independent experiments performed in triplicate. B. miR144 expression in CAFs transfected with a shRNA or shGPER and treated for 3h with 100nM E2 and 100nM G-1. Each column represents the mean ± SD of three independent experiments performed in triplicate. C., D. Efficacy of GPER silencing in CAFs as determined by densitometric analysis of GPER expression normalized to β-actin levels. E. Runx1 mRNA expression in CAFs upon treatment with 100nM E2 and 100nM G-1, as indicated. Each point is plotted as fold changes of cells receiving treatments respect to cells treated with vehicle and represents the mean ± SD of three independent experiments performed in triplicate. F. Runx1 mRNA expression in CAFs transfected with shRNA or shGPER and treated for 3h with 100nM E2 and 100nM G-1. Each column represents the mean ± SD of three independent experiments performed in triplicate. G., H. Efficacy of GPER silencing in CAFs as determined by densitometric analysis of GPER expression normalized to β-actin levels. I. Runx1 protein expression in CAFs transfected with shRNA, shGPER alone and in combination with a mimic miR144 sequence, then treated for 3h with 100nM E2 and 100nM G-1. J. Densitometric analysis of Runx1 protein expression normalized to β-actin levels. K., L. Efficacy of GPER silencing in CAFs as determined by densitometric analysis of GPER expression normalized to β-actin levels. *, p < 0.05, for cells receiving treatments vs cells treated with vehicle (-).
G-1 down-regulates the expression of Runx1 in vivo
In order to further evaluate the aforementioned response of Runx1 upon ligand activation of GPER, we turned to an in vivo experimental model. Hence, SkBr3 cells were injected into the intrascapular region of female nude mice and tumor growth was monitored upon the administration of vehicle or 0.5mg/kg/die G-1. This treatment was well tolerated because no change in body weight or in food and water consumption was observed, along with no evidence of reduced motor function. In addition, after sacrifice no significant differences in the mean weights or histological features of major organs (for instance liver, lung, spleen and kidney) were observed between vehicle-treated mice and those receiving the treatment, indicating a lack of toxic effects at the given dose. A significant increase in tumor volume was observed starting from 30 days of treatment with G-1 (Figure 7A) and after 40 days the mice were sacrificed (a representative tumor is shown in Figure 7B). Histological examination of SkBr3 xenografts by hematoxylin and eosin staining revealed that samples were mostly composed of tumor epithelial cells (Figure 7C). In tumor homogenates obtained from G-1 stimulated mice we detected an increased expression of the proliferative marker Ki67 respect to mice treated with vehicle (Supplementary Figure 2). In addition, in tumor homogenates from G-1 treated mice we found a decrease of Runx1 protein expression respect to vehicle treated mice (Figure 7D, 7E). Culturing SkBr3 cells obtained from tumor xenografts, we further confirmed the down-regulation of Runx1 protein expression upon treatment with 100nM G-1 for 3h (Figure 7F, 7G). Altogether, these data suggest that G-1 stimulates the growth of SkBr3 tumor xenografts and reduces Runx1 protein expression also in vivo.
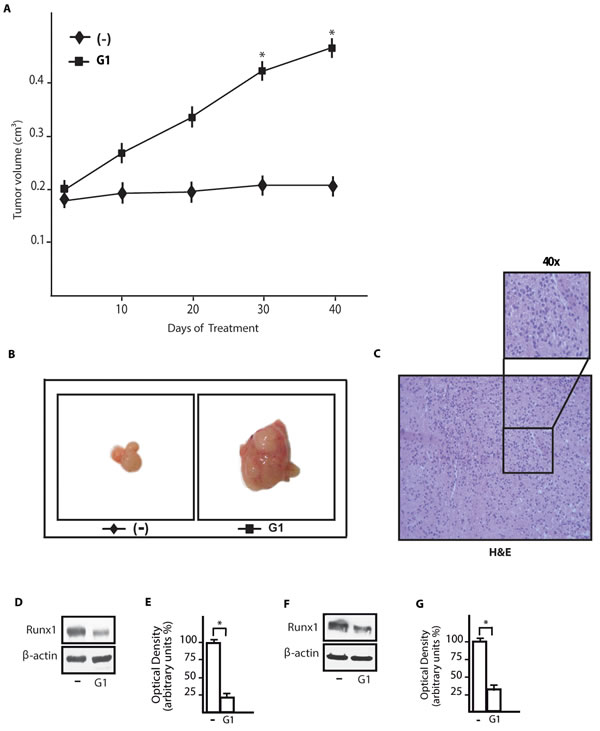
Figure 7: G-1 down-regulates Runx1 expression in tumor xenografts. A. Tumor volume from SkBr3 xenografts implanted in female athymic nude mice treated for 40 days with vehicle (-) and G-1 (0,5 mg/Kg/die), as indicated. *, p < 0.05, for animals treated with G-1 vs animals treated with vehicle. B. Representative images of SkBr3 xenograft tumors at 40 days, scale bar: 0.3 cm. C. Representative tumor section from mice at 40 days, formalin fixed, paraffin embedded, sectioned and stained with hematoxylin and eosin Y (H&E). D. Runx1 protein expression in tumor homogenates from SkBr3 xenografts treated as described in A.. E. Densitometric analysis of Runx1 protein expression normalized to β-actin levels. F. Runx1 protein expression in cultured SkBr3 cells obtained from tumor xenografts and treated for 3h with 100nM G-1. G. Densitometric analysis of Runx1 protein expression normalized to β-actin levels. * p < 0.05, for cells receiving treatments vs cells treated with vehicle (-).
DISCUSSION
In the present study, we show that in SkBr3 breast cancer and HepG2 hepatocarcinoma cells E2 and G-1 induce the expression of miR144 and down-regulate the levels of Runx1 through GPER and the involvement of the PI3K/ERK1/2/Elk1 transduction pathway. Moreover, we demonstrate that E2 and G-1 modulate the expression of miR144 and Runx1 also in main components of the tumor microenvironment like CAFs. Biologically, the increase in S/G2/M phases of the cell cycle upon exposure to E2 was no longer evident silencing GPER or overexpressing Runx1. Worthy, G-1 triggered in vivo tumor growth and decreased Runx1 expression in SkBr3 xenografts. Altogether, our findings provide new insights into the potential of estrogenic GPER signalling to mediate cancer progression through the involvement of miR144 and Runx1 in both cancer cells and CAFs. In this regard, our data highlight additional mechanisms by which tumor cells and the microenvironment cooperate toward worse cancer features.
Numerous studies have suggested in the last years that every cellular process is likely regulated by miRNAs and an aberrant miRNA expression may be a hallmark of several diseases, including cancer (4). However, it remains to be fully elucidated the expression and function of various miRNAs in the different types of tumors. For instance, there is a growing interest on the role of miR144 in tumorigenesis and cancer therapy. Previous studies have reported a down-regulation of miR144 in malignancies like osteosarcoma and mesothelioma, suggesting that miR144 might be considered as a potential tumor suppressor [35, 36]. An inverse correlation between the levels of miR144 and the development of gastric and pancreatic cancers has been also reported [37]. However, other investigations have demonstrated an increase of miR144 levels in colorectal [38] and in nasopharyngeal carcinoma [20]. In addition, the inhibition of miR144 led to a decreased proliferation in HeLa cells [39]. In this context, our data indicate that estrogens induce miR144 expression, as previously observed in a different model system [23]. Besides, the present study demonstrates that the E2-stimulated miR144 expression may elicit oncogenic effects in SkBr3 and HepG2 cells, although a forced overexpression of miR144 has been reported to suppress proliferation, migration and invasion in hepatocellular carcinoma HCC cells [40]. These controversial results may rely on the different experimental conditions, including the cell types used and the action of the endogenous miR144 evaluated in our investigation. Anyway, these findings address the need to further ascertain the function exerted by miR144 in tumorigenesis and cancer progression.
In order to better understand the biological relevance of the increased miR144 expression upon exposure to E2 and G-1 in cells used, we identified the tumor suppressor Runx1 (known also as AML1) as a miR144 target gene through a bioinformatics analysis. Runx1 is a member of the mammalian Runx family encoding for the transcription factors Runx1, 2 and 3 that may function as tumor suppressors binding to specific DNA sequences namely PEBP2 sites (TGT/CGGT) [41]. Actually, Runx family members can also act as oncogenes, depending on diverse factors including the cellular context [42]. Runx1 is the predominant Runx family member expressed in breast epithelial cells as well as in the basal and the luminal cell layer [43]. Recurrent mutations of Runx1 have been detected in breast cancer, suggesting that aberrations in Runx-mediated cell differentiation may drive the development of this malignancy [44]. In addition, Runx1 expression was found less abundant in breast cancer cells compared to normal breast epithelial cells and its levels have been reported to decrease progressively with the tumor aggressiveness [45]. Experimental Ras-mediated transformation of basal-like MCF10A cells was associated with the loss of Runx1 [46] and the silencing of its expression in the same cells led to the formation of abnormal, hyperproliferative acinar structures in 3D cultures [47]. In accordance to previous studies suggesting a tumor-suppressor role of Runx1 [41], we found that the increased number of SkBr3 and HepG2 cells in S/G2/M phases upon exposure to E2 is no longer evident in cells overexpressing Runx1. Further confirming these results, the treatment with G-1 decreased the expression of Runx1 and induced growth effects in SkBr3 xenografts.
Estrogens can act through the classical ER and GPER in triggering important biological responses, including the progression of several types of tumors [24, 25]. Although the involvement of ERα in the regulation of miRNAs by estrogens has been well described [48], the possible role of GPER on the expression of miRNAs has been reported in a few studies [23, 49]. Thus, our results provide further insights into the potential of GPER to mediate the estrogenic regulation of miRNAs in cancer cells like SkBr3 and HepG2 as well as in CAFs that exert a stimulatory action within the tumor microenvironment. In particular, the present data indicate the potential of GPER to modulate miR144 and Runx1 expression upon estrogen exposure towards cancer progression. In addition, the GPER-mediated responses through miR144 and Runx1 in CAFs extend the current knowledge on the critical interactions between cancer cells and important components of the surrounding stroma toward tumor development and metastasis. Our results suggest also that the GPER/miR144/Runx1 signaling pathway may represent a further oncotarget to be considered in innovative therapeutic approaches in estrogen-sensitive tumors.
MATERIALs AND METHODS
Bioinformatic tools
The putative promoter sequences of primary miR144 and the 3’-UTR of Runx1 were retrieved from the National Center for Biotechnology Information (NCBI) (http://www.ncbi.nlm.nih.gov). Prediction of transcription factors for primary miR144 was performed using TRANSFAC (http://www.generegulation.com) site. miR144 targets genes were identified using miRanda (http://www.microrna.org/), miRNAbase (http://www.miRNAbase.org) and Targetscan (http://www.targetscan.org) sites. Sequences conservation was analyzed with the Evolutionary Conserved Region Browser (http://ecrbrowser.dcode.org).
Reagents
17β-estradiol (E2) was purchased from Sigma-Aldrich Corp. (Milan, Italy). MEK inhibitor PD98059 (PD) and PI3K inhibitor Wortmannin (Wm) were bought from Calbiochem (Milan, Italy). 1-[4-(-6-bromobenzol[1,3]diodo-5yl)-3a,4,5,9b-tetrahidro3H-cyclopenta[c]quinolin-8yl]-ethanone (G-1) was obtained from Biomol Reaserch Laboratories, Inc. (DBA, Milan, Italy). All compounds were solubilized in DMSO, except E2, which was dissolved in ethanol.
Cell cultures
SkBr3 and MCF-7 breast cancer, HepG2 hepatocarcinoma and LNCaP prostate cancer cells were obtained by ATCC (Manassas, USA) and used less than six months after revival. SkBr3 and LNCaP were maintained in RPMI-1640 without phenol red, MCF-7 and HepG2 cells were maintained in DMEM medium, with a supplement of 10% fetal bovine serum (FBS) and 100 μg/ml of penicillin/streptomycin (Gibco, Life Technologies, Milan, Italy). CAFs were extracted from breast cancer tissues as previously described [50]. Signed informed consent from all the patients was obtained and all samples were collected, identified and used in accordance with approval by the Institutional Ethical Committee Board (Regional Hospital of Cosenza, Italy). CAFs were cultured in a mixture of MEDIUM 199 and HAM’S F-12 (1:1) supplemented with 10% FBS and 100 μg/ml of penicillin/streptomycin (Gibco, Life Technologies, Milan, Italy). All cells were switched to medium without serum the day before experimental analysis.
Plasmid and transfections
Short hairpin construct against human GPER (shGPER) and short hairpin scrambled (shRNA) were obtained and used as previously described [51]. In brief, they were generated in the lentiviral expression vector pLKO.1 purchased by Euroclone (Milan, Italy). The targeting strand generated from the shGPER construct was 5’-CGCTCCCTGCAAGCAGTCTTT-3’. The efficacy of GPER silencing was determined by real-time PCR (data not shown) and immunoblotting (see results section). The expression vector Gal4-Elk1 and the reporter plasmid Gal4-Luc were obtained as indicated previously [52]. The mimic miR144 and negative control (NC) sequences were purchased from Ambion (Life Technologies, Milan, Italy). Addgene plasmid 12426: pCMV5-AML1B/Runx1 (pRunx1) (Addgene, Cambridge, MA, USA), used for Runx1 overexpression, was obtained from Dr. Scott Hiebert [53]. Transfection assays were performed using the X-tremeGene9 Transfection Reagent (Roche Diagnostics, Milan, Italy) according to the manufacturer’s instructions.
RNA extraction and real time-PCR
Cells were maintained in regular growth medium and then switched to medium lacking serum for 24h, before to add 100nM E2 and 100nM G-1 for the times indicated. miRNAs and the RNA fraction deprived of small RNA were extracted from cultured cells using miRVana Isolation Kit (Ambion, Life Technologies, Milan, Italy) according to the manufacturer’s recommendations. The RNA concentrations were determined with Gene5 2.01 Software in Synergy H1 Hybrid Multi-Mode Microplate Reader (BioTek, AHSI, Milan Italy). cDNA was synthesized from 5ng of total miRNA using the TaqMan microRNA Reverse Transcription Kit (Applied Biosystems, Life Technologies, Milan, Italy) and the expression levels of miR144 were quantified by TaqMan microRNA Assay Kit (Applied Biosystems, Life Technologies, Milan, Italy). Real-time PCR analysis for mature miR144 was performed using the primers for the internal control RNU6B 5’ - TGACACGCAAATTCGTGAAGCGTTCCATATTTTT - 3’ (forward) and miR144 5’-UACAGUAUAGAUGAUGUACU-3’ (forward). In order to measure the mRNA levels of Runx1, 2 µg of RNA fraction deprived of small RNA were reversely transcribed using the murine leukaemia virus reverse transcriptase (Life Technologies, Milan, Italy), following the protocol provided by the manufacturer. The quantitative PCR was performed using SYBR Green PCR Master Mix (Applied Biosystems, Life Technologies, Milan, Italy). Specific primers for Actin, which was used as internal control, ERα, ERβ, GPER and Runx1 genes were designed using Primer Express version 2.0 software (Applied Biosystems Inc, Milano, Italy). The sequences were as follows: Actin Fwd: 5’-AAGCCACCCCACTTCTCTCTAA-3’ and Rev: 5’-CACCTCCCCTGTGTGGACTT-3’ (reverse); ERα Fwd: 5’-AGAGGGCATGGTGGAGATCTT-3’ and Rev: 5’-CAAACTCCTCTCCCTGCAGATT-3’; ERβ Fwd: 5’-GACCACAAGCCCAAATGTGTT-3’ and Rev: 5’-ACTGGCGATGGACCACTAAA-3’; GPER Fwd: 5’-ACACACCTGGGTGGACACAA-3’ and Rev: 5’-GGAGCCAGAAGCCACATCTG-3’; Runx1 Fwd: 5’-GCTGGAAAGCAAACAGGAAGA-3’ and Rev: 5’-CAGCATTGCTAAATCAGAAGCATT-3’. All experiments were performed in triplicate using StepOneTM Real-Time PCR Detection System (Applied Biosystems, Life Technologies, Milan, Italy). The data were normalized to the geometric mean of housekeeping gene to control the variability into expression levels and fold changes were calculated by relative quantification.
Western blotting
Tumor homogenates, obtained from nude mice were processed as previous described [27]. Cells were maintained in medium without serum for 24h, exposed to ligands as indicated and then lysed in RIPA buffer containing a mixture of protease inhibitors. Equal amounts of protein extract were resolved on SDS-polyacrylamide gel, transferred to a nitrocellulose membrane (Amersham Biosciences, Italy), probed overnight at 4°C with antibodies against phosphorylated ERK1/2 (E-4), ERK2 (C-14), phosphorylated Akt 1/2/3 (ser 473), Akt (H-136), Elk1 (E-5), Runx1 (A-2), GPER (N-15), β-Actin (AC-15), Ki67 (H-300) ERα (F-10) (Santa Cruz Biotechnology, DBA, Italy) and ERβ (Serotec), and then revealed using the ECLTM Western Blotting Analysis System (GE Healthcare, Italy).
Luciferase assays
Cells were plated in regular growth medium and transferred in that without serum on the day of transfection using a mixture containing Gal4-Luc (500ng/well), Gal4-Elk1 (100ng/well) and pRL-TK (10ng/well). After 6h, cells were treated whit 100nM E2 and 100nM G-1 before to incubate for 18h. Luciferase activity was measured with the Dual Luciferase kit (Promega, Italy) according to the manufacturer’s instructions. Firefly luciferase values were normalized to the internal transfection control provided by the Renilla luciferase activity. The normalized relative light unit (RLU) values obtained from cells stimulated with vehicle (-) were set as 1-fold induction upon which the activity induced by treatments was calculated.
Chromatin immunoprecipitation (ChIP) assays
The day before ChIP analysis, cells were shifted to medium lacking serum and then transfected for 48h with 5 µg of the indicated constructs or pre-treated for 30min with the inhibitors PD and WM. Next, the cells were stimulated for 2h with 100nM E2 and 100nM G-1. ChIP assay was performed as previously described [28]. In brief, the immune cleared chromatin was immunoprecipitated with anti Elk1 or normal mouse serum IgG (Santa Cruz Biotecnology, DBA), used as negative control. A 4µl volume of each sample and input DNA were used as template to amplify, by real-time PCR (Applied Biosystems, Italy), a region containing an Elk1 site located within the positive strand of miR144 promoter. The primer sequences were: 5’-TGCCCTGGCAGTCAGTAGGT-3’ (forward) and 5’-ACAGTGCTTTTCAAGCCATG-3’ (reverse). The data were normalized with respect to input. The relative antibody-bound fractions were normalized to a calibrator that was chosen to be the sample treated with vehicle (-).
Cell cycle analysis
To analyse cell cycle distribution, cells were cultured in regular medium in 6 well plates and shifted in medium containing 2.5% charcoal-stripped FBS when cells were 70% confluents. Next, 5 µg of shRNA or shGPER or pRunx1 were added to cells using X-treamGene9 reagent (Roche Diagnostics, Milan, Italy). After 24h, 100nM E2 were put in the medium for additional 24h. Cells were pelleted, once washed with phosphate buffered saline and fixed in 50% methanol overnight at –20°C, before to stain with a solution containing 50 µg/ml propidium iodide in 1xPBS (PI), 20U/ml RNAse-A and 0.1% Triton (Sigma-Aldrich, Milan, Italy). Cells were analyzed for DNA content by Fluorescence-Activated Cell Sorting (FACS Jazz, BD, Milan, Italy). The proportion of the cells in G0/G1 and S/G2-M phases was estimated each as a percentage of the total events (10,000 cells).
In vivo studies
Animal care, death, and experiments were done in accordance with the U.S. National Institutes of Health Guide for the Care and Use of Laboratory Animals (NIH Publication No. 85-23, revised 1996) and in accordance with the Italian law (DL 116, January 27, 1992). The project was approved by the local ethical committee. Female 45-day-old athymic nude mice (nu/nu Swiss; Harlan Laboratories) were maintained in a sterile environment. At day 0, 8.0 × 10⁶ per mouse of SkBr3 cells exponentially growing, were inoculated subcutaneously in 100μl of Matrigel (Cultrex; Trevigen Inc.). After about 1 week, when the tumors reached average ~0.15 cm3, mice were randomized and divided into two groups, which was then treated by intramuscular injection for 40 days in according to treatments used. The first group of mice (n = 7) was treated daily with 100μl of vehicle (0.9% NaCl with 0.1% albumin and 0.1% Tween-20; Sigma-Aldrich), whereas the second group of mice (n = 7) was treated with 100μl G-1 (0.5 mg/kg/die). G-1 was dissolved in DMSO at 1 mg/ml. For treatments, 6.2 μl of G-1 were added to 93.8μl of vehicle. SkBr3 xenograft tumors were measured using digital vernier calipers and tumor volume calculated using the formula [sagittal dimension (mm) x cross dimension (mm)] 2/2, expressed in cm3. At day 40, all animals were sacrificed following the standard protocols and tumors were dissected from the neighboring connective tissue. Specimens of tumors were frozen in nitrogen and stored at −80°C, the remaining tumor tissues of each sample were fixed in 4% paraformaldehyde and embedded in paraffin for the histologic analyses.
Histologic analysis
Morphologic analyses were carried out on formalin-fixed, paraffin-embedded sections of tumor xenografts, which were cut at 5μm and allowed to air dry. Deparaffinized, rehydrated sections were stained for 6 min with hematoxylin (Bio-Optica, Milan, Italy), washed in running tap water and counterstained with eosin Y (Bio-Optica, Milan, Italy). Sections were then dehydrated, cleared with xylene, and mounted with resinous mounting medium. Tumor sections were also immunolabeled with Ki67, considered as a cell proliferation marker.
Statistical analysis
Statistical analysis was performed using ANOVA followed by Newman-Keuls’ testing to determine differences in means. p < 0.05 was considered as statistically significant. Statistical comparisons for in vivo studies were obtained using the Wilcoxon-Mann-Whitney test. p < 0.05 was considered statistically significant.
ACKNOWLEDGMENTS
This work was supported by Associazione Italiana per la Ricerca sul Cancro (AIRC, MM: IG grant n. 12849/2012), PON01_01078 and Ministero della Salute grant n. 67/GR-2010-2319511.
CONFLICTS OF INTEREST
The authors declare no conflict of interest.
REFERENCES
1. Zamore PD, Haley B. Genetics. Ribo-gnome: the big world of small RNAs. Science. 2005; 309: 1519-1524.
2. Vasudevan S, Tong Y, Steitz JA. Switching from repression to activation: microRNAs can up-regulate translation. Science. 2007; 318:1931-1934.
3. Bartel DP. MicroRNAs: target recognition and regulatory functions. Cell. 2009; 136: 215-233.
4. Iorio MV, Croce CM. MicroRNAs in Cancer: Small Molecules With a Huge Impact. J Clin Oncol. 2009; 27: 5848-5856.
5. Ell B, Kang Y. MicroRNAs as regulators of tumor-associated stromal cells. Oncotarget. 2013; 4: 2166-2167.
6. Ben-Hamo R, Efroni S. MicroRNA regulation of molecular pathways as a generic mechanism and as a core disease phenotype. Oncotarget. 2015; 6:1594-1604.
7. Mendell JT, Olson EN. MicroRNAs in stress signaling and human disease. Cell. 2012; 148: 1172–1187.
8. Smigal C, Jemal A, Ward E, Cokkinides V, Smith R, Howe HL and Thun M. Trends in breast cancer by race and ethnicity: update 2006. CA Cancer J Clin. 2006; 56: 168-183.
9. Iorio MV, Ferracn M, Liu CG, Veronese A, Spizzo R, Sabbioni S, Magri E, Pedriali M, Fabbri M, Campiglio M, Ménard S, Palazzo JP, Rosenberg A, et al. MicroRNA gene expression deregulation in human breast cancer. Cancer Res. 2005; 65:7065-7070.
10. Yan LX, Huang XF, Shao Q, Huang MY, Deng L, Wu QL, Zeng YX, Shao JY. MicroRNA miRNA-21 overexpression in human breast cancer is associated with advanced clinical stage, lymph node metastasis and patient poor prognosis. RNA 2008; 14: 2348-2360.
11. Iorio MV, Casalini P, Piovan C, Di Leva G, Merlo A, Triulzi T, Ménard S, Croce CM, Tagliabue E. MicroRNA-205 regulates HER3 in human breast cancer. Cancer Res. 2009; 69: 2195-2200.
12. Miller TE, Ghoshal K, Ramaswamy B, Roy S, Datta J, Shapiro CL, Jacob S, Majumder S. MicroRNA-221/222 confers tamoxifen resistance in breast cancer by targeting p27Kip1. J Biol Chem. 2008; 283:29897-29903.
13. Zhao JJ, Lin J, Yang H, Kong W, He L, Ma X, Coppola D, Cheng J.Q. MicroRNA-221/222 negatively regulates estrogen receptor alpha and is associated with tamoxifen resistance in breast cancer. J Biol Chem. 2008; 283: 31079-31086.
14. Di Leva GL, Piovan C, Gasparini P, Ngankeu A, Taccioli C, Briskin D, Cheung DG, Bolon B, Anderlucci L, Alder H, Nuovo G, Li M, Iorio MV et al. Estrogen mediated-activation of miRNA-191/425 cluster modulates tumorigenicity of breast cancer cells depending on estrogen receptor status. PLoS Genet. 2013; 9: e1003311.
15. Murakami Y, Yasuda T, Saigo K, Urashima T, Toyoda H, Okanoue T, Shimotohno K. Comprehensive analysis of microRNA expression patterns in hepatocellular carcinoma and non-tumorous tissues. Oncogene. 2006; 25: 2537-2545.
16. Li Y, Xu D, Bao C, Zhang Y, Chen D, Zhao F, Ding J, Liang L, Wang Q, Liu L, Li J, Yao M, Huang S, et al. MicroRNA-135b, a HSF1 target, promotes tumor invasion and metastasis by regulating RECK and EVI5 in hepatocellular carcinoma. Oncotarget. 2014; 6:2421-433.
17. Li W, Xie L, He X, Li J, Tu K, Wei L, Wu J, Guo Y, Ma X, Zhang P, Pan Z, Hu X, Zhao Y et al. Diagnostic and prognostic implications of microRNAs in human hepatocellular carcinoma. Int J Cancer. 2008; 123:1616-1622.
18. Altuvia Y, Landgraf P, Lithwick G, Elefant N, Pfeffer S, Aravin A, Brownstein MJ, Tuschl T, Margalit H. Clustering and conservation patterns of human microRNAs. Nucleic Acids Res. 2005; 33: 2697-2706.
19. Rasmussen KD, Simmini S, Abreu-Goodger C, Bartonicek N, Di Giacomo M, Bilbao-Cortes D, Horos R, Von Lindern M, Enright AJ, O’Carroll D. The miRNA-144/451 locus is required for erythroid homeostasis. J Exp Med. 2010; 207: 1351–1358.
20. Zhang LY, Ho-Fun Lee V, Wong AM, Kwong DL, Zhu YH, Dong SS, Kong KL, Chen J, Tsao SW, Guan XY, Fu L. MicroRNA-144 promotes cell proliferation, migration and invasion in nasopharyngeal carcinoma through repression of PTEN. Carcinogenesis. 2013; 34: 454-463.
21. Iwaya T, Yokobori T, Nishida N, Kogo R, Sudo T, Tanaka F, Shibata K, Sawada G, Takahashi Y, Ishibashi M, Wakabayashi G, Mori M, Mimori K. Downregulation of miRNA-144 is associated with colorectal cancer progression via activation of mTOR signaling pathway. Carcinogenesis. 2012; 33: 2391–2397.
22. Cheng C, Li W, Zhang Z, Yoshimura S, Hao Q, Zhang C, Wang Z. MicroRNA-144 is regulated by activator protein-1 (AP-1) and decreases expression of Alzheimer disease-related a disintegrin and metalloprotease 10 (ADAM10). J Biol Chem. 2013; 288: 13748-13761.
23. Jacovetti C, Abderrahmani A, Parnaud G, Jonas JC, Peyot ML, Cornu M, Laybutt R, Meugnier E, Rome S, Thorens B, Prentki M, Bosco D, Regazzi R. MicroRNAs contribute to compensatory β cell expansion during pregnancy and obesity. J Clin Invest. 2012; 122: 3541-3551.
24. Burns KA, Korach KS. Estrogen receptors and human disease: an update. Arch Toxicol. 2012; 86: 1491-1504.
25. Prossnitz ER, Barton M. Estrogen biology: new insights into GPER function and clinical opportunities. Mol Cell Endocrinol. 2014; 389: 71-83.
26. Filardo EJ, Thomas P. Minireview: G protein-coupled estrogen receptor-1, GPER-1: its mechanism of action and role in female reproductive cancer, renal and vascular physiology. Endocrinology. 2012; 153: 2953-2962.
27. De Francesco EM, Pellegrino M, Santolla MF, Lappano R, Ricchio E, Abonante S, Maggiolini M. GPER Mediates Activation of HIF1α/VEGF Signaling by Estrogens. Cancer Res. 2014; 74: 4053-4064.
28. Vivacqua A, Romeo E, De Marco P, De Francesco EM, Abonante S, Maggiolini M. GPER mediates the Egr-1 expression induced by 17β-estradiol and 4-hydroxitamoxifen in breast and endometrial cancer cells. Breast Cancer Res Treat. 2012; 133:1025-35.
29. Santolla MF, Lappano R, De Marco P, Pupo M, Vivacqua A, Sisci D, Abonante S, Iacopetta D, Cappello AR, Dolce V, Maggiolini M. G protein-coupled estrogen receptor mediates the up-regulation of fatty acid synthase induced by 17β-estradiol in cancer cells and cancer-associated fibroblasts. J Biol Chem. 2012; 287: 43234-43245.
30. Albanito L, Madeo A, Lappano R, Vivacqua A, Rago V, Carpino A, Oprea TI, Prossnitz ER, Musti AM, Andò S, Maggiolini M. G protein-coupled receptor 30 (GPR30) mediates gene expression changes and growth response to 17beta-estradiol and selective GPR30 ligand G-1 in ovarian cancer cells. Cancer Res. 2007; 67: 1859-1866.
31. Vivacqua A, Bonofiglio D, Recchia AG, Musti AM, Picard D, Andò S, Maggiolini M. The G protein-coupled receptor GPR30 mediates the proliferative effects induced by 17beta-estradiol and hydroxytamoxifen in endometrial cancer cells. Mol Endocrinol. 2006; 20: 631-646.
32. Vivacqua A, Bonofiglio D, Albanito L, Madeo A, Rago V, Carpino A, Musti AM, Picard D, Andò S, Maggiolini M. 17beta-estradiol, genistein, and 4-hydroxytamoxifen induce the proliferation of thyroid cancer cells through the G protein-coupled receptor GPR30. Mol Pharmacol. 2006; 70: 1414-1423.
33. Maggiolini M, Vivacqua A, Fasanella G, Recchia AG, Sisci D, Pezzi V, Montanaro D, Musti AM, Picard D, Andò S. The G protein-coupled receptor GPR30 mediates c-fos up-regulation by 17beta-estradiol and phytoestrogens in breast cancer cells. J Biol Chem. 2004; 279: 27008-27016.
34. Kalluri R, Zeisberg M. Fibroblasts in cancer. Nat Rev Cancer. 2006; 6: 392–401.
35. Namløs HM, Meza-Zepeda LA, Barøy T, Østensen IH, Kresse SH, Kuijjer ML, Serra M, Bürger H, Cleton-Jansen AM, Myklebost O. Modulation of the osteosarcoma expression phenotype by microRNAs. PLoSOne. 2012; 7: e48086.
36. Guled M, Lahti L, Lindholm PM, Salmenkivi K, Bagwan I, Nicholson AG, Knuutila S. CDKN2A, NF2, and JUN are dysregulated among other genes by miRNANAs in malignant mesothelioma -A miRNA microarray analysis. Genes Chromosomes Cancer. 2009; 48: 615–623.
37. Akiyoshi S, Fukagawa T, Ueo H, Ishibashi M, Takahashi Y, Fabbri M, Sasako M, Maehara Y, Mimori K, Mori M. Clinical significance of miRNA-144-ZFX axis in disseminated tumour cells in bone marrow in gastric cancer cases. Br J Cancer. 2012; 107: 1345–1353.
38. Kalimutho M, Del Vecchio Blanco G, Di Cecilia S, Sileri P, Cretella M, Pallone F, Federici G, Bernardini S. Differential expression of miRNA-144* as a novel fecal-based diagnostic marker for colorectal cancer. J Gastroenterol. 2011; 46: 1391–1402.
39. Cheng AM, Byrom MW, Shelton J, Ford LP. Antisense inhibition of human miRNAs and indications for an involvement of miRNA in cell growth and apoptosis. Nucleic Acids Res. 2005; 33: 1290–1297.
40. Ma Y, She XG, Ming YZ, Wan QQ, Ye QF. MicroRNA-144 suppresses tumorigenesis of hepatocellular carcinoma by targeting AKT3. Mol Med Rep. 2015; 11: 1378-1383.
41. Ito Y, Bae SC, Chuang LS. The RUNX family: developmental regulators in cancer. Nat Rev Cancer. 2015; 15: 81–95.
42. Chimge NO, Frenkel B. The RUNX family in breast cancer: relationships with estrogen signaling. Oncogene 2013; 32: 2121-2130.
43. Janes KA. RUNX1 and its understudied role in breast cancer. Cell Cycle. 2011; 10: 3461–3465.
44. Frederick AM, Lawrence MS, Sivachenko AY, Sougnez C, Zou L, Cortes ML, Fernandez-Lopez JC, Peng S, et al. Sequence analysis of mutations and translocations across breast cancer subtypes. Nature. 2012; 486: 405–409.
45. Kadota M, Yang HH, Gomez B, Sato M, Clifford RJ, Meerzaman D, Dunn BK, Wakefield LM, Lee MP. Delineating genetic alterations for tumor progression in the MCF10A series of breast cancer cell lines. PLoS One. 2010; 5: e9201.
46. Chuang LSH, Ito K, Ito Y. RUNX family: Regulation and diversification of roles through interacting proteins. Int. J. Cancer. 2013; 132: 1260–1271.
47. Wang L, Brugge JS, Janes KA. Intersection of FOXO- and RUNX1-mediated gene expression programs in single breast epithelial cells during morphogenesis and tumor progression. Proc Natl Acad Sci USA 2011; 108: E803–E812.
48. Vrtačnik P, Ostanek B, Mencej-Bedrač S, Marc J. The many faces of estrogen signaling. Biochem Med (Zagreb) 2014; 24: 329-342.
49. Tao S, He H, Chen Q, Yue W. GPER mediated estradiol reduces miRNA-148a to promote HLA-G expression in breast cancer. Biochem Biophys Res Commun. 2014; 451: 74-78.
50. Pupo M, Vivacqua A, Perrotta I, Pisano A, Aquila S, Abonante S, Gasperi-Campani A, Pezzi V, Maggiolini M. The nuclear localization signal is required for nuclear GPER translocation and function in breast Cancer-Associated Fibroblasts (CAFs). Mol Cell Endocrinol. 2013; 376: 23-32.
51. Pandey DP, Lappano R, Albanito L, Madeo A, Maggiolini M, Picard D. Estrogenic GPR30 signalling induces proliferation and migration of breast cancer cells through CTGF. EMBO J. 2009; 28: 523-532.
52. Gallo A, Cuozzo C, Esposito I, Maggiolini M, Bonofiglio D, Vivacqua A, Garramone M, Weiss C, Bohmann D, Musti AM. Menin uncouples ELK-1, JunD and c-Jun phosphorilation from MAP kinase activation. Oncogene. 2002; 21: 6434-6445.
53. Meyers S, Lenny N, Hiebert SW. The t(8;21) fusion protein interferes with AML-1B-dependent transcriptional activation. Mol Cell Biol 1995; 15: 1974-1982.