
INTRODUCTION
Liver cancer is the fifth and seventh most frequently diagnosed cancer in men and women, respectively, worldwide. It is the second and sixth most frequent cause of cancer death in men and women, respectively [1]. Among primary liver cancers, hepatocellular carcinoma (HCC) represents the major histological subtype that accounts for 70% to 85% of the total liver cancers [1]. Surgery is the potentially curative therapy for HCC. Unfortunately, the majority of HCC is unresectable at the time of diagnosis due to advanced disease stages and unfavorable patient conditions [2]. Additionally, HCC is intrinsically resistant to conventional chemotherapies in clinic [3]. Sorafenib, a pan tyrosine kinase inhibitor, has remained the only approved targeted agent for advanced HCC since 2007. Despite of its application in the clinic, the benefit of sorafenib remains modest [4]. The biomarkers predicting the prognosis and responses to the treatment with sorafenib in HCC are virtually absent. Recent studies have shown that a decline in serum AFP levels from baseline may serve as a surrogate marker of outcome during treatment of HCC [5–7]. Development of molecularly targeted agents with novel mechanisms of action is desperately essential to tackle the unmet medical need. However, the success rate of developing new therapies for HCC is low despite exceptional investment in pharmaceutical research and development. Lack of clinically relevant and molecularly characterized preclinical models critically accounts for the failures in the development of efficacious therapeutics for HCC [8].
Establishing patient-derived xenograft (PDX) tumor models in immunodeficient mice has recently generated excitement [9]. PDX models closely resemble the original tumors in the aspects of histopathology, gene-expression patterns, mutational status, and drug responsiveness [9]. In contrast with cancer types prevalent in the Western countries, significantly fewer PDX models for HCC have been developed up to date. The first report of the PDX model for HCC appeared in 1996, in which a metastatic model of HCC from a Chinese patient was established orthotopically in athymic mice [10]. In 2004, also from a Chinese patient, another PDX model was established and reported [11]. In the same year, a group of researchers in Spain reported five HCC PDX models [12]. In 2006, seven subcutaneous PDX models were established from Singapore HCC patients [13]. Obviously, the number of articles that reported PDX models and/or apply PDX models for sequential studies has been increasing gradually. However, these earlier models had not been extensively characterized at the molecular levels, which limited their applications in development of targeted therapy. Furthermore, etiology of HCC appears to be geographically different due to the prevalence of different risk factors. Half of the total HCC-related deaths and new cases occurred in China, which is correlated with a high infection rate of hepatitis B virus (HBV) and hepatitis C virus [3]. Thus, a molecularly understanding of an extensive panel of PDX HCC models derived from Chinese patients is essential for developing more effective therapy.
In this study, we set out to establish a collection of PDX models from Chinese patients. Xenotransplantable grafts were then extensively characterized at histopathological, molecular, and pharmacological levels. We found that PDX tumors retained the histopathological and genomic features of their original counterparts. The landscape of genetic alterations is in agreement with the published data. Differential responses to sorafenib in PDX models reflect the pharmacological heterogeneity observed in the patient population. Efficacy of a novel FGFR1-targeted therapy was further demonstrated in multiple models expressing high levels of FGFR1 gene. Collectively, molecularly characterized HCC PDX models enable ‘personalized trials’ in mice by selecting potential responders and assist in identification of predictive biomarkers for patient stratification. Such an extensive collection of PDX models will accelerate new target discovery, test of novel therapeutics, and translation of experimental therapies into the clinic.
MATERIALS AND METHODS
PDX establishment
In compliance with the protocol approved by the Institutional Review Board of Eastern Hepatobiliary Surgery Hospital/Institute of Shanghai and with the subject’s informed consent, a fragment of surgically resected tumor tissue was used for xenotransplantation [14]. Briefly, patient samples (designated as PA) were collected, trimmed, cut into 20–30 mm3 fragments and implanted subcutaneously in the fore and/or hind bilateral flanks of anesthetized 6- to 8-week old female BALB/c athymic or severe combined immunodeficiency (SCID) mice (Shanghai SLAC Laboratory Animal Co., Ltd.; Shanghai Sino-British Sippr/BK Lab Animal Co., Ltd., Shanghai) within three hours. The mice were examined periodically for three months. Once the first generation of xenografts (named as P0) was established, serial implantations in BALB/c athymic mice were performed to expand the xenograft tumors (i.e. P1, P2, P3, and beyond; Figure 1A). Tumor size was measured using a digital caliper (Cal Pro, Sylvac, Switzerland). Tumor volume was calculated as 0.5 × length × width2. Tumor fragments (~200 mm3) at each passage were viably frozen in a freezing solution (10% DMSO, 20% FBS, and 70% RPMI 1640 medium) and stored in liquid nitrogen for future re-implantation. Additional fragments were either snap-frozen in liquid nitrogen, or preserved in RNAlater RNA stabilization reagent (Qiagen), or fixed for histology. All procedures and protocols were approved by the Institutional Animal Care and Use Committee of WuXi AppTec.
Histology
Patient samples and PDX tissues were formalin-fixed, paraffin-embedded, cut into sections, and stained with hematoxylin and eosin (H&E). Histopathology was examined under light microscopy by a pathologist (XX).
Tissue processing for genomic studies
Genomic DNA and RNA were isolated using a QIAamp DNA mini kit (Qiagen) and RNeasy protect mini kit (Qiagen), respectively. The concentrations were quantified using NanoDrop ND-1000 spectrophotometer (NanoDrop, Wilmington, DE). RNA samples with an RNA integrity number above 8.0 and A260/280 ratios above 2.0 were used for gene expression array. DNA samples with A260/280 ratios between 1.8 and 2.0 and A260/230 ratios above 2.0, and proven to be high quality by gel electrophoresis were used for WES and SNP 6.0 array analyses.
Gene expression array
Total RNA was amplified and fragmented using a GeneChip® 3′ IVT expression kit (Affymetrix, Santa Clara, CA). Then the samples were hybridized onto a GeneChip® PrimeView™ human gene expression array (Affymetrix). Arrays were scanned on an Affymetrix GeneChip® scanner 3000 7G (Affymetrix). Resulting data was subject to bioinformatics analysis. Briefly, the raw CEL data were processed on an Expression Console™ (version 1.1, Affymetrix). Signal intensities were normalized by the robust multiarray average normalization approach. On 9 pairs of samples which consisted of original patient samples and their corresponding xenograft tumors, unsupervised hierarchical clustering analysis was performed by ‘hclust’ package on R with criteria Euclidian distance and average linkage.
Whole exome sequencing (WES)
One microgram of each DNA sample was used for library construction using a TruSeq DNA sample preparation kit (Illumina, San Diego, CA). Libraries were pool (500 ng each) for exome capture and amplification using the TruSeq Exome Enrichment kit (Illumina). Sequencing was then performed with paired-end 2 x 100 base reads on the Illumina HiSeq 2000 platform (Illumina). Raw FASTQ files were first processed by a proprietary algorithm to filter out mouse sequence contaminations. We have shown that this filter step does not affect the human SNP detection [15, 16]. After mouse sequence removed, data was aligned to human reference genome hg19/GRCh37 by BWA 0.6.1 and processed to variants calling by GATK 1.6.
Copy number analysis
Genomic DNA was amplified and fragmented using a core SNP 6 reagent kit and DNase I (Affymetrix). Then the sample is hybridized onto Affymetrix GeneChip® genome-wide human SNP array 6.0 arrays and the arrays were scanned on an Affymetrix GeneChip® scanner 3000 7G. Data was initially analyzed on the Affymetrix Genotyping Console™ and subject to further in-house analysis. Raw CEL data of SNP 6.0 arrays was processed on the Genotyping Console (version 4.1.1.834, Affymetrix). Segment summary of each sample was generated by the Genotyping Console with default configuration. Then all summaries were processed by a proprietary algorithm to retrieve HUGO gene symbols of genes that are located within the segments regions, with copy number status and gene annotations.
Serum AFP expression
Sera were collected from mice bearing tumors with a total volume of between 300 and 1,000 mm3. Fifteen μl of sera was subjected to AFP detection by using an AimPlex multiplex AFP assay kit following the manufacturer’s instruction (QuantoBio, Beijing, China). Briefly, AFP specific antibody coated bead suspension was added to a 96-well filter plate. Test sera (15 μl) were added and incubated. Extensive washing was performed afterwards and between each step below. Biotinylated AFP specific antibody (25 μl) was added and incubated. Streptavidin-PE solution (25 μl) was added and incubated. Reading buffer (150 μl) was added to resuspend the beads, and the suspension was subject to flow cytometry analysis using a Canto II (BD Biosciences, San Jose, CA).
Compounds and therapeutic assays
Sorafenib (LC Laboratories, Woburn, MA) was formulated in CremophorEL/95% ethanol (50:50; Sigma) at 4 × concentration and was diluted with distilled water. Lenvatinib was synthesized by Wuxi AppTec (Shanghai, China) with a purity of 96% and formulated in distilled water. For efficacy studies, female BALB/c athymic mice were implanted with tumor fragments subcutaneously. When the tumors reached 150 – 200 mm3, the mice were stratified into different groups for treatments. Each group contained 5 animals. Sorafenib (60 mg/kg), or lenvatinib (30 mg/kg), or vehicles were administered by oral gavage daily. Tumor sizes and body weights were measured twice weekly. Tumor growth inhibition (TGI) is calculated for each group using the formula: TGI (%) = [1−(Ti−T0)/ (Vi−V0)] × 100; Ti is the average tumor volume of a treatment group on a given day, T0 is the average tumor volume of the treatment group on the first day of treatment, Vi is the average tumor volume of the vehicle control group on the same day with Ti, and V0 is the average tumor volume of the vehicle group on the first day of treatment. The differences of tumor volumes between groups were analyzed for significance using t test for studies with two groups; or one-way ANOVA followed by Tukey’s test for studies with more than two groups.
RESULTS
Establishment of PDX models and clinical characteristics of patients
Out of 254 HCC clinical sample implants, we were able to establish 65 xenograft tumors grown in immunodeficient mice as transplantable PDX models (~26%). PDXs were serially passaged in animals 3 – 5 times. The latencies of engraftment and growth rates of PDXs varied significantly among different models (Supplemental Figure 1). A bio-specimen bank of original patient tissues and xenografts at each passages was established, including formalin fixed paraffin-embedded (FFPE) blocks, viably cryopreserved, and RNAlater®-treated and/or snap frozen tissues (Figure 1A). Cryopreserved xenografts could re-grow in mice, providing a renewable tissue source for future experimentations.
Clinical characteristics of these 65 original tumors, including HBV viral infection history of patients tested in the clinic, were summarized in Table 1. Among the collection, ages of patients ranged from 26 up to 78 with medium of 52. Tumor grades ranged from II to IV, and tumor stages from I to IV. All of models were established from treatment-naïve tumors.
Histology of xenografts
The histology and degree of differentiation of the PDX matched well with that of the original tumor (Figure 1B). In addition, PDX tumors maintained intratumor heterogeneity, resembling the original tumors (Figure 1B).
Molecular characterization of xenografts and/or corresponding patients’ tumors
We then determined gene expression profiles, mutational status, CNAs, and serum AFP expression in PDX models by expression array, WES, SNP 6.0 array, and flow cytometry, respectively.
Gene expression
In order to establish a correlation of gene expression profiles between the original and xenograft tumors, we first performed a pilot study in randomly selected nine models indicated in Figure 2A. Each model comprised of the original patient tumors and corresponding xenograft tumors (P3). Unsupervised clustering of the results showed that all of nice PDXs clustered tightly together with the corresponding patient tumors, demonstrating that PDXs authentically maintained the global gene expression characteristics of patients’ tumors (Figure 2A).
To further identify the set of genes which discriminated the PDXs from the original tumors, we analyzed the differentially expressed genes between two populations. The results showed that, compared to the original tumors, 83 probe sets revealed the upregulation of approximately 72 genes in xenografts with an average fold change of 3.5, whereas 749 probe sets detected the downregulation of approximately 744 genes in PDX tumors (Supplemental Table 1).
Gene expression profiling was further performed in xenografts of additional 34 models. All expression data from 9 patient tumors and 43 PDXs have been deposited to Gene Expression Omnibus (http://www.ncbi.nlm.nih.gov/geo/; accession GSE55828). Thus, the global gene expression signature in 43 models has been established, which provides a database for searching for PDX models exhibiting an appropriate biomarker for targeted therapy. Notably, overexpression of FGFR1 gene was observed in several models, which may discriminate a population sensitive to FGFR1-targeted agents (Figure 2B). Three models, designated as LI-03-0010, LI-03-0020 and LI-03-0164, which overexpressed FGFR1 but not FGFR2 or FGFR3 genes in comparison with the average levels of the collection of models, were selected for subsequent in vivo pharmacological studies.
WES
WES was performed to detect mutational alterations, including SNPs and indels, in protein-coding regions in 56 xenograft tumors at a coverage of 100 × . Xenografts at P2 or P3 from 51 models were used with a few exceptions (Table 1).
We first found that mouse DNA sequences accounted for a significant fraction of sequence reads in xenograft samples, even using a human exome capture kit. In order to remove murine DNA sequences from the xenograft sequencing data, we have established a proprietary algorithm to deplete mouse sequence contamination and keep human sequence reads intact. The performance of this algorithm has been demonstrated in a previous study of exome sequencing of eight case-matched trio sets of Chinese esophageal squamous cell carcinoma, blood, and PDX tumor tissues [15, 16]. An example was elucidated in Supplemental Figure 2A. In average, murine DNA reads contributed to approximately 40% of genetic variations detected in PDX tissues. Excluding these contaminating mouse sequences significantly improved the accuracy of mutation detection in xenograft samples.
Across all 56 PDX models, we detected an average of 8033.5 protein-altering single nucleotide alterations (SNA) per model, including 86 frame-shift indels, 3.5 stop-gain/loss indels, 7878 non-synonymous SNPs, and 66 stop-gain/loss SNPs. A complete list of genetic alterations in 56 models was provided in Supplemental Table 2.
A variety of genetic alterations causing amino-acid changes (i.e., non-synonymous alterations, including SNPs and indels) on the genes have previously been linked to HCC [17–19]. In our study, we identified many of them in the 56 models (Supplemental Table 2). Regarding TP53, genetic alterations were found in 42 models (75%), including a variety of SNPs and 2 deletions. Twelve models carried 13 genetic alterations in MLL3 gene, including 7 frame shift insertions and 6 SNPs (21%). For CTNNB1, we found SNPs in 8 models (14%). Seven models showed SNPs in AXIN1 gene and another exhibited deletion (14%). Five models showed distinct SNPs in ARID1B gene (9%). Four models carried SNP, or deletion, or insertion of RB1 gene (7%). Four models carried distinct SNPs of JAK1 gene (7%). Three exhibited SNPs of TP73 gene (5%). Two models carried a SNP and a deletion, respectively, in CDKN2A gene (4%). One model carried a SNP in KRAS gene (2%). One model carried a SNP in IGF2R (2%).
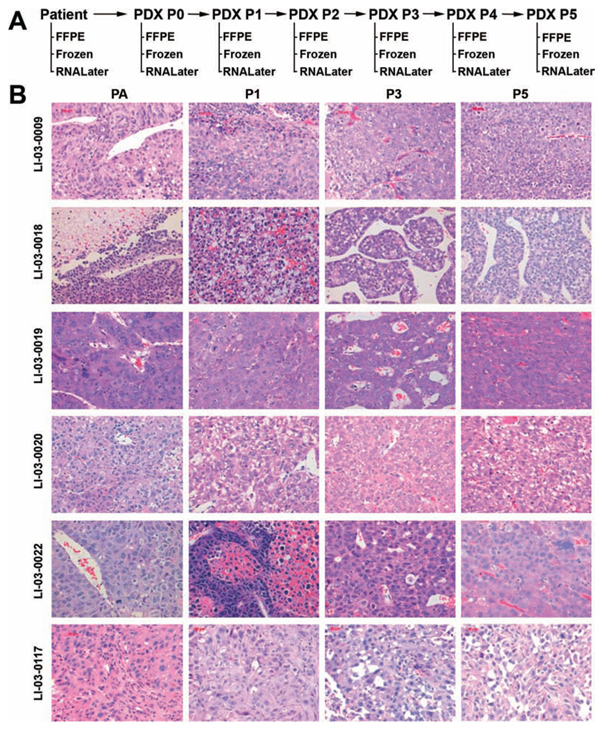
Figure 1: A. Schema depicts the work flow of establishment of PDX models for HCC, including the disposition of patient samples, and PDX tissues at each passage. B. Representative H&E sections (400 × ) of the original patient tumors and xenografts. PA, patient tumor; P0, the first xenograft in mice; P1, the second xenograft; and beyound.
Copy number analysis
We performed genome-wide human SNP 6.0 arrays to determine DNA CNA across the entire human genome in 42 PDX tumors. The results were summarised in Supplemental Table 3. Genes exhibited normal copy numbers (i.e., 2) were left blank. Otherwise, 3 or 4, or higher numbers indicated a copy number gain and 0 or 1 indicated a copy number loss. A comparison of CNA with published data [20] was illustrated in Table 2. For example, copy number losses of AFF1 (76%), RAP1GDS1 (71%), TP53 (64%), PTEN (19%) genes were identified. Copy number gains were detected in PBX1 (76%), PRCC (76%), ARNT (62%), MYC (62%), BCL9 (60%), MTDH (52%), MET (43%), and FGF19 (14%).
Table 1. The list of transplantable HCC PDX models, molecular characterizations and clinical information of the corresponding patients
Model ID |
Gender |
Age (years) |
Source |
Histology |
Cancer grade |
Cancer stage |
Metastasis |
Hepatitis B virus |
|
1 |
LI-03-0004 |
M |
63 |
Primary |
HCC |
III |
T3N0M0 |
No |
+ |
2 |
LI-03-0005 |
M |
46 |
Primary |
HCC |
III |
T3N0M0 |
No |
+ |
3 |
LI-03-0006 |
M |
66 |
Primary |
Combined hepatocellular and cholangiocarcinoma |
n/a |
T2N0M0 |
No |
− |
4 |
LI-03-0007 |
M |
56 |
Primary |
HCC |
III |
T3N0M1 |
Yes |
− |
5 |
LI-03-0008 |
M |
65 |
Primary |
HCC |
III |
T2N0M0 |
No |
n/a |
6 |
LI-03-0009 |
M |
53 |
Primary |
HCC |
III |
T3N0M0 |
No |
+ |
7 |
LI-03-0010 |
M |
45 |
Primary |
HCC |
III |
T3N1M0 |
No |
n/a |
8 |
LI-03-0011 |
M |
37 |
Primary |
HCC |
III |
T3N0M0 |
No |
+ |
9 |
LI-03-0012 |
M |
44 |
Primary |
HCC |
III |
T3N0M0 |
No |
+ |
10 |
LI-03-0014 |
M |
47 |
Primary |
HCC |
III |
T3N0M0 |
No |
+ |
11 |
LI-03-0016 |
M |
42 |
Primary |
HCC |
III |
T3N0M0 |
No |
+ |
12 |
LI-03-0017 |
F |
56 |
Primary |
HCC |
III |
T3N0M0 |
No |
+ |
13 |
LI-03-0018 |
M |
48 |
Primary |
HCC |
III |
T3N0M0 |
No |
+ |
14 |
LI-03-0019 |
M |
46 |
Primary |
HCC |
III |
T3N0M0 |
No |
+ |
15 |
LI-03-0020 |
M |
69 |
Primary |
HCC |
III |
T3N0M0 |
No |
− |
16 |
LI-03-0021 |
M |
53 |
Primary |
HCC |
III |
T3N0M0 |
No |
+ |
17 |
LI-03-0022 |
M |
46 |
Primary |
HCC |
III |
T3N0M0 |
No |
+ |
18 |
LI-03-0023 |
F |
26 |
Primary |
HCC |
III |
T3N0M0 |
No |
− |
19 |
LI-03-0055 |
M |
67 |
Primary |
HCC |
III |
T3N0M0 |
No |
− |
20 |
LI-03-0061 |
M |
57 |
Primary |
HCC |
III |
T3N0M0 |
No |
+ |
21 |
LI-03-0082 |
M |
72 |
Primary |
HCC |
III |
T3N0M0 |
No |
− |
22 |
LI-03-0086 |
F |
37 |
Primary |
HCC |
III |
T3N0M0 |
No |
+ |
23 |
LI-03-0097 |
M |
55 |
Primary |
HCC |
III |
T2N0M0 |
No |
− |
24 |
LI-03-0100 |
F |
68 |
Primary |
HCC |
III |
T3N0M0 |
No |
+ |
25 |
LI-03-0101 |
M |
78 |
Primary |
HCC |
III |
T2N0M0 |
No |
− |
26 |
LI-03-0103 |
M |
58 |
Primary |
HCC |
III |
T3N0M1 |
Yes |
+ |
27 |
LI-03-0113 |
M |
43 |
Primary |
HCC |
III |
T3N0M0 |
No |
n/a |
28 |
LI-03-0115 |
M |
57 |
Primary |
HCC |
III |
T2N0M0 |
No |
+ |
29 |
LI-03-0117 |
M |
61 |
Primary |
HCC |
III–IV |
T3N0M0 |
No |
n/a |
30 |
LI-03-0122 |
F |
70 |
Primary |
HCC |
III |
T3N0M0 |
No |
− |
31 |
LI-03-0126 |
M |
57 |
Primary |
HCC |
III |
T4N0M0 |
No |
n/a |
32 |
LI-03-0140 |
F |
72 |
Primary |
HCC |
III |
T1N0M0 |
No |
+ |
33 |
LI-03-0141 |
M |
35 |
Primary |
HCC |
II |
T1N0M0 |
No |
+ |
34 |
LI-03-0143 |
M |
47 |
Primary |
HCC |
III |
T2N0M1 |
Yes |
+ |
35 |
LI-03-0146 |
F |
71 |
Primary |
HCC |
III |
T3N0M0 |
No |
+ |
36 |
LI-03-0147 |
M |
53 |
Primary |
HCC |
III |
T2N0M0 |
No |
− |
37 |
LI-03-0149 |
M |
45 |
Primary |
HCC |
III |
T1N0M0 |
No |
− |
38 |
LI-03-0153 |
M |
45 |
Primary |
HCC |
III |
T3N0M0 |
No |
+ |
39 |
LI-03-0155 |
M |
46 |
Primary |
HCC |
III |
T1N0M0 |
No |
+ |
40 |
LI-03-0158 |
F |
55 |
Primary |
HCC |
III |
T4N0M0 |
No |
+ |
41 |
LI-03-0159 |
F |
28 |
Primary |
HCC |
III |
T3N0M0 |
No |
− |
42 |
LI-03-0164 |
M |
42 |
Primary |
HCC |
III |
T3N0M1 |
Yes |
− |
43 |
LI-03-0167 |
M |
71 |
Primary |
HCC |
III |
T3N0M0 |
No |
+ |
44 |
LI-03-0185 |
M |
64 |
Primary |
HCC |
III |
T3N0M0 |
No |
+ |
45 |
LI-03-0187 |
M |
49 |
Primary |
HCC |
III |
T1N0M0 |
No |
+ |
46 |
LI-03-0189 |
M |
47 |
Primary |
HCC |
III |
T1N0M0 |
No |
+ |
47 |
LI-03-0191 |
M |
34 |
Primary |
HCC |
III |
T3N1M0 |
No |
+ |
48 |
LI-03-0196 |
M |
55 |
Primary |
HCC |
III |
T2N0M0 |
No |
− |
49 |
LI-03-0198 |
M |
52 |
Primary |
HCC |
III |
T3N0M0 |
No |
+ |
50 |
LI-03-0200 |
M |
44 |
Primary |
HCC |
III |
T1N0M0 |
No |
+ |
51 |
LI-03-0208 |
M |
45 |
Primary |
HCC |
III–IV |
T3N0M0 |
No |
+ |
52 |
LI-03-0209 |
M |
66 |
Primary |
HCC |
III |
T2N0M0 |
No |
n/a |
53 |
LI-03-0217 |
M |
54 |
Primary |
HCC with sarcomatous change |
IV |
T4N1M1 |
Yes |
+ |
54 |
LI-03-0219 |
F |
33 |
Primary |
HCC |
III |
T1N0M0 |
No |
+ |
55 |
LI-03-0220 |
M |
47 |
Primary |
HCC |
III |
T3N0M0 |
No |
n/a |
56 |
LI-03-0228 |
M |
43 |
Primary |
HCC |
III |
T4N0M0 |
No |
+ |
57 |
LI-03-0240 |
M |
52 |
Primary |
HCC |
III |
T1N0M0 |
No |
+ |
58 |
LI-03-0242 |
M |
38 |
Primary |
HCC |
III |
T3N0M0 |
No |
+ |
59 |
LI-03-0243 |
F |
46 |
Primary |
HCC |
III |
T3N0M0 |
No |
+ |
60 |
LI-03-0252 |
M |
40 |
Primary |
HCC |
III |
T3N1M0 |
No |
+ |
61 |
LI-03-0254 |
M |
64 |
Primary |
HCC |
III |
T4N0M0 |
No |
n/a |
62 |
LI-03-0255 |
M |
61 |
Primary |
HCC |
III |
T2N0M0 |
No |
n/a |
63 |
LI-03-0257 |
M |
53 |
Primary |
HCC |
III |
T2N0M0 |
No |
+ |
64 |
LI-03-0266 |
M |
51 |
Primary |
HCC |
III–IV |
T1N0M1 |
Yes |
+ |
65 |
LI-03-0271 |
M |
36 |
Primary |
HCC |
III |
T4N0M1 |
Yes |
+ |
Model ID |
Treatment prior to surgery (chemotherapy or radiotherapy) |
Gene expression |
Whole exome sequencing (xenograft) |
SNP 6.0 array (xenograft) |
AFP in sera of tumor-bearing animal (ng/ml) |
||
Patient, PA, sample |
Xenograft |
||||||
1 |
LI-03-0004 |
None |
N/D |
P3 |
P3 |
P3 |
N/D |
2 |
LI-03-0005 |
None |
N/D |
P3 |
P2 |
P2 |
0 |
3 |
LI-03-0006 |
None |
N/D |
P3 |
P3 |
P3 |
N/D |
4 |
LI-03-0007 |
None |
N/D |
P4 |
P3 |
P2 |
N/D |
5 |
LI-03-0008 |
None |
N/D |
N/D |
P4 |
N/D |
N/D |
6 |
LI-03-0009 |
None |
N/D |
P4 |
P4 |
P4 |
N/D |
7 |
LI-03-0010 |
None |
N/D |
P3 |
P4 |
P4 |
0 |
8 |
LI-03-0011 |
None |
N/D |
P3 |
P3 |
P3 |
N/D |
9 |
LI-03-0012 |
None |
PA |
P3 |
P3 |
P3 |
0.01746 |
10 |
LI-03-0014 |
None |
N/D |
P4 |
P3 |
P3 |
0.01746 |
11 |
LI-03-0016 |
None |
N/D |
P3 |
P2 |
P2 |
N/D |
12 |
LI-03-0017 |
None |
N/D |
P3 |
P3 |
P3 |
N/D |
13 |
LI-03-0018 |
None |
PA |
P3 |
P3 |
P3 |
> 820.150 |
14 |
LI-03-0019 |
None |
PA |
P3 |
P3 |
P3 |
4.645 |
15 |
LI-03-0020 |
None |
PA |
P3 |
P3 |
P3 |
1.649 |
16 |
LI-03-0021 |
None |
PA |
P3 |
P3 |
P3 |
N/D |
17 |
LI-03-0022 |
None |
PA |
P3 |
P3 |
P3 |
0.307 |
18 |
LI-03-0023 |
None |
N/D |
N/D |
P2 |
N/D |
0.198 |
19 |
LI-03-0055 |
None |
N/D |
N/D |
P2 |
N/D |
N/D |
20 |
LI-03-0061 |
None |
N/D |
P3 |
P2 |
P2 |
1.82 |
21 |
LI-03-0082 |
None |
N/D |
N/D |
N/D |
N/D |
12.225 |
22 |
LI-03-0086 |
None |
N/D |
P3 |
P2 |
P2 |
121.764 |
23 |
LI-03-0097 |
None |
PA |
P3 |
P3 |
P3 |
N/D |
24 |
LI-03-0100 |
None |
PA |
P3 |
P3 |
N/D |
N/D |
25 |
LI-03-0101 |
None |
N/D |
N/D |
P2 |
N/D |
> 820.150 |
26 |
LI-03-0103 |
None |
N/D |
N/D |
N/D |
N/D |
2.594 |
27 |
LI-03-0113 |
None |
N/D |
N/D |
N/D |
N/D |
N/D |
28 |
LI-03-0115 |
None |
N/D |
P4 |
P3 |
P3 |
> 820.150 |
29 |
LI-03-0117 |
None |
N/D |
P3 |
P2 |
P2 |
0 |
30 |
LI-03-0122 |
None |
N/D |
P2 |
P2 |
P2 |
0 |
31 |
LI-03-0126 |
None |
N/D |
N/D |
N/D |
N/D |
N/D |
32 |
LI-03-0140 |
None |
N/D |
P4 |
P3 |
P3 |
> 820.150 |
33 |
LI-03-0141 |
None |
PA |
P3 |
P2 |
P2 |
N/D |
34 |
LI-03-0143 |
None |
N/D |
P3 |
P3 |
P3 |
0.797 |
35 |
LI-03-0146 |
None |
N/D |
P3 |
P3 |
P3 |
N/D |
36 |
LI-03-0147 |
None |
N/D |
P3 |
P3 |
P3 |
N/D |
37 |
LI-03-0149 |
None |
N/D |
P2 |
P2 |
P2 |
N/D |
38 |
LI-03-0153 |
None |
N/D |
N/D |
N/D |
N/D |
N/D |
39 |
LI-03-0155 |
None |
N/D |
N/D |
P3 |
N/D |
N/D |
40 |
LI-03-0158 |
None |
N/D |
N/D |
N/D |
N/D |
N/D |
41 |
LI-03-0159 |
None |
N/D |
P3 |
P3 |
P3 |
> 820.150 |
42 |
LI-03-0164 |
None |
N/D |
P3 |
P0 |
P0 |
N/D |
43 |
LI-03-0167 |
None |
N/D |
N/D |
P3 |
N/D |
N/D |
44 |
LI-03-0185 |
None |
N/D |
P3 |
P2 |
P2 |
N/D |
45 |
LI-03-0187 |
None |
N/D |
P3 |
P2 |
P2 |
N/D |
46 |
LI-03-0189 |
None |
N/D |
P3 |
P2 |
P2 |
N/D |
47 |
LI-03-0191 |
None |
N/D |
P3 |
P2 |
P2 |
4.11 |
48 |
LI-03-0196 |
None |
N/D |
N/D |
N/D |
N/D |
820.15 |
49 |
LI-03-0198 |
None |
N/D |
N/D |
P2 |
N/D |
82.104 |
50 |
LI-03-0200 |
None |
N/D |
P2 |
P2 |
P2 |
N/D |
51 |
LI-03-0208 |
None |
N/D |
N/D |
P2 |
N/D |
0 |
52 |
LI-03-0209 |
None |
N/D |
P2 |
P2 |
P2 |
N/D |
53 |
LI-03-0217 |
None |
N/D |
P4 |
P3 |
P3 |
0 |
54 |
LI-03-0219 |
None |
N/D |
N/D |
N/D |
N/D |
16.049 |
55 |
LI-03-0220 |
None |
N/D |
N/D |
P3 |
N/D |
16.169 |
56 |
LI-03-0228 |
None |
N/D |
N/D |
P2 |
N/D |
> 820.150 |
57 |
LI-03-0240 |
None |
N/D |
P3 |
P1 |
P1 |
N/D |
58 |
LI-03-0242 |
None |
N/D |
N/D |
P3 |
N/D |
N/D |
59 |
LI-03-0243 |
None |
N/D |
P3 |
P2 |
P2 |
146.279 |
60 |
LI-03-0252 |
None |
N/D |
P3 |
P2ww |
P2 |
N/D |
61 |
LI-03-0254 |
None |
N/D |
P3 |
P2 |
P2 |
79.602 |
62 |
LI-03-0255 |
None |
N/D |
N/D |
P3 |
N/D |
N/D |
63 |
LI-03-0257 |
None |
N/D |
N/D |
P3 |
N/D |
N/D |
64 |
LI-03-0266 |
None |
N/D |
N/D |
N/D |
N/D |
0.553 |
65 |
LI-03-0271 |
None |
N/D |
P4 |
P2 |
P2 |
148.491 |
9 |
43 |
56 |
42 |
||||
Note: N/D, not done; n/a, not available; P, passage; AFP, serum–fetoprotein (AFP).
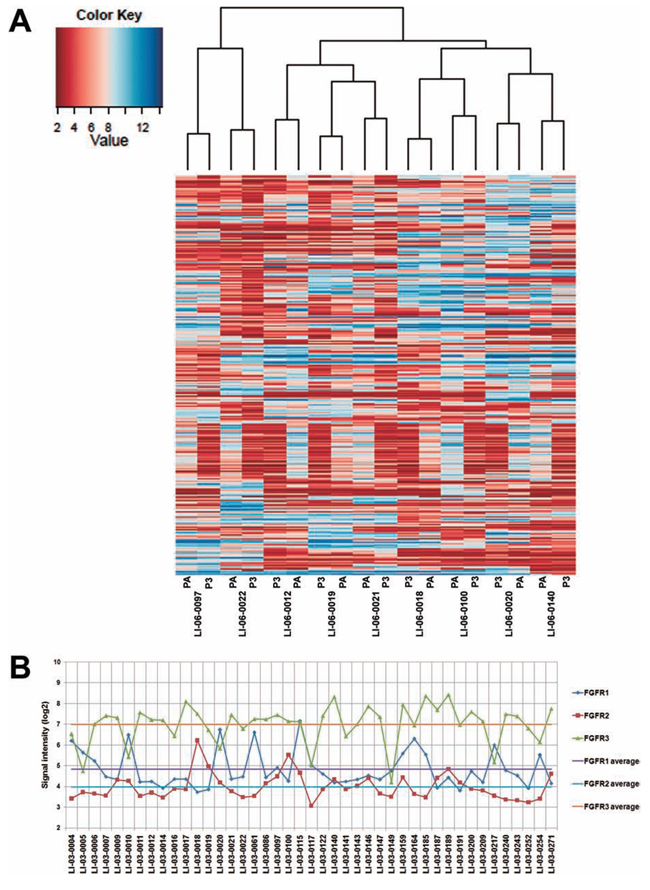
Figure 2: Gene expression profiles in the original tumors were well maintained in PDXs. A. The dendrogram shows unsupervised hierarchical clustering of samples according to gene expression pattern, and heat map after substraction of genes whose intensity value’s standard deviation is < 1.8 across all samples is shown. B. Expression levels, represented by signal intensities, of FGFR1, FGFR2, and FGFR3 in 44 models. The average of expression levels of each gene was calculated and marked as color-coded solid lines.
Table 2: Comparison of representative amplified and deleted cancer genes between 286 HCC patient samples reported by Wang et al. (16) and our 42 HCC PDX models
Rank |
CNA type |
Gene |
Frequency in patients % (Illumina Human Omin1_Quad BeadChip) |
Frequency in PDX models % (Affymetric SNP 6.0 array) |
1 |
Amplification |
PBX1 |
N/A |
76.2 |
2 |
Amplification |
PRCC |
N/A |
76.2 |
3 |
Amplification |
ARNT |
12.9 |
61.9 |
4 |
Amplification |
BCL9 |
8.7 |
59.5 |
5 |
Amplification |
MTDH |
12.9 |
52.4 |
6 |
Amplification |
COX6C |
12.6 |
52.4 |
7 |
Amplification |
ABL2 |
12.9 |
50.0 |
8 |
Amplification |
MET |
4.5 |
42.9 |
9 |
Amplification |
CCND1 |
4.9 |
16.7 |
10 |
Amplification |
FGF19 |
4.9 |
14.3 |
1 |
Deletion |
AFF1 |
19.6 |
76.2 |
2 |
Deletion |
RAP1GDS1 |
19.6 |
71.4 |
3 |
Deletion |
WRN |
15.7 |
71.4 |
4 |
Deletion |
PCM1 |
17.1 |
71.4 |
5 |
Deletion |
WHSC1L1 |
17.1 |
66.7 |
6 |
Deletion |
RB1 |
9.1 |
59.5 |
7 |
Deletion |
BRCA2 |
7.0 |
57.1 |
8 |
Deletion |
CDKN2A |
12.6 |
57.1 |
9 |
Deletion |
CDH1 |
N/A |
50.0 |
10 |
Deletion |
CDKN2B |
12.6 |
45.2 |
11 |
Deletion |
TSC2 |
N/A |
38.1 |
12 |
Deletion |
SMAD4 |
4.9 |
33.3 |
13 |
Deletion |
APC |
N/A |
28.6 |
14 |
Deletion |
STK11 |
N/A |
26.2 |
15 |
Deletion |
WT1 |
N/A |
23.8 |
16 |
Deletion |
MLH1 |
N/A |
21.4 |
17 |
Deletion |
TNFAIP3 |
6.3 |
21.4 |
18 |
Deletion |
PTEN |
4.9 |
19.1 |
19 |
Deletion |
CDKN2C |
7.0 |
16.7 |
20 |
Deletion |
ARID1A |
7.0 |
14.3 |
21 |
Deletion |
TNFRSF14 |
8.0 |
11.9 |
Note: N/A, information not available.
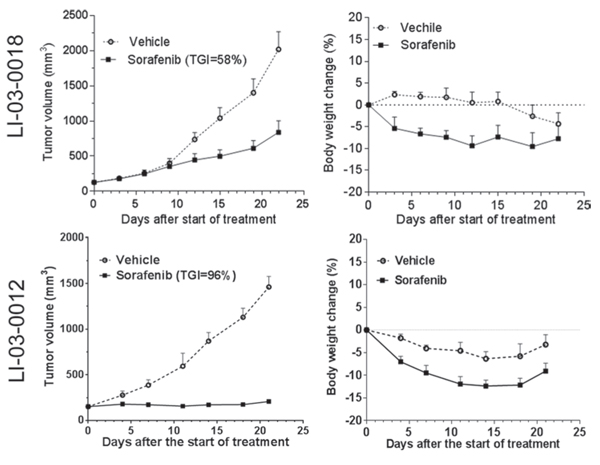
Figure 3: The effect of standard-of-care compound sorafenib was evaluated in two HCC models (LI-03-0018 at P6; LI-03-0012 at P5). Tumor-bearing animals were treated for 22 and 21 days in LI-03-0018 and LI-03-0012 models, respectively. Tumor volumes (left panel) and body weight changes (right panel) were plotted by the mean ± standard error mean. At the end point, compared to vehicle controls, tumor growth inhibition induced by the treatment with sorafenib was statistically significant with variable confidence P levels: P < 0.05 and P < 0.01 in LI-03-0018 and LI-03-0012 models, respectively. No statistical difference in the changes of body weights was identified between vehicle and treatment groups in both experiments (P > 0.05).
Detection of AFP in serum in PDX models
Among 32 models tested, serum AFP was detectable in 26 models (81.3%; Table 1), suggesting that a large fraction of PDX models reflect the characteristics of HCC in clinic.
Differential responses to sorafenib and efficacy of FGFR inhibitor lenvatinib
To evaluate the responses of PDX models to the standard-of-care agent, we first conducted in vivo efficacy studies of sorafenib in two randomly selected PDX models (Figure 3). Interestingly, one model, designated as LI-03-0018, showed a partial response (TGI, 58%) whereas another LI-03-0012 showed a stable disease (TGI, 96%). These results suggest that, similar to the heterogeneous patient population in clinic, PDX models responded to the standard-of-care therapy differentially.
In order to elucidate the application of the molecularly characterized PDX models in personalized medicine, we selected three models LI-03-0010, LI-03-0020 and LI-03-0164 with overexpression of FGFR1 gene, but with lower-than-average levels of FGFR2/3 genes (Figure 2B), for targeted therapy of FGFR inhibitor lenvatinib. Our results showed that FGFR1-overexpressing models were more sensitive to the treatment with lenvatinib in comparison with sorafenib (Figure 4). TGIs of lenvatinib and sorafenib were 101% and 91%, respectively, in the model of LI-03-0010; 99% and 60% in LI-03-0020; and 73% and 56% in LI-03-0164. Although no statistically significant growth inhibition was observed between lenvatinib and sorafenib treatment groups, a greater effect of lenvatinib was clearly demonstrated, especially in the model of LI-03-0020, in which statistically significant tumor growth inhibition was only induced by the treatment with lenvanitib, but not with sorafenib, in comparison with vehicle control.
In all three in vivo experiments, body weights of lenvatinib-treated mice were maintained better than sorafenib-treated mice (Figure 4). A profound weight loss (i.e., ≥ 20%) only appeared in sorafenib-treated group in LI-03-0164, which led to treatment discontinuation since d8. These results implicate for less toxicity of lenvatinib compared to sorafenib.
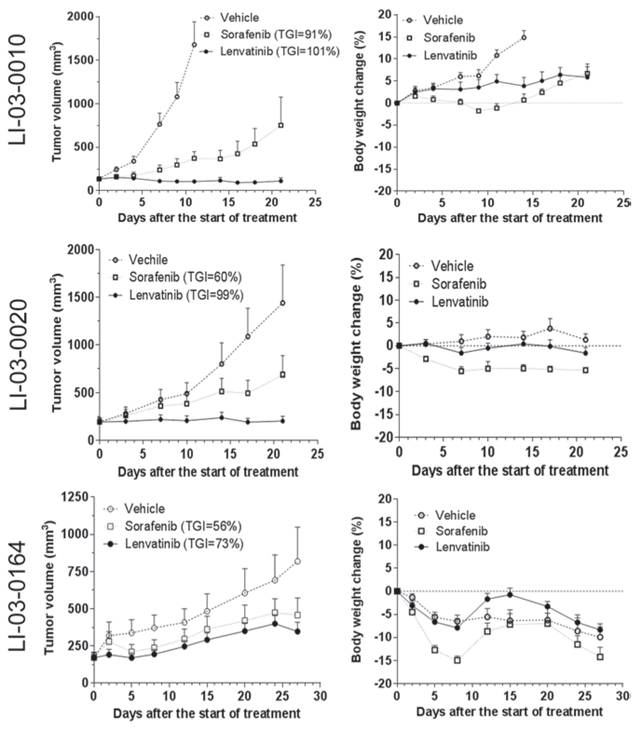
Figure 4: The effects of FGFR inhibitor lenvatinib and sorafenib were evaluated in FGFR1-overexpressing models LI-0010 (P8), LI-0020 (P6), and LI-03-0164 (P5). In the study in LI-03-0010, tumor-bearing animals were treated for 21 days with lenvatinib or sorafenib, whereas the vehicle group was terminated at day 11 due to its rapid growth. Statistical analyses were performed using the data at d11. In comparison with the tumor sizes in the control group, significant tumor growth inhibition was observed in both sorafenib- (P < 0.05) and lenvatinib-treated (P < 0.05) groups. No significant difference was observed between two agents (P > 0.05). Loss of body weight was observed in both treatment groups when compared with the control group (P < 0.05) and, additionally, a significant difference existed between two treatment groups (P < 0.05). In the study in LI-03-0020, all of tumor-bearing animals in there groups were treated for 21 days. At the end point, significant growth inhibition was only observed in lenvatinib-treated group compared to the control group (P < 0.05). however, a significant loss of body weight only appeared in sorafenib-treated group compared to the control group (P < 0.05). In the study in LI-03-0164, tumor-bearing animals were treated for 22 days. No significant difference in tumor growth inhibition or body weight was observed in this study (P > 0.05).
DISCUSSION
In this study, we have established a large collection of serially transplantable PDX models for HCC. The collection of PDX models recapitulates the features of the original tumors, including histopathology, gene expression profiles, mutational status, DNA CNA, and a serum biomarker, making it an excellent tool for study of HCC and drug discovery.
An earlier study showed that the differences of gene expression between xenografts and original patient samples were relatively low through the passages up to P9 [21]. In the present study, we characterized gene expression profiles of xenografts collected at P3, at which passage the tumor materials usually become sufficient to perform robust efficacy studies. The results demonstrate that xenografts accurately reflect the global expression profiles of the original tumors with limited changes. In agreement with earlier studies of colorectal cancer [21], among the genes down-regulated in xenografts with respect to patient tumors, we observed enrichment in genes encoding for extracellular matrix components, cell adhesion molecules, and immune system regulators (Supplemental Table 1). The data suggest that modification of gene expression in xenografts is attributable to the loss of the human stromal components and the infiltration of mouse stromal cells. Conversely, genes associated with cell cycle and DNA replication were up-regulated in PDX tissues, suggesting that the enrichment of the tumorigenic cell population. Overall, despite of the limited differences caused by the distinct tumor microenvironment, PDX tissues authentically retain the gene expression patterns of the original tumors.
It is noteworthy that enhancer of zeste homolog 2 (EZH2) is one of 72 genes upregulated in xenografts. EZH2 plays an important role in HCC tumorigenesis [22] and its up-regulation was associated with HCC progression and metastasis [23, 24]. Moreover, EZH2 regulates the self-renewal and differentiation of murine hepatic stem/progenitor cells [25] and tumor-initiating HCC cells are highly dependent on EZH2 for their tumorigenic activity [26]. It has been shown that EZH2 concordantly silences the Wnt pathway antagonists operating at several subcellular compartments, which in turn activate Wnt/β-catenin signaling in HCC, and concomitant overexpression of EZH2 and β-catenin was observed in one-third of HCC cases and significantly correlated with tumor progression [23]. Furthermore, Short-hairpin RNA and pharmacological inhibition of EZH2 impaired HCC cell growth and anchorage-independent sphere formation of HCC cells in culture [26]. Knockdown of EZH2 in HCC cell lines suppressed HCC motility in vitro and pulmonary metastasis in an athymic mouse model [24]. Collectively, considering of the enrichment of tumorigenic cancer cells at xenotransplanation, our findings agree that pharmacological interference with EZH2 might be a promising therapeutic approach to targeting HCC.
Mutations in various genes have been reported in primary HCC specimen, including TP53, CTNNB1, AXIN1, RB1, TP73, CDKN2A, KRAS and IGF2R [17–19]. In agreement with the literature, WES analyses revealed that these genes were frequently mutated in 56 PDX models with an incidence of 75%, 14%, 14%, 7%, 5%, 4%, 2%, and 2%, respectively. Therefore, our data obtained from PDX models confirm the potential linkage of these genes with HCC development and progression.
In addition to identifying known mutations in HCC, a number of novel SNPs and indels were uncovered through WES of PDX samples. Most notably, phosphodiesterase 4D interacting protein (PDE4DIP) gene ranks on the top of genetic alterations (i.e., SNPs and indels; Supplemental Table 2), showing 190 genetic alterations in all of 56 models tested (100%). These alterations include 1 insertion, 19 deletions, and 170 SNPs. The protein encoded by PDE4DIP serves to anchor phosphodiesterase 4D to the Golgi/centrosome region of the cell. PDE4DIP was reported to fuse to PDGRFB gene in myeloproliferative disorders [27]. The expression of serum PDE4DIP protein was linked to esophageal squamous cell carcinoma [28]. The potential role of PDE4DIP in HCC tumorigenesis requires further investigation. Moreover, alterations of SARM1 gene were frequently observed in PDX models with 111 SNPs and 1 deletion in 55 models (98%). SARM1 is a negative regulator of MYD88- and TRIF-dependent toll-like receptor signalling pathway involved in innate immune response. Genetic alterations of this gene were frequently observed in esophageal adenocarcinoma [29], colon and rectal cancer [30], and lung adenocarcinoma [31]. These novel alterations identified in PDX models warrant further studies to explore their biological functions in HCC tumorigenesis. Overall, the spectrum of protein-altering genetic variations in our PDX collection is similar to that reported in the literature for HCC. PDX tumor grafts retain the molecular features of original tumors.
The genomic landscape of HCC, especially CNA, has been extensively characterized in 286 paired tumor and adjacent non-tumor tissues [20]. This work led to identification of 29 amplification peaks and 22 deletion peaks with high confidence [20]. Notably, our overall CNA pattern is consistent with the earlier study (Table 2), indicating that the PDX models recapitulate the genetic CNA landscape of HCC clinical samples. For instance, the oncogenic role of BCL9 and MTDH genes has been established in the recent study [20]. BCL9 encodes B-cell CLL/lymphoma 9, which is involved in the WNT/β-catenin signaling pathway by mediating the recruitment of pypopus to the nuclear β-catenin-TCF complex [32]. An oncogenic role of MTDH gene, which encodes metadherin, has been implicated in a variety of cancer types including HCC [33]. Gene expression and protein expression (assessed by immunohistochemistry) of BCL9 and MTDH correlated with their somatic copy numbers [20]. Inhibition of BCL9 and MTDH expression mediated by siRNA significantly suppressed cell proliferation of HCC cell lines with BCL9 and MTDH gene amplifications, respectively, but not in copy number neutral cell lines [20]. Consistent to the earlier report, the copy number gains of both genes were identified in 60% and 52% of PDX models, respectively, in our study. The frequencies of amplification of both genes ranked on the top of the gene lists identified in PDX models (Table 2), which is in agreement with that both BCL9 and MTDH genes may play an important role in HCC development. In addition, the potential oncogenic role of PRDM14 and FRWD2 genes has been implicated in earlier report [20]. We also found that amplifications of PRDM14 and RFWD2 gene in 41% and 57%, respectively, of PDX models (Supplemental Table 3). Our results support that both genes are worthy the further investigation as oncogenic drivers of HCC.
AFP has been considered a biomarker for prognosis and treatment outcome [5–7]. In this study, similar to clinical patients, a large fraction of HCC models exhibited the elevated levels of serum AFP, demonstrating that PDX models may serve as an in vivo system for evaluating serum AFP in the preclinical setting.
The promise of PDX models is to accelerate the development of novel therapeutics. PDXs derived from HCC patient samples have been utilized for in vivo pharmacological tests of of several drugs, including anti-VEGF antibody bevaciumab [34], mTOR inhibitors sirolimus [35] and everolimus [36], dual inhibitor of VEGFR and FGFR brivanib [37], sorafenib [35, 38, 39], EGFR inhibitor gefitinib [13], MEK1/2 inhibitor AZD6244 [39, 40], VEGFR and PDGFR inhibitor sunitinib [38, 41], VEGFR-2 and C-MET inhibitor foretinib [42], FGFR, VEGFR and PDGFR inhibitor dovitinib [43]. In the present study, we first showed the differential responses to the treatment with sorafenib in two randomly selected models, indicating that the panel of models represents the distinct outcomes of a diverse HCC patient population in clinic.
Developing potential predictive markers to identify the responders in the patient population is the key for the success of clinical development. Molecular characterized PDX models are an excellent in vivo system to explore predicative biomarkers for various targeted agents. As an example, in FGFR1-overexpressing models, LI-03-0010, LI-03-0020, and LI-03-0164, we demonstrated that lenvatinib exhibited antitumor activity greater than sorafenib. Additionally, the treatment with lenvatinib appeared to be better tolerated in animals when compared with sorafenib because the first agent never caused dosing suspension while the latter did that in the model of LI-03-0164. In the tested models, the elevated levels of FGFR1 gene, but not FGFR2 or FGFR3 genes, were detected by expression assays regarding to their basal levels in a panel of PDX models (Figure 2B), suggesting that FGFR1 expression levels may be further investigated as a predictive biomarker for the therapy of lenvatinib.
Lenvatinib was very recently approved by US FDA for the treatment of patients with locally recurrent or metastics, progressive, radioactive iodine-refreactory differentiated thyroid cancer [44]. Lenvatinib is a non-selective tyrosine kinase inhibitor [45]. It selectively targets FGFR1 among FGFR1-4. However, as a multikinase inhibitor, lenvatinib also inhibits VEGFR1-3, PDGFR-α and PDGFR-β [45]. Different from sorafenib, it was speculated that the effects of lenvatinib on thyroid cancer could be mediated by the inhibition of unique targets of lenvantinib, including FGFR1 [44]. Further studies are warranted to elucidate the mechanism of action for tumor growth inhibition in FGFR1-overexpressing HCC PDX models, and to confirm the genomic correlation of the drug sensitivity with overexpression of FGFR1 gene. Clearly, our results demonstrated that such a sub-population of HCC patients may respond to the treatment with lenvatinib better than sorafenib. Overall, our data provide evidence that FGF/FGFR pathway is a therapeutic target for the treatment of a subpopulation of HCC patients. Especially, as lenvatinib is recently approved by FDA for the treatment of patients with thyroid cancer, a rapid clinical development of the drug in HCC may become feasible.
In conclusion, we have developed an extensive panel of PDX models for HCC, which authentically maintain the histopathological and molecular characteristics of the original tumors. Such a panel of molecularly characterized animal models for HCC provides an excellent opportunity to study the biology of HCC, to develop novel therapy, as well as to facilitate research of personalized medicine.
ACKNOWLEDGMENTS
The authors are grateful to Yunbiao Yan, Guizhu Yang, Yan Xue, Jingliang Li, Xu Chen, Zhao Yuan, Bei Wang, Xi Wang, Dan Lu, Yuling Guo, Qin Hong, Xing Ding, Zhengyuan Wu, Chen Chen, Jun Rong, Yan Lu, Qing Xu, and Xiangying Xia of WuXi AppTec for excellent technical supports of this work.
CONFLICTS OF INTEREST
The majorities of authors are employees of WuXi AppTec Co., Ltd. and hold stock in WuXi AppTec.
GRANT SUPPORT
This work was partially supported by the National Basic Research Program of China (973 Program) Grant No. 2012CB724500 to SHC, and the program of Shanghai Municipal Commission of Health (XBR2013090) and the program of Shanghai subject chief scientist (14XD1400100) to YT.
REFERENCES
1. Jemal A, Bray F, Center MM, Ferlay J, Ward E, Forman D. Global cancer statistics. CA Cancer J Clin. 2011; 61:69–90.
2. El-Serag HB. Hepatocellular carcinoma. N Engl J Med. 2011; 365:1118–1127.
3. Yang JD, Roberts LR. Hepatocellular carcinoma: A global view. Nat Rev Gastroenterol Hepatol. 2010; 7:448–458.
4. Zhu AX. Molecularly targeted therapy for advanced hepatocellular carcinoma in 2012. current status and future perspectives. Semin Oncol. 2012; 39:493–502.
5. Shao YY, Lin ZZ, Hsu C, Shen YC, Hsu CH, Cheng AL. Early alpha-fetoprotein response predicts treatment efficacy of antiangiogenic systemic therapy in patients with advanced hepatocellular carcinoma. Cancer. 2010; 116:4590–4596.
6. Yau T, Yao TJ, Chan P, Wong H, Pang R, Fan ST, Poon RT. The significance of early alpha-fetoprotein level changes in predicting clinical and survival benefits in advanced hepatocellular carcinoma patients receiving sorafenib. Oncologist. 2011; 16:1270–1279.
7. Personeni N, Bozzarelli S, Pressiani T, Rimassa L, Tronconi MC, Sclafani F, Carnaghi C, Pedicini V, Giordano L, Santoro A. Usefulness of alpha-fetoprotein response in patients treated with sorafenib for advanced hepatocellular carcinoma. J Hepatol. 2012; 57:101–107.
8. Li Y, Tang ZY, Hou JX. Hepatocellular carcinoma: insight from animal models. Nat Rev Gastroenterol Hepatol. 2012; 9:32–43.
9. Tentler JJ, Tan AC, Weekes CD, Jimeno A, Leong S, Pitts TM, Arcaroli JJ, Messersmith WA, Eckhardt SG. Patient-derived tumour xenografts as models for oncology drug development. Nat Rev Clin Oncol. 2012; 9:338–350.
10. Sun FX, Tang ZY, Lui KD, Ye SL, Xue Q, Gao DM, Ma ZC. Establishment of a metastatic model of human hepatocellular carcinoma in nude mice via orthotopic implantation of histologically intact tissues. Int J Cancer. 1996; 66:239–243.
11. Gao YS, Chen XP, Li KY, Wu ZD. Nude mice model of human hepatocellular carcinoma via orthotopic implantation of histologically intact tissue. World J Gastroenterol. 2004; 10:3107–3111.
12. Armengol C, Tarafa G, Boix L, Sole M, Queralt R, Costa D, Bachs O, Bruix J, Capella G. Orthotopic implantation of human hepatocellular carcinoma in mice: analysis of tumor progression and establishment of the BCLC-9 cell line. Clin Cancer Res. 2004; 10:2150–2157.
13. Huynh H, Soo KC, Chow PK, Panasci L, Tran E. Xenografts of human hepatocellular carcinoma: a useful model for testing drugs. Clin Cancer Res. 2006; 12:4306–4314.
14. Fang DD, Zhang B, Gu Q, Lira M, Xu Q, Sun H, Qian M, Sheng W, Ozeck M, Wang Z, Zhang C, Chen X, Chen KX, Li J, Chen SH, Christensen J, et al. HIP1-ALK, a novel ALK fusion variant that responds to crizotinib. J Thorac Oncol. 2014; 9:285–294.
15. Fang DD, Gao YB, Xu Q, Sun HY, Zhang B, Chen ZL, et al. Identification of somatic mutations in esophageal squamous cell carcinoma and corresponding xenograft by next-generation sequencing [abstract]. In: Proceedings of the 103rd Annual Meeting of the American Association for Cancer Research, 2012.
16. Xu Q, Wang G, Fang DD, Gao YB, Chen YD, Sun LL, et al. Deep sequencing of Xenografts and case-matched blood and primary tumors reveals a 20 folds enrichment of loss of heterozygosity versus somatic mutations suggesting LOH plays an ever important role in tumorigenesis [abstract]. In: Proceedings of the 103rd Annual Meeting of the American Association for Cancer Research, 2012.
17. Fujimoto A, Totoki Y, Abe T, Boroevich KA, Hosoda F, Nguyen HH, Aoki M, Hosono N, Kubo M, Miya F, Arai Y, Takahashi H, Shirakihara T, Nagasaki M, Shibuya T, Nakano K, et al. Whole-genome sequencing of liver cancers identifies etiological influences on mutation patterns and recurrent mutations in chromatin regulators. Nat Genet. 2012; 44:760–764.
18. Zhang Z. Genomic landscape of liver cancer. Nat Genet. 2012; 44:1075–1077.
19. Li S, Mao M. Next generation sequencing reveals genetic landscape of hepatocellular carcinomas. Cancer Lett. 2013; 340:247–253.
20. Wang K, Lim HY, Shi S, Lee J, Deng S, Xie T, Zhu Z, Wang Y, Pocalyko D, Yang WJ, Rejto PA, Mao M, Park CK, Xu J. Genomic landscape of copy number aberrations enables the identification of oncogenic drivers in hepatocellular carcinoma. Hepatology. 2013; 58:706–717.
21. Julien S, Merino-Trigo A, Lacroix L, Pocard M, Goere D, Mariani P, Landron S, Bigot L, Nemati F, Dartigues P, Weiswald LB, Lantuas D, Morgand L, Pham E, Gonin P, Dangles-Marie V, et al. Characterization of a large panel of patient-derived tumor xenografts representing the clinical heterogeneity of human colorectal cancer. Clin Cancer Res. 2012; 18:5314–5328.
22. Chen Y, Lin MC, Yao H, Wang H, Zhang AQ, Yu J, Hui CK, Lau GK, He ML, Sung J, Kung HF. Lentivirus-mediated RNA interference targeting enhancer of zeste homolog 2 inhibits hepatocellular carcinoma growth through down-regulation of stathmin. Hepatology. 2007; 46:200–208.
23. Cheng AS, Lau SS, Chen Y, Kondo Y, Li MS, Feng H, Ching AK, Cheung KF, Wong HK, Tong JH, Jin H, Choy KW, Yu J, To KF, Wong N, Huang TH, et al. EZH2-mediated concordant repression of Wnt antagonists promotes beta-catenin-dependent hepatocarcinogenesis. Cancer Res. 2011; 71:4028–4039.
24. Au SL, Wong CC, Lee JM, Fan DN, Tsang FH, Ng IO, Wong CM. Enhancer of zeste homolog 2 epigenetically silences multiple tumor suppressor microRNAs to promote liver cancer metastasis. Hepatology. 2012; 56:622–631.
25. Aoki R, Chiba T, Miyagi S, Negishi M, Konuma T, Taniguchi H, Ogawa M, Yokosuka O, Iwama A. The polycomb group gene product Ezh2 regulates proliferation and differentiation of murine hepatic stem/progenitor cells. J Hepatol. 2010; 52:854–863.
26. Chiba T, Suzuki E, Negishi M, Saraya A, Miyagi S, Konuma T, Tanaka S, Tada M, Kanai F, Imazeki F, Iwama A, Yokosuka O. 3-Deazaneplanocin A is a promising therapeutic agent for the eradication of tumor-initiating hepatocellular carcinoma cells. Int J Cancer. 2012; 130:2557–2567.
27. Wilkinson K, Velloso ER, Lopes LF, Lee C, Aster JC, Shipp MA, Aguiar RC. Cloning of the t(1, 5)(q23;q33) in a myeloproliferative disorder associated with eosinophilia: involvement of PDGFRB and response to imatinib. Blood. 2003; 102:4187–4190.
28. Shimada H, Kuboshima M, Shiratori T, Nabeya Y, Takeuchi A, Takagi H, Nomura F, Takiguchi M, Ochiai T, Hiwasa T. Serum anti-myomegalin antibodies in patients with esophageal squamous cell carcinoma. Int J Oncol. 2007; 30:97–103.
29. Dulak AM, Stojanov P, Peng S, Lawrence MS, Fox C, Stewart C, Bandla S, Imamura Y, Schumacher SE, Shefler E, McKenna A, Carter SL, Cibulskis K, Sivachenko A, Saksena G, Voet D, et al. Exome and whole-genome sequencing of esophageal adenocarcinoma identifies recurrent driver events and mutational complexity. Nat Genet. 2013; 45:478–486.
30. Muzny DM, Bainbridge MN, Chang K, Dinh HH, Drummond JA, Fowler G, Kovar CL, Lewis LR. Comprehensive molecular characterization of human colon and rectal cancer. Nature. 2012; 487:330–337.
31. Imielinski M, Berger AH, Hammerman PS, Hernandez B, Pugh TJ, Hodis E, Cho J, Suh J, Capelletti M, Sivachenko A, Sougnez C, Auclair D, Lawrence MS, Stojanov P, Cibulskis K, Choi K, et al. Mapping the hallmarks of lung adenocarcinoma with massively parallel sequencing. Cell. 2012; 150:1107–1120.
32. Kramps T, Peter O, Brunner E, Nellen D, Froesch B, Chatterjee S, Murone M, Zullig S, Basler K. Wnt/wingless signaling requires BCL9/legless-mediated recruitment of pygopus to the nuclear beta-catenin-TCF complex. Cell. 2002; 109:47–60.
33. Yoo BK, Emdad L, Su ZZ, Villanueva A, Chiang DY, Mukhopadhyay ND, Mills AS, Waxman S, Fisher RA, Llovet JM, Fisher PB, Sarkar D. Astrocyte elevated gene-1 regulates hepatocellular carcinoma development and progression. J Clin Invest. 2009; 119:465–477.
34. Huynh H, Chow PK, Palanisamy N, Salto-Tellez M, Goh BC, Lee CK, Somani A, Lee HS, Kalpana R, Yu K, Tan PH, Wu J, Soong R, Lee MH, Hor H, Soo KC, et al. Bevacizumab and rapamycin induce growth suppression in mouse models of hepatocellular carcinoma. J Hepatol. 2008; 49:52–60.
35. Wang Z, Zhou J, Fan J, Qiu SJ, Yu Y, Huang XW, Tang ZY. Effect of rapamycin alone and in combination with sorafenib in an orthotopic model of human hepatocellular carcinoma. Clin Cancer Res. 2008; 14:5124–5130.
36. Huynh H, Chow KH, Soo KC, Toh HC, Choo SP, Foo KF, Poon D, Ngo VC, Tran E. RAD001 (everolimus) inhibits tumour growth in xenograft models of human hepatocellular carcinoma. J Cell Mol Med. 2009; 13:1371–1380.
37. Huynh H, Ngo VC, Fargnoli J, Ayers M, Soo KC, Koong HN, Thng CH, Ong HS, Chung A, Chow P, Pollock P, Byron S, Tran E. Brivanib alaninate, a dual inhibitor of vascular endothelial growth factor receptor and fibroblast growth factor receptor tyrosine kinases, induces growth inhibition in mouse models of human hepatocellular carcinoma. Clin Cancer Res. 2008; 14:6146–6153.
38. Huynh H, Choo SP, Toh HC, Tai WM, Chung AY, Chow PK, Ong R, Soo KC. Comparing the efficacy of sunitinib with sorafenib in xenograft models of human hepatocellular carcinoma: mechanistic explanation. Curr Cancer Drug Targets. 2011; 11:944–953.
39. Huynh H, Ngo VC, Koong HN, Poon D, Choo SP, Toh HC, Thng CH, Chow P, Ong HS, Chung A, Goh BC, Smith PD, Soo KC. AZD6244 enhances the anti-tumor activity of sorafenib in ectopic and orthotopic models of human hepatocellular carcinoma (HCC). J Hepatol. 2010; 52:79–87.
40. Huynh H, Soo KC, Chow PK, Tran E. Targeted inhibition of the extracellular signal-regulated kinase kinase pathway with AZD244 (ARRY-14288) in the treatment of hepatocellular carcinoma. Mol Cancer Ther. 2007; 6:138–146.
41. Huynh H, Ngo VC, Choo SP, Poon D, Koong HN, Thng CH, Toh HC, Zheng L, Ong LC, Jin Y, Song IC, Chang AP, Ong HS, Chung AY, Chow PK, Soo KC. Sunitinib (SUTENT, SU11248) suppresses tumor growth and induces apoptosis in xenograft models of human hepatocellular carcinoma. Curr Cancer Drug Targets. 2009; 9:738–747.
42. Huynh H, Ong R, Soo KC. Foretinib demonstrates anti-tumor activity and improves overall survival in preclinical models of hepatocellular carcinoma. Angiogenesis. 2012; 15:59–70.
43. Huynh H, Chow PK, Tai WM, Choo SP, Chung AY, Ong HS, Soo KC, Ong R, Linnartz R, Shi MM. Dovitinib demonstrates antitumor and antimetastatic activities in xenograft models of hepatocellular carcinoma. J Hepatol. 2012; 56:595–601.
44. Lenvatinib approved for certain thyroid cancers: Cancer Discov. 2015; 5:338.
45. Dieci MV, Arnedos M, Andre F, Soria JC. Fibroblast growth factor receptor inhibitors as a cancer treatment: from a biologic rationale to medical perspectives. Cancer Discov. 2013; 3:264–279.