
INTRODUCTION
To date, numerous breast cancer prognostic factors have been identified, including tumor size, degree of axillary lymph node (LN) involvement, age, histologic grade, hormone receptor (HoR) status, HER2/neu status, and the presence of lymphovascular invasion [1]. However, it is difficult to predict metastasis and outcomes in this heterogeneous disease. Given the urgent need for individually tailored therapy, cancer-specific outcomes must be estimated more accurately.
Traditionally, tumor size has served as one of the most powerful prognostic factors in breast cancer [2, 3, 4]; accordingly, this factor serves as the basis of major staging systems [5, 6, 7]. Increasing tumor size has been reported to be associated with increased breast cancer-specific mortality (BCSM) within each joint estrogen receptor (ER) and progesterone receptor (PR) status category [8, 9]. However, these data are from studies in which the investigators placed all stage T3 tumors (>5 cm) in one category [8, 9]. The prognostic value of tumor size is currently being reconsidered. In particular, the view that breast tumor size correlates with survival in all subtypes of breast cancer has been questioned [10]. Indeed, several studies have noted that this pattern does not hold for small breast tumors [11, 12, 13] and that luminal breast cancer is a highly heterogeneous disease [14]. The fact that luminal tumors are ER and/or PR positive prompted us to estimate the impact of HoR status on the prognostic value of large tumor size by another means. As limited study population sizes and recruitment periods have impeded subgroup analyses, we utilized Surveillance, Epidemiology, and End Results (SEER) population-based data to further clarify the impact of tumor size and HoR status on breast cancer prognosis. Therefore, we developed a more complete understanding of the impact of tumor size on survival over a wider size range. ER and PR are correlated in breast cancer and converge on common pathways, and there is increasing awareness that progesterone is an important hormone in breast cancer [15, 16]. Accordingly, HoR status was analyzed as the joint ER and PR status in our study.
RESULTS
Clinicopathologic patient parameters
In total, 328, 870 eligible female patients with invasive breast cancer were enrolled; 36, 509 of these patients died of breast cancer. The median follow-up period was 68 months. HoR status was analyzed based on joint ER and PR statuses (ER+PR+, ER+PR−, ER−PR+, and ER−PR−). Patient demographics and pathologic features based on ER/PR phenotypes are summarized in Table 1.
Clinicopathologic differences between groups
As illustrated in Table 1, 63.82% (n = 209, 883) of the patients were ER+PR+, 11.96% (n = 39, 336) were ER+PR−, 1.9% (n = 6, 252) were ER−PR+, and 22.32% (n = 73, 399) were ER−PR−. There were statistically significant differences in all the variables across the four groups (P < 0.001). Compared with the ER−PR− group, the ER+PR+ group had smaller tumors (more tumors ≤2 cm in size: 70% vs 49.7%), less advanced disease (more grade I and II: 69.9% vs 19.4%) and less lymph node involvement (fewer positive nodes: 31.6% vs 37.7%).
Impact of tumor size on breast cancer survival outcomes
Kaplan-Meier analysis was used to determine breast cancer-specific survival (BCSS) in the groups based on tumor size (Figure 1A). Individual survival curves for the four ER/PR joint subgroups were generated (Figure 1B–C; Figure S1A–B). As expected, patients with 0 to 10 mm tumors exhibited the best survival rates (Figure 1A), while those with tumors greater than 80 mm exhibited the worst survival rates in the entire study cohort (P < 0.001). Unexpectedly, the stratified analysis indicated that patients with ER+PR+ tumors in the 50 to 80 mm groups experienced similar survival rates, whereas ER−PR− patients experienced increased breast cancer-specific mortality (BCSM) as tumor size increased throughout all size categories (P < 0.001).
We used the 61 to 70 mm group as the reference for univariate and multivariate analyses based on the Kaplan-Meier results. In the univariate analysis, the year of diagnosis, race, marital status, age, laterality, tumor size, tumor grade, ER and PR statuses, LN status and history of radiation were significantly associated with BCSS (P < 0.001). A multivariate analysis was performed using the Cox regression model. All the factors mentioned above were identified as independent prognostic factors (Table 2), including year of diagnosis (1996–2000, hazard ratio (HR) 0.760, 95% confidence interval (CI) 0.737–0.783; 2001–2005, HR 0.625, 95% CI 0.607–0.643; 2006–2010, HR 0.514, 95% CI 0.495–0.533), race (African-American, HR 1.296, 95% CI 1.258–1.336; others, HR 0.852, 95% CI 0.818–0.888), marital status (not married, HR 1.143, 95% CI 1.118–1.168), age (30–39 years, HR 0.893, 95% CI 0.806–0.988; 40–49 years, HR 0.770, 95% CI 0.698–0.850; 50–59 years, HR 0.827, 95% CI 0.750–0.913; 60–69 years, HR 0.968, 95% CI 0.877–1.069; 70–79 years, HR 1.255, 95% CI 1.136–1.387; > 80 years, HR 1.847, 95% CI 1.668–2.045), laterality (right, HR 0.971, 95% CI 0.951–0.991), grade (II, HR 1.960, 95% CI 1.853–2.074; III and undifferentiated, HR 2.928, 95% CI 2.767–3.098), HoR status (ER+PR−, HR 1.554, 95% CI 1.280–1.887; ER−PR+, HR 1.687, 95% CI 1.175–2.423; ER−PR−, HR 1.982, 95% CI 1.729–2.273), tumor size (0–10 mm, HR 0.185, 95% CI 0.164–0.208; 11–20 mm, HR 0.324, 95% CI 0.290–0.361; 21–30 mm, HR 0.545, 95% CI 0.489–0.607; 31–40 mm, HR 0.755, 95% CI 0.675–0.845; 41–50 mm, HR 0.845, 95% CI 0.750–0.953; 51–60 mm, HR 0.911, 95% CI 0.801–1.038; 71–80 mm, HR 1.160, 95% CI 0.994–1.354; > 80 mm, HR 1.079, 95% CI 0.931–1.249), LN involvement (positive, HR 2.478, 95% CI 2.422–2.536) and history of radiation (no radiation, HR 1.176, 95% CI 1.150–1.201). In the univariate analysis, a straightforward dose-effect relationship was observed between larger tumor size and increasing BCSM; however, the HR observed in the multivariate analysis was piecewise. For tumors less than 51 mm in size, the HR for BCSM increased with size from 0.185 (P < 0.001) in the 0–10 mm group to 0.845 (P = 0.006) in the 41–50 mm group. Thereafter, the HRs were not significantly different in the 51–60 mm group (HR 0.911, 95% CI 0.801–1.038, P = 0.161), the 71–80 mm group (HR 1.160, 95% CI 0.994–1.354, P = 0.059) or the > 80 mm group (HR 1.079, 95% CI 0.931–1.249, P = 0.313). These results were essentially consistent with the aforementioned Kaplan-Meier analysis.
Interaction between tumor size and HoR status regarding BCSM
There was a significant interaction between tumor size and HoR status in determining BCSM in the multivariate analysis (P < 0.001; Table 2). The relationship between continuous tumor size and BCSS stratified by ER/PR status was illustrated by a pairwise comparison (Table 3) that revealed differing patterns in the prognostic value of tumor size. In the ER+PR+ group, the HRs for BCSM increased with increasing tumor size until a threshold was reached (approximately 50 mm) (0–10 mm, HR 0.176, 95% CI 0.156–0.198, P < 0.001; 11–20 mm, HR 0.308, 95% CI 0.276–0.343, P < 0.001; 21–30 mm, HR 0.525, 95% CI 0.471–0.585, P < 0.001; 31–40 mm, HR 0.739, 95% CI 0.660–0.827, P < 0.001; 41–50 mm, HR 0.831, 95% CI 0.737–0.936, P = 0.002). Thereafter, increasing tumor size was no longer related to increased BCSM (51–60 mm, HR 0.904, 95% CI 0.794–1.029, P = 0.127; 71–80 mm, HR 1.139, 95% CI 0.976–1.329, P = 0.099; > 80 mm, HR 1.070, 95% CI 0.923–1.239, P = 0.370). In the entire cohort, the HRs of BCSM were plotted against the different tumor size groups (Figure 2A). The graphed HRs for the ER+PR+ subgroup formed a gradually rising curve that plateaued at the maximum value (Table 3; HR estimates, R-squared (R2) values = 0.999; 95% CI, R2 values = 0.984 and 0.989; Figure 2B). Similar patterns were observed for the ER+PR− and ER−PR+ subgroups (Table 3; Figure S2A–S2B), with the > 80 mm tumor groups exhibiting borderline significance (ER+PR−, HR 1.253, 95% CI 1.009–1.555, P = 0.041; ER−PR+, HR 1.590, 95% CI 1.012–2.498, P = 0.044). The HRs for the patients with ER+PR− or ER−PR+ tumors had wide 95% CIs because of the relatively small sample size. The above results suggested that larger tumors (>51 mm) with ER+ and/or PR+ phenotypes potentially represent a unique tumor subtype with an invariable prognosis.
Table 1: Demographic and tumor characteristics of the study cohort
Characteristics |
Number of patients (%) |
P-valuea |
||||
Total |
ER+PR+ |
ER+PR− |
ER−PR+ |
ER−PR− |
||
(N = 328870) |
(N = 209883) |
(N = 39336) |
(N = 6252) |
(N = 73399) |
||
Year of diagnosis |
< 0.001 |
|||||
1990–1995 |
38666 (11.8) |
23991 (11.4) |
4922 (12.5) |
1580 (25.3) |
8173 (11.1) |
|
1996–2000 |
55713 (16.9) |
35389 (16.9) |
6501 (16.5) |
1424 (22.8) |
12399 (16.9) |
|
2001–2005 |
102695 (31.2) |
63788 (30.4) |
12589 (32.0) |
1736 (27.8) |
24582 (33.5) |
|
2006–2010 |
131796 (40.1) |
86715 (41.3) |
15324 (39.0) |
1512 (24.2) |
28245 (38.5) |
|
Race |
< 0.001 |
|||||
White |
269184 (81.9) |
176257 (84.0) |
32330 (82.2) |
4822 (77.1) |
55775 (76.0) |
|
Black |
30898 (9.4) |
14797 (7.1) |
3772 (9.6) |
814 (13.0) |
11515 (15.7) |
|
Otherb |
27362 (8.3) |
17845 (8.5) |
3085 (7.8) |
595 (9.5) |
5837 (8.0) |
|
Unknown |
1426 (0.4) |
984 (0.5) |
149 (0.4) |
21 (0.3) |
272 (0.4) |
|
Marital status |
< 0.001 |
|||||
Married |
190628 (58.0) |
121717 (58.0) |
21928 (55.7) |
3839 (61.4) |
43144 (58.8) |
|
Not marriedc |
128172 (39.0) |
81633 (38.9) |
16271 (41.4) |
2260 (36.1) |
28008 (38.2) |
|
Unknown |
10070 (3.1) |
6533 (3.1) |
1137 (2.9) |
153 (2.4) |
2247 (3.1) |
|
Age |
< 0.001 |
|||||
< 20 |
2078 (0.6) |
988 (0.5) |
209 (0.5) |
72 (1.2) |
809 (1.1) |
|
30–39 |
20890 (6.4) |
10925 (5.2) |
1952 (5.0) |
762 (12.2) |
7251 (9.9) |
|
40–49 |
68460 (20.8) |
43766 (20.9) |
5593 (14.2) |
1908 (30.5) |
17193 (23.4) |
|
50–59 |
83461 (25.4) |
50672 (24.1) |
10384 (26.4) |
1580 (25.3) |
20825 (28.4) |
|
60–69 |
71716 (21.8) |
47215 (22.5) |
9562 (24.3) |
993 (15.9) |
13946 (19.0) |
|
70–79 |
53309 (16.2) |
36499 (17.4) |
7328 (18.6) |
604 (9.7) |
8878 (12.1) |
|
>80 |
28956 (8.8) |
19818 (9.4) |
4308 (11.0) |
333 (5.3) |
4497 (6.1) |
|
Laterality |
< 0.001 |
|||||
Left |
167111 (50.81) |
105943 (50.5) |
20013 (50.9) |
3276 (52.4) |
37879 (51.6) |
|
Right |
161721 (49.17) |
103913 (49.5) |
19322 (49.1) |
2976 (47.6) |
35510 (48.4) |
|
Only one side NOS |
38 (0.00011555) |
27 (0.0) |
1 (0.0) |
0 (0.0) |
10 (0.0) |
|
Grade |
< 0.001 |
|||||
I |
55743 (16.9) |
47729 (22.7) |
6123 (15.6) |
432 (6.9) |
1459 (2.0) |
|
II |
129182 (39.3) |
98963 (47.2) |
15785 (40.1) |
1666 (26.6) |
12768 (17.4) |
|
III and UD |
129279 (39.3) |
53997 (25.7) |
15566 (39.6) |
3747 (59.9) |
55969 (76.3) |
|
Unknown |
14666 (4.5) |
9194 (4.4) |
1862 (4.7) |
407 (6.5) |
3203 (4.4) |
|
Tumor size (mm) |
< 0.001 |
|||||
0–10 |
84296 (25.6) |
59931 (28.6) |
10552 (26.8) |
1281 (20.5) |
12532 (17.1) |
|
11–20 |
127576 (38.8) |
86909 (41.4) |
14452 (36.7) |
2300 (36.8) |
23915 (32.6) |
|
21–30 |
65348 (19.9) |
37914 (18.1) |
7755 (19.7) |
1408 (22.5) |
18271 (24.9) |
|
31–40 |
24587 (7.5) |
12487 (5.9) |
3059 (7.8) |
567 (9.1) |
8474 (11.5) |
|
41–50 |
11410 (3.5) |
5567 (2.7) |
1465 (3.7) |
273 (4.4) |
4105 (5.6) |
|
51–60 |
6507 (2.0) |
3019 (1.4) |
835 (2.1) |
168 (2.7) |
2485 (3.4) |
|
61–70 |
3316 (1.0) |
1537 (0.7) |
416 (1.1) |
94 (1.5) |
1269 (1.7) |
|
71–80 |
2335 (0.7) |
1075 (0.5) |
297 (0.8) |
73 (1.2) |
890 (1.2) |
|
>80 |
3495 (1.1) |
1444 (0.7) |
505 (1.3) |
88 (1.4) |
1458 (2.0) |
|
Regional nodes |
< 0.001 |
|||||
Negative |
213746 (65.0) |
139868 (66.6) |
25294 (64.3) |
3794 (60.7) |
44790 (61.0) |
|
Positive |
109817 (33.4) |
66427 (31.6) |
13347 (33.9) |
2347 (37.5) |
27696 (37.7) |
|
Unknown |
5307 (1.6) |
3588 (1.7) |
695 (1.8) |
111 (1.8) |
913 (1.2) |
|
Radiation |
< 0.001 |
|||||
Yes |
172895 (52.6) |
113858 (54.2) |
19986 (50.8) |
3026 (48.4) |
36025 (49.1) |
|
No |
146850 (44.7) |
90665 (43.2) |
18265 (46.4) |
3053 (48.8) |
34867 (47.5) |
|
Unknown |
9125 (2.8) |
5360 (2.6) |
1085 (2.8) |
173 (2.8) |
2507 (3.4) |
|
Abbreviations: ER, estrogen receptor; PR, progesterone receptor, UD, undifferentiated
a.P value of the χ2 test comparing the ER+PR+, ER+PR−, ER−PR+ and ER−PR− groups
b.Including American Indian/Alaskan native, and Asian/Pacific Islander
c.Including divorced, separated, single (never married), and widowed.
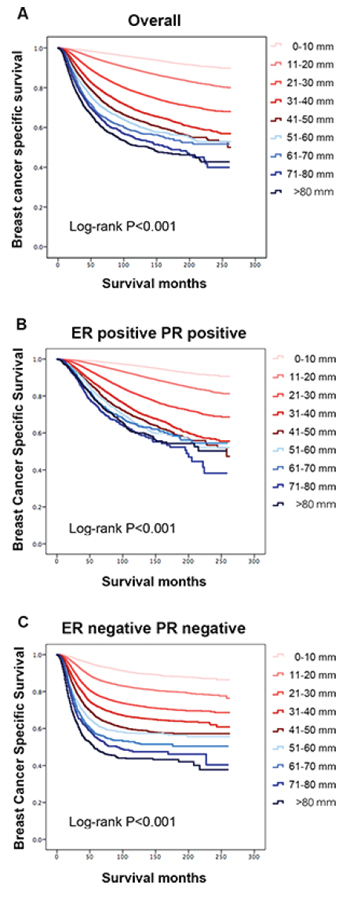
Figure 1: Patient survival curves according to tumor size. A. The entire cohort, P < 0.001. B. The estrogen receptor (ER)-positive and progesterone receptor (PR)-positive group, P < 0.001. C. The ER-negative and PR-negative group, P < 0.001.
Table 2: Cox proportional hazards regression model analysis of breast cancer-specific mortality
Variables |
Univariate analysis |
Multivariate analysis |
||
HR (95% CI) |
P-value |
HR (95% CI) |
P-value |
|
Hormone receptor status |
||||
ER+PR+ |
Reference |
– |
Reference |
– |
ER+PR− |
1.663 (1.611–1.717) |
< 0.001 |
1.554 (1.280–1.887) |
< 0.001 |
ER−PR+ |
2.151 (2.028–2.280) |
< 0.001 |
1.687 (1.175–2.423) |
0.005 |
ER−PR− |
2.694 (2.634–2.756) |
< 0.001 |
1.982 (1.729–2.273) |
< 0.001 |
Year of diagnosis |
||||
1990–1995 |
Reference |
– |
Reference |
– |
1996–2000 |
0.701 (0.681–0.721) |
< 0.001 |
0.760 (0.737–0.783) |
< 0.001 |
2001–2005 |
0.593 (0.577–0.610) |
< 0.001 |
0.625 (0.607–0.643) |
< 0.001 |
2006–2010 |
0.472 (0.456–0.489) |
< 0.001 |
0.514 (0.495–0.533) |
< 0.001 |
Race |
||||
White |
Reference |
– |
Reference |
– |
Black |
1.820 (1.767–1.874) |
< 0.001 |
1.296 (1.258–1.336) |
< 0.001 |
Othera |
0.860 (0.826–0.896) |
< 0.001 |
0.852 (0.818–0.888) |
< 0.001 |
Unknown |
0.338 (0.253–0.453) |
< 0.001 |
0.361 (0.270–0.484) |
< 0.001 |
Marital status |
||||
Married |
Reference |
– |
Reference |
– |
Not marriedb |
1.379 (1.351–1.409) |
< 0.001 |
1.143 (1.118–1.168) |
< 0.001 |
Unknown |
1.194 (1.121–1.271) |
< 0.001 |
1.107 (1.039–1.179) |
0.002 |
Age |
||||
< 20 |
Reference |
– |
Reference |
– |
30–39 |
0.766 (0.692–0.848) |
< 0.001 |
0.893 (0.806–0.988) |
0.028 |
40–49 |
0.497 (0.450–0.548) |
< 0.001 |
0.770 (0.698–0.850) |
< 0.001 |
50–59 |
0.453 (0.411–0.500) |
< 0.001 |
0.827 (0.750–0.913) |
< 0.001 |
60–69 |
0.448 (0.406–0.494) |
< 0.001 |
0.968 (0.877–1.069) |
0.518 |
70–79 |
0.545 (0.493–0.601) |
< 0.001 |
1.255 (1.136–1.387) |
< 0.001 |
>80 |
0.904 (0.817–0.999) |
0.048 |
1.847 (1.668–2.045) |
< 0.001 |
Laterality |
||||
Left |
Reference |
– |
Reference |
– |
Right |
0.959 (0.940–0.979) |
< 0.001 |
0.971 (0.951–0.991) |
0.005 |
Only one side, NOS |
0.853 (0.275–2.644) |
0.782 |
1.011 (0.326–3.137) |
0.984 |
Grade |
||||
I |
Reference |
– |
Reference |
– |
II |
3.074 (2.907–3.251) |
< 0.001 |
1.960 (1.853–2.074) |
< 0.001 |
III and UD |
7.277 (6.895–7.680) |
< 0.001 |
2.928 (2.767–3.098) |
< 0.001 |
Unknown |
4.935 (4.618–5.272) |
< 0.001 |
2.353 (2.198–2.520) |
< 0.001 |
Tumor size (mm) |
||||
0–10 |
0.077 (0.072–0.083) |
< 0.001 |
0.185 (0.164–0.208) |
< 0.001 |
11–20 |
0.184 (0.173–0.197) |
< 0.001 |
0.324 (0.290–0.361) |
< 0.001 |
21–30 |
0.399 (0.375–0.426) |
< 0.001 |
0.545 (0.489–0.607) |
< 0.001 |
31–40 |
0.614 (0.574–0.656) |
< 0.001 |
0.755 (0.675–0.845) |
< 0.001 |
41–50 |
0.760 (0.708–0.816) |
< 0.001 |
0.845 (0.750–0.953) |
0.006 |
51–60 |
0.867 (0.803–0.936) |
< 0.001 |
0.911 (0.801–1.038) |
0.161 |
61–70 |
Reference |
– |
Reference |
– |
71–80 |
1.108 (1.010–1.216) |
0.030 |
1.160 (0.994–1.354) |
0.059 |
>80 |
1.289 (1.187–1.399) |
< 0.001 |
1.079 (0.931–1.249) |
0.313 |
Regional nodes |
||||
Negative |
Reference |
– |
Reference |
– |
Positive |
3.626 (3.549–3.705) |
< 0.001 |
2.478 (2.422–2.536) |
< 0.001 |
Unknown |
3.181 (2.988–3.385) |
< 0.001 |
2.100 (1.970–2.237) |
< 0.001 |
Radiation |
||||
Yes |
Reference |
– |
Reference |
– |
No |
1.437 (1.407–1.467) |
< 0.001 |
1.176 (1.150–1.201) |
< 0.001 |
Unknown |
1.635 (1.545–1.730) |
< 0.001 |
1.190 (1.124–1.259) |
< 0.001 |
Size × Hormonec |
– |
– |
< 0.001 |
|
Abbreviations: CI, confidence interval; ER, estrogen receptor; HR, hazard ratio; PR, progesterone receptor; UD, undifferentiated
a.Including American Indian/Alaskan native and Asian/Pacific Islander
b.Including divorced, separated, single (never married), and widowed
c.We defined an interaction term (size × nodes) to determine whether there was significant interaction between tumor size and hormone receptor status in predicting breast cancer-specific mortality.
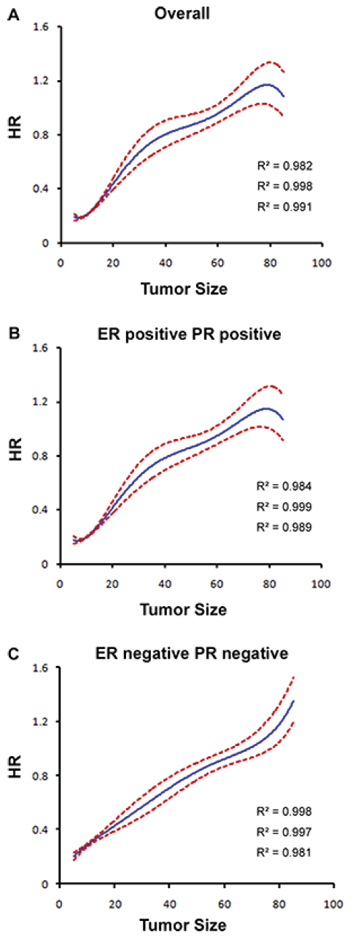
Figure 2: Estimates of hazard ratios (HRs) of breast cancer-specific mortality based on tumor size for different ER/PR status groups using quantic polynomial regression. R-squared (R2) values are reported. The solid blue lines represent HR estimates, whereas the dashed red lines represent 95% confidence intervals. A. The entire cohort. B. ER-positive and PR-positive patients. C. ER-negative and PR-negative patients.
However, in the ER−PR− group (Table 3), the HRs for BCSM gradually increased with increasing tumor size (0–10 mm, HR 0.205, 95% CI 0.183–0.229, P < 0.001; 11–20 mm, HR 0.349, 95% CI 0.317–0.384, P < 0.001; 21–30 mm, HR 0.514, 95% CI 0.468–0.565, P < 0.001; 31–40 mm, HR 0.637, 95% CI 0.577–0.702, P < 0.001; 41–50 mm, HR 0.777, 95% CI 0.701–0.862, P < 0.001; 51–60 mm, HR 0.856, 95% CI 0.767–0.956, P = 0.006; 71–80 mm, HR 1.060, 95% CI 0.927–1.213, P = 0.392; > 80 mm, HR 1.356, 95% CI 1.207–1.523, P < 0.001). For this group, the HR was highest in the group with tumors larger than 80 mm. The plotted HRs for this subgroup exhibited a constant increase with increasing tumor size (Table 3; Figure 2C).
Table 3: Pairwise comparisons between different combinations of size and hormone receptor statuses relative to breast cancer-specific mortalitya
Variable |
Hormone receptor status |
|||||||
ER+PR+ |
ER+PR− |
ER−PR+ |
ER−PR− |
|||||
HR (95% CI) |
P |
HR (95% CI) |
P |
HR (95% CI) |
P |
HR (95% CI) |
P |
|
Tumor size (mm) |
||||||||
0–10 |
0.176 (0.156–0.198) |
< 0.001 |
0.144 (0.118–0.175) |
< 0.001 |
0.191 (0.127–0.290) |
< 0.001 |
0.205 (0.183–0.229) |
< 0.001 |
11–20 |
0.308 (0.276–0.343) |
< 0.001 |
0.285 (0.239–0.340) |
< 0.001 |
0.339 (0.235–0.490) |
< 0.001 |
0.349 (0.317–0.384) |
< 0.001 |
21–30 |
0.525 (0.471–0.585) |
< 0.001 |
0.461 (0.388–0.548) |
< 0.001 |
0.575 (0.399–0.828) |
0.003 |
0.514 (0.468–0.565) |
< 0.001 |
31–40 |
0.739 (0.660–0.827) |
< 0.001 |
0.622 (0.520–0.745) |
< 0.001 |
0.690 (0.473–1.008) |
0.055 |
0.637 (0.577–0.702) |
< 0.001 |
41–50 |
0.831 (0.737–0.936) |
0.002 |
0.713 (0.588–0.863) |
0.001 |
0.888 (0.593–1.330) |
0.564 |
0.777 (0.701–0.862) |
< 0.001 |
51–60 |
0.904(0.794–1.029) |
0.127 |
0.769 (0.625–0.946) |
0.013 |
0.931 (0.610–1.421) |
0.740 |
0.856 (0.767–0.956) |
0.006 |
61–70 |
Reference |
– |
Reference |
– |
Reference |
– |
Reference |
– |
71–80 |
1.139 (0.976–1.329) |
0.099 |
0.828 (0.639–1.072) |
0.152 |
0.898 (0.541–1.491) |
0.678 |
1.060 (0.927–1.213) |
0.392 |
>80 |
1.070 (0.923–1.239) |
0.370 |
1.253 (1.009–1.555) |
0.041 |
1.590 (1.012–2.498) |
0.044 |
1.356(1.207–1.523) |
< 0.001 |
Abbreviations: CI, confidence interval; ER, estrogen receptor; HR, hazard ratio; PR, progesterone receptor
aThe results of the different combinations of size (rows) and hormone receptor status (columns) are presented at the intersections of the rows and columns. All the results were adjusted using Cox proportional hazards models for year of diagnosis, race, marital status, age, laterality, grade, node, and radiation history.
To clarify whether the interaction between tumor size and ER/PR status is affected by potential confounders, we performed BCSM analyses using different interaction terms after stratifying by LN status. A significant interaction between tumor size and ERPR status was identified in both LN-negative and LN-positive patients (Table S1). Except for certain small changes, the HR trends in all the luminal subgroups after stratification by LN status were similar to those in the previous analyses (Table S1).
DISCUSSION
A more comprehensive characterization of this interaction could increase our understanding of breast cancer biology and individualized treatments. Thus, we sought to determine whether there is a significant interaction between tumor size and HoR status in predicting BCSM in subdivided categories, especially in groups with larger tumors. In addition, we hypothesized that for ER+ and/or PR+ tumors, large primary lesions (defined as > 50 mm) may indicate biologically indolent disease and may thus predict different BCSS patterns compared to ER−PR− tumors of a similar size. After adjusting for known breast cancer prognostic factors and accounting for multiple comparisons, we observed a linear effect of increasing size on BCSM in the ER−PR− subsets, a result that is consistent with traditional perspectives [2, 3, 4]. Interestingly, the effect of tumor size on BCSM within the ER+PR+ subgroup was piecewise. Patients with 51–60 mm, 71–80 mm and > 80 mm tumors had a similar BCSM as those with 61–70 mm tumors. These data suggested that increasing tumor size potentially lost its prognostic value in the ER+PR+ group above the threshold of 51 mm. Similar patterns in the prognostic value of tumor size were observed in the ER+PR− and ER−PR+ subgroups.
The following are possible explanations for this interrupted relationship between tumor size and survival. First, luminal breast cancer is a highly heterogeneous disease. For the study cohort herein, luminal tumors refer to ER+PR+, ER+PR− and ER−PR+ breast cancer. Previous studies using microarray technology have indicated that tumor heterogeneity is also present at the gene expression level, and two main luminal breast cancer subtypes have been identified [17, 18, 19]. These subtypes are referred to as luminal A and luminal B, and they have different gene expression profiles, prognoses and treatment responses [17, 19, 20]. A tumor gene signature represents the average of all cells sampled within the tumor. If an aggressive cellular component of a tumor represents a smaller proportion of the total cell population in a larger tumor, its gene signature may be diluted by the bulk of the less aggressive tumor cells. Thus, patients with larger luminal tumors may have similar survival outcomes as patients with smaller tumors.
Second, it is universally accepted that a cancer spreads when metastatic ability is obtained through the accumulation of mutations as the tumor grows to a large size [21, 22]. Moreover, several newly identified cancer genes in ER+ breast cancer have loss-of-function mutations [23, 24]. Certain studies have provided examples to illustrate that mutations can be associated with good prognosis in patients with ER+ breast cancer, e.g., some PIK3CA mutations [25, 26]. It is therefore conceivable that a larger luminal tumor that has accumulated mutations may not confer a worse prognosis.
Third, patients with larger tumors are more likely to receive more advanced treatment regimens compared with patients with smaller luminal tumors; these advanced therapies include more radical surgery, more intensive radiation therapy, more aggressive chemotherapy and extended endocrine therapy. Therefore, patients with tumors larger than 50 mm may not have worse BCSS.
Moreover, the observed relationships essentially remained in all luminal tumors after LN stratification. This finding further supports the idea that the use of molecular profiling in conjunction with tumor size and node status may improve prognostic power.
Our findings have potential implications in both clinical practice and breast cancer research. Larger luminal tumors have a seemingly indolent nature, which may be due to more aggressive treatment and/or intrinsic factors. Because such larger ER+ and/or PR+ tumors most likely have no higher chance of distant dissemination, local-regional treatments might be more crucial. The extension of surgery, systemic therapy options, and timing of adjuvant chemotherapy (before or after radiotherapy) should be individualized. Even after metastasis, larger ER+ and/or PR+ tumors might present no greater possibility of leading to rapid progression or visceral crisis, and thus endocrine therapy or other less aggressive regimens could be taken into consideration for these patients to avoid unnecessary treatment and exposure to side effects. Overall, achieving similar favorable outcomes remains possible in this subgroup of patients. In addition, the findings of this study support a growing body of literature that addresses the importance of molecular subtype classification in addition to LN metastasis and tumor size for predicting survival. In addition to ER/PR profiles, more gene expression profiles are beginning to emerge, and these must be explored to better define tumor signatures [27–32].
Our study has some limitations. First, the SEER database does not contain information regarding HER2/neu status and systemic therapy. Therefore, these potential confounding factors could not be adjusted in our analyses. Second, breast cancer can have a long natural history; thus, a median follow-up of 68 months may not reveal long-term survival differences. Third, the retrospective nature of our study may have introduced bias into the analysis. Despite these limitations, this study is convincing because it is based on a large population and multiple centers.
In conclusion, our study revealed that BCSM does not increase with increasing tumor size in patients with luminal breast cancer lesions greater than 50 mm in size, regardless of LN status. It might be possible to achieve a favorable clinical outcome for patients with this subtype of breast cancer, suggesting that these patients require more individualized treatment. In addition, the biological behavior of this heterogeneous disease warrants further investigation.
METHODS
Patients
Data were obtained from the current SEER database, which consists of 18 population-based cancer registries. SEER data are an open access resource for cancer-based epidemiology and survival analyses. SEER*Stat software from the National Cancer Institute (Surveillance Research Program, National Cancer Institute SEER*Stat software, http://www.seer.cancer.gov/seerstat) (Version 8.1.5) was used to identify eligible patients.
The following inclusion criteria were utilized for patient selection: female, pathological diagnosis of invasive ductal carcinoma, unilateral breast cancer, known tumor size, breast cancer as the first and only cancer diagnosis, diagnosis not obtained from a death certificate or autopsy, only one primary site, surgical treatment with either mastectomy or breast-conserving surgery, known ER and PR status, American Joint Committee on Cancer (AJCC) stages I-III, known age at diagnosis, and known time of diagnosis from 1990 to 2010. Pathologic diagnosis was based on the primary site using the International Classification of Disease for Oncology, Third Edition (ICD-O-3). The morphology code for infiltrating duct carcinoma was 8500. Patients diagnosed with breast cancer before 1990 were excluded due to unavailable ER and PR data; patients diagnosed with breast cancer after 2010 were excluded to ensure an adequate follow-up time. Treatment status regarding surgery and irradiation therapy was also obtained for the selected patients. Data regarding chemotherapy and endocrine therapy are not included in SEER; hence, these data were not evaluated. HoR status was analyzed by joint ER and PR statuses (ER+PR+, ER+PR−, ER−PR+, and ER−PR−). We used BCSM as the primary study outcome of the SEER data; BCSM was calculated from the date of diagnosis to the date of breast cancer-specific death. Patients who died of non-breast cancer-related causes were censored regarding the date of death.
This study was based on public data released by the SEER database; we obtained permission to access research data files with the reference number 13539-Nov2013. SEER database data do not require informed consent, and our study was conducted with approval from the Ethical Committee Review Board of Fudan University Shanghai Cancer Center.
Statistical analysis
Study variables are provided in Table 1; these variables were stratified by joint ER/PR expression. Tumor size was treated as a categorical variable to explore the impact of size on BCSM. Tumors larger than 80 mm were combined due to the limited number of cases. The association of ER/PR status with clinicopathologic parameters was analyzed using the chi-squared (χ2) test. We defined an interaction term (size × ERPR) to determine whether there was a significant interaction between tumor size and ER/PR status in predicting BCSM. Pairwise comparisons were performed between different combinations of ER/PR status and tumor size to determine the presence of significant differences in BCSM.
Survival curves were generated by the Kaplan-Meier method, and differences between the curves were analyzed using the log-rank test. Univariate and multivariate Cox regression models were generated to analyze risk factors for BCSM, and adjusted hazard ratios (HRs) with 95% confidence intervals (CIs) were calculated. The nonlinear effect of continuous tumor size on BCSM was assessed using quantic polynomial regression, and R-squared (R2) values are reported. All the statistical analyses were performed using SPSS (version 19.0; SPSS Company). Two-sided P-values < 0.05 were considered statistically significant.
ACKNOWLEDGMENTS
This study was supported by grants from the National Natural Science Foundation of China (81201531 and 81202079) and the Shanghai Committee of Science and Technology Funds (12ZR1406200, 12DZ2260100, and 11QA1401400 to X. Hu).
CONFLICTS OF INTERESTS
The authors declare that they have no competing interests.
REFERENCES
1. Goldhirsch A, Glick JH, Gelber RD, Coates AS, Thürlimann B, Senn HJ. Panel members. Meeting highlights: international expert consensus on the primary therapy of early breast cancer 2005[J]. Ann Oncol. 2005; 16:1569–1583.
2. Fitzgibbons PL, Page DL, Weaver D, Thor AD, Allred DC, Clark GM, Ruby SG, O'Malley F, Simpson JF, Connolly JL, Hayes DF, Edge SB, Lichter A, et al. Prognostic factors in breast cancer. College of American Pathologists Consensus Statement 1999[J]. Arch Pathol Lab Med. 2000; 124:966–978.
3. Mirza AN1, Mirza NQ, Vlastos G, Singletary SE. Prognostic factors in node-negative breast cancer: a review of studies with sample size more than 200 and follow-up more than 5 years[J]. Ann Surg. 2002; 235:10.
4. Rosenberg J, Chia Y L, Plevritis S. The effect of age, race, tumor size, tumor grade, and disease stage on invasive ductal breast cancer survival in the US SEER database[J]. Breast Cancer Res Treat. 2005; 89:47–54.
5. Boffa D J, Greene F L. Reacting to changes in staging designations in the 7th edition of the AJCC staging manual[J]. Ann Surg Oncol. 2011; 18:1–3.
6. Greene FL, Fritz A, Balch CM, : AJCC Cancer Staging Manual. 6. (Chicago, IL: Springer)2002
7. Singletary SE, Allred C, Ashley P, Bassett LW, Berry D, Bland KI, Borgen PI, Clark G, Edge SB, Hayes DF, Hughes LL, Hutter RV, Morrow M, et al. Revision of the American Joint Committee on Cancer staging system for breast cancer[J]. J Clin Oncol. 2002; 20:3628–3636.
8. Dunnwald L K, Rossing M A, Li C I. Hormone receptor status, tumor characteristics, and prognosis: a prospective cohort of breast cancer patients[J]. Breast Cancer Res. 2007; 9:R6.
9. Anderson WF, Chu KC, Chatterjee N, Brawley O, Brinton LA, et al. Tumor variants by hormone receptor expression in white patients with node-negative breast cancer from the surveillance, epidemiology, and end results database[J]. J Clin Oncol. 2001; 19:18–27.
10. Foulkes W D, Reis-Filho J S, Narod S A. Tumor size and survival in breast cancer—a reappraisal[J]. Nat Rev Clin Oncol. 2010; 7:348–353.
11. Gonzalez-Angulo AM, Litton JK, Broglio KR, Meric-Bernstam F, Rakkhit R, Cardoso F, Peintinger F, Hanrahan EO, Sahin A, Guray M, Larsimont D, Feoli F, Stranzl H, et al. High risk of recurrence for patients with breast cancer who have human epidermal growth factor receptor 2-positive, node-negative tumors 1 cm or smaller[J]. J Clin Oncol. 2009; 27:5700–5706.
12. Curigliano G, Viale G, Bagnardi V, et al. Clinical relevance of HER2 overexpression/amplification in patients with small tumor size and node-negative breast cancer[J]. J Clin Oncol. 2009; 27:5693–5699.
13. Curigliano G1, Viale G, Bagnardi V, Fumagalli L, Locatelli M, Rotmensz N, Ghisini R, Colleoni M, Munzone E, Veronesi P, Zurrida S, Nolè F, Goldhirsch A, et al. Tumor size is an unreliable predictor of prognosis in basal-like breast cancers and does not correlate closely with lymph node status[J]. Breast Cancer Res Treat. 2009; 117:199–204.
14. Ignatiadis M, Sotiriou C. Luminal breast cancer: from biology to treatment[J]. Nat Rev Clin Oncol. 2013; 10:494–506.
15. Hilton HN, Doan TB, Graham JD, Oakes SR, Silvestri A, Santucci N, Kantimm S, Huschtscha LI, Ormandy CJ, Funder JW, Simpson ER, Kuczek ES, Leedman PJ, et al. Acquired convergence of hormone signaling in breast cancer: ER and PR transition from functionally distinct in normal breast to predictors of metastatic disease[J]. Oncotarget. 2014; 5:8651.
16. Brisken C. Progesterone signalling in breast cancer: a neglected hormone coming into the limelight[J]. Nat Rev Cancer. 2013; 13:385–396.
17. Perou CM, Sørlie T, Eisen MB, van de Rijn M, Jeffrey SS, Rees CA, Pollack JR, Ross DT, Johnsen H, Akslen LA, Fluge O, Pergamenschikov A, Williams C, et al. Molecular portraits of human breast tumours[J]. Nature. 2000; 406:747–752.
18. Sørlie T, Perou C M, Tibshirani R, et al. Gene expression patterns of breast carcinomas distinguish tumor subclasses with clinical implications[J]. Proc Natl Acad Sci USA. 2001; 98:10869–10874.
19. Sørlie T1, Perou CM, Tibshirani R, Aas T, Geisler S, Johnsen H, Hastie T, Eisen MB, van de Rijn M, Jeffrey SS, Thorsen T, Quist H, Matese JC, et al. Breast cancer classification and prognosis based on gene expression profiles from a population-based study[J]. Proc Natl Acad Sci USA. 2003; 100:10393–10398.
20. Creighton C J. The molecular profile of luminal B breast cancer[J]. Biologics. 2012; 6:289.
21. Comen E, Norton L, Massague J. Clinical implications of cancer self-seeding[J]. Nat Rev Clin Oncol. 2011; 8:369–377.
22. Norton L, Massagué J. Is cancer a disease of self-seeding?[J]. Nat Med. 2006; 12:875–878.
23. Stephens PJ, Tarpey PS, Davies H, Van Loo P, Greenman C, Wedge DC, Nik-Zainal S, Martin S, Varela I, Bignell GR, Yates LR, Papaemmanuil E, Beare D, et al. The landscape of cancer genes and mutational processes in breast cancer[J]. Nature. 2012; 486:400–404.
24. Cancer Genome Atlas Network. Comprehensive molecular portraits of human breast tumours[J]. Nature. 2012; 490:61–70.
25. Loi S1, Haibe-Kains B, Majjaj S, Lallemand F, Durbecq V, Larsimont D, Gonzalez-Angulo AM, Pusztai L, Symmans WF, Bardelli A, Ellis P, Tutt AN, Gillett CE, et al. PIK3CA mutations associated with gene signature of low mTORC1 signaling and better outcomes in estrogen receptor-positive breast cancer[J]. Proc Natl Acad Sci USA. 2010; 107:10208–10213.
26. Cancer Genome Atlas NetworkComprehensive molecular portraits of human breast tumours[J]. Nature. 2012; 490:61–70.
27. Dowsett M1, Cuzick J, Wale C, Forbes J, Mallon EA, Salter J, Quinn E, Dunbier A, Baum M, Buzdar A, Howell A, Bugarini R, Baehner FL, et al. Prediction of risk of distant recurrence using the 21-gene recurrence score in node-negative and node-positive postmenopausal patients with breast cancer treated with anastrozole or tamoxifen: a TransATACstudy[J]. J Clin Oncol. 2010; 28:1829–1834.
28. Albain KS1, Barlow WE, Shak S, Hortobagyi GN, Livingston RB, Yeh IT, Ravdin P, Bugarini R, Baehner FL, Davidson NE, Sledge GW, Winer EP, Hudis C, et al. Prognostic and predictive value of the 21-gene recurrence score assay in postmenopausal women with node-positive, oestrogen-receptor-positive breast cancer on chemotherapy: a retrospective analysis of a randomisedtrial[J]. Lancet Oncol. 2010; 11:55–65.
29. Sgroi DC, Sestak I, Cuzick J, Zhang Y, Schnabel CA, Schroeder B, Erlander MG, Dunbier A, Sidhu K, Lopez-Knowles E, Goss PE, Dowsett M. Prediction of late distant recurrence in patients with oestrogen-receptor-positive breast cancer: a prospective comparison of the breast-cancer index (BCI) assay, 21-gene recurrence score, and IHC4 in the TransATAC study population[J]. Lancet Oncol. 2013; 14:1067–1076.
30. Dubsky P, Brase JC, Jakesz R, Rudas M, Singer CF, Greil R, Dietze O, Luisser I, Klug E, Sedivy R, Bachner M, Mayr D, Schmidt M, et al. The EndoPredict score provides prognostic information on late distant metastases in ER+/HER2− breast cancer patients[J]. Br J Cancer. 2013; 109:2959–2964.
31. Gnant M, Filipits M, Greil R, Stoeger H, Rudas M, Bago-Horvath Z, Mlineritsch B, Kwasny W, Knauer M, Singer C, Jakesz R, Dubsky P, Fitzal F, et al. Predicting distant recurrence in receptor-positive breast cancer patients with limited clinicopathological risk: using the PAM50 Risk of Recurrence score in 1478 postmenopausal patients of the ABCSG-8 trial treated with adjuvant endocrine therapy alone[J]. Ann Oncol. 2014; 25:339–345.
32. Sestak I, Dowsett M, Zabaglo L, Lopez-Knowles E, Ferree S, Cowens JW, Cuzick J, et al. Factors Predicting late recurrence for estrogen receptor-Positive Breast cancer[J]. J Natl Cancer Inst. 2013; 105:1504–11.