
INTRODUCTION
The High Mobility Group A (HMGA) protein family is comprised of three proteins: HMGA1a and HMGA1b, which are encoded by the HMGA1 gene through alternative splicing [1], and the related HMGA2 protein, encoded by a distinct gene [2]. These proteins are nonhistone architectural nuclear factors, able to bind the minor groove of AT-rich DNA sequences through three “AT-hook” domains. The involvement of HMGA proteins in embryogenesis, cell proliferation, differentiation, apoptosis and, above all, cancer development has been extensively demonstrated [3]. In particular, HMGA proteins seem to play their major physiologic role during embryonic development where they are abundantly expressed, whereas their expression is low or negligible in normal adult tissues [4, 5]. Conversely, HMGA overexpression is a feature of malignant neoplasias [3], where it represents a poor prognostic index, as it often correlates with a reduced survival [6]. It has been previously demonstrated that HMGA proteins have oncogenic activity since their overexpression leads to the transformation of rat fibroblasts [7] and human epithelial breast cells [8], and transgenic mice overexpressing the HMGA proteins develop multiple neoplasias [9–13].
The mechanisms accounting for cell transformation induced by the HMGA proteins are essentially based on their ability to activate or inhibit the expression of genes involved in the control of cellular proliferation, invasion and apoptosis [3, 14–16].
A hallmark of human cancer is genome instability, whose prominent form is represented by chromosomal instability (CIN). This can consist in gain or loss of whole chromosomes, translocation/deletion/duplication of chromosome segments or polyploidy. Alterations in chromosome number or aneuploidy are found in nearly all major human tumor types [17], generally associated with the most aggressive forms of cancer. Alterations of the genes coding for proteins involved in Spindle Assembly Checkpoint (SAC), frequently observed in human malignant neoplasias, account for aneuploidy of cancer cells [18]. However, mutations in SAC genes are quite rare in human cancers (reviewed in [19]), whereas their deregulation is more frequent. Indeed, downregulation of Bub1 expression has been detected in a subset of acute myeloid leukemia [20], whereas upregulation of Bub1 levels has been reported in lymphomas [21], breast [22] and gastric cancers [23, 24]. Therefore, these studies demonstrate that both upregulation and downregulation of SAC genes can cause a checkpoint impairment leading to CIN.
Since HMGA expression is associated with a highly malignant phenotype that is characterized by CIN which accelerates tumor progression leading to a higher malignant state, the aim of this work has been to investigate whether HMGA1 proteins are able to regulate the expression of SAC genes, and, thereby, evaluate HMGA1 role in CIN.
Herein we report that HMGA1 increases the transcription of Bub1, Bub1b, Mad2l1 and Mps1/Ttk genes involved in the SAC. We have found that HMGA1 knock-down compromises the mitotic checkpoint activity, and consistently HMGA1-depleted cells show a higher percentage of metaphases with unaligned chromosomes and a reduced prometaphase time compared to control cells, indicating a SAC impairment. Finally, human colon carcinomas show high SAC gene expression that correlates with HMGA1 protein levels.
RESULTS
HMGA1 increases the transcription of Bub1, Bub1b, Mad2l1 and Ttk genes involved in the SAC
In order to identify a possible role of HMGA1 in the induction of chromosomal instability we have investigated, first, the ability of HMGA1 to regulate the expression of SAC genes, focusing our attention on Bub1, Bub1b, Mad2l1 and Ttk genes.
These genes have been chosen because their promoters contain AT-rich regions, which represent putative binding sites for HMGA1 proteins, flanking the consensus binding sites for the same transcription factors (Supplementary Figure S1), some of which have been described as interactors of HMGA1 proteins (Supplementary Figure S1).
Therefore, we have evaluated the expression of Bub1, Bub1b, Mad2l1 and Ttk at mRNA level by quantitative PCR (qPCR) in mouse NIH3T3 cells transfected with the pCEFL-HA-Hmga1b expression vector encoding HMGA1b. As shown in Figure 1A, the expression of Bub1, Bub1b, Mad2l1 and Ttk genes is higher in the cells overexpressing HMGA1 in comparison with the empty vector-transfected NIH3T3 cells (CV). Parallel results were obtained when total cellular extracts from the same cells were analyzed by western blotting with the antibodies raised against BUBR1 and MAD2 proteins (Figure 1B). Moreover, the same results have been obtained in human colorectal HCT116, SW620 and SW48 cells overexpressing or not the HMGA1b protein (Figure 1C and 1D, and Supplementary Figure S2).
These results suggest a role of the HMGA1b protein in the activation of SAC gene expression.
HMGA1 binds Bub1, Bub1b, Mad2l1 and Ttk promoters in vivo
As described above, Bub1, Bub1b, Mad2l1 and Ttk promoter regions contain some AT-rich DNA sequences which are the preferred binding sites for HMGA1 proteins. Therefore, we analyzed the ability of the HMGA1 proteins to bind the promoter regions of these genes by chromatin immunoprecipitation (ChIP) assays. Thus, HCT116 cells were cross-linked with formaldehyde, and DNA-chromatin complexes were subjected to immunoprecipitation with anti-HMGA1 or anti-IgG antibodies used as control. The recovered DNA was subsequently analyzed by qPCR, using primers spanning specific AT-rich regions of the indicated promoters. Specifically, the following AT-rich regions of these promoters: -760/-567 region of the Bub1 promoter, -740/-550 region of the Bub1b promoter, -442/-198 region of the Mad2l1 promoter, and -380/-194 region of the Ttk promoter, containing putative binding sites for HMGA1 proteins (see Supplementary Figure S1), were analyzed. The immunoprecipitated DNA has also been amplified using primers for the glyceraldehyde 3-phosphate dehydrogenase (Gapdh) gene promoter as negative control. As shown in Figure 2A, occupancy of Bub1, Bub1b, Mad2l1 and Ttk promoters by HMGA1 has been detected in the anti-HMGA1-precipitated chromatin from HCT116 cells. Conversely, no amplification was observed with anti-IgG precipitates and when primers for the Gapdh promoter were used, indicating the specificity of the binding of HMGA1 proteins to the Bub1, Bub1b, Mad2l1 and Ttk promoters.
Finally, to assess the functional consequences of the HMGA1 binding to these promoters, we investigated whether HMGA1 proteins were able to regulate these promoters performing luciferase activity assays in NIH3T3 cells. To this aim, NIH3T3 cells have been co-transfected with a reporter vector (pGL3-Basic) carrying the firefly-luciferase gene under the control of Bub1, Bub1b, Mad2l1 and Ttk promoters, with different amounts of pcDNA3.1-Hmga1b and renilla-luciferase reporter vector (used for normalization). Insert-less pcDNA3.1 vector has been used as control (CV). As shown in Figure 2B, HMGA1 increases Bub1, Bub1b, Mad2l1 and Ttk promoter activities.
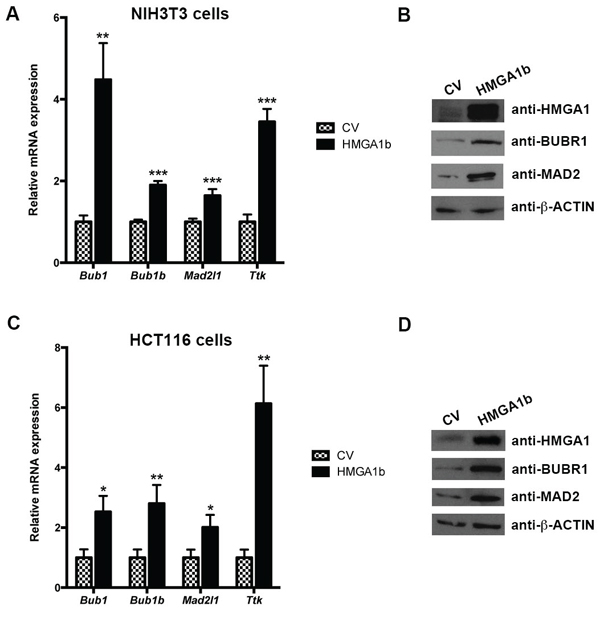
Figure 1: HMGA1 increases mitotic spindle regulator genes at both RNA and protein level. RNA and proteins extracted from NIH3T3 cells transiently transfected with pCEFL-HA-Hmga1b carrying the Hmga1b cDNA or the backbone vector (CV) were analyzed by qPCR for Bub1, Bub1b, Mad2l1 and Ttk expression A. and western blotting with the indicated antibodies B. The actin expression level has been used for normalization. Data are mean ± SD of a representative experiment performed in triplicate. *p < 0.05; **p < 0.01; ***p < 0.001, Student’s t test. C and D. RNA and proteins extracted from HCT116 cells treated as in (A) were analyzed by qPCR for Bub1, Bub1b, Mad2l1 and Ttk expression (C) and western blotting with the indicated antibodies (D) The actin expression level has been used for normalization.
Taken together, these results demonstrate that HMGA1 is able to bind to the Bub1, Bub1b, Mad2l1 and Ttk promoters, and increase their transcriptional activity strongly supporting a critical role of HMGA1 in the regulation of SAC gene expression.
HMGA1 depletion impairs the mitotic checkpoint activity
Since the above described results indicate that HMGA1 is able to activate the expression of SAC genes acting at transcriptional level, we investigated whether HMGA1-induced SAC genes deregulation affects the mitotic checkpoint in mammalian cultured cells. To this aim, we used HeLa cells that have a functional SAC and are often used as a model for studying the checkpoint function. Since HeLa cells express HMGA1 protein at high levels, the further over-expression of HMGA1 failed to induce a consistent up-regulation of SAC genes. For this reason, considering that both up-regulation and down-regulation of one or more SAC genes impair the checkpoint, we evaluated whether HMGA1-silencing by RNAi is able to down-regulate SAC genes expression in HeLa cells. To this aim we transfected HeLa cells with siRNA targeting the HMGA1 gene (HMGA1i cells) or with control siRNA (Ctli cells). As expected, we observed a drastic downregulation of SAC gene expression (Bub1, Bub1b, Mad2l1 and Ttk) at mRNA (Figure 3A) and protein level (Supplementary Figure S3). The analysis of mitotic cells by immunofluorescence showed the presence of a high number of unaligned chromosomes in metaphase in HMGA1i cells but not in the scrambled oligonucleotide transfected HeLa cells (Figure 3B and 3C). Subsequently, to evaluate the role of HMGA1 in the mitotic checkpoint regulation, we used live-cell microscopy to follow mitotic progression in individual cells. Filming of mitoses in HeLa HMGA1i and Ctli cells revealed several mitotic errors in HMGA1i cells. The most prominent phenotype was a reduction of pro-metaphase time, i.e. from the round-up to the chromosome segregation, in HMGA1i cells (t = 70.21 ± 40.35 min (n = 32) versus 154.52 ± 61.46 min in Ctli (n = 32); Figure 3D and 3F and Supplementary Movies S1 and S2). We have observed that HMGA1i cells exhibited also an anaphase delay (t = 14.7 ± 8.89 min (n = 39) versus 8.05 ± 5.02 min in Ctli (n = 23); Figure 3D and 3F and Supplementary Movies S1 and S2) and that they showed a slightly higher cytokinesis time (from the early telophase to abscission; t = 199.5 ± 83.65 min n = 30) than that of Ctli cells (t = 161.28 ± 38.43 min n = 24), associated to a higher percentage of cytokinesis failure resulting in binucleated cells (21% versus 12% in Ctli cells; Figure 3D and 3E). Moreover, we observed a higher percentage of death in mitosis and of metaphase failure in the HMGA1i than in Ctli cells (Figure 3E).
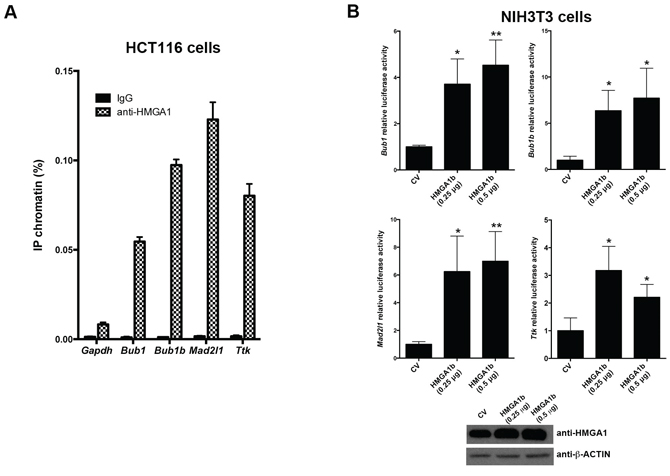
Figure 2: HMGA1 protein binds Bub1, Bub1b, Mad2l1 and Ttk promoters in vivo and increases their transcriptional activity. A. Soluble chromatin from HCT116 cells has been immunoprecipitated with anti-HMGA1 antibodies. Then, the DNAs have been amplified by qPCR using primers covering different regions of Bub1, Bub1b, Mad2l1 and Ttk promoters. GAPDH promoter and nonspecific IgG instead of anti-HMGA1 were used as control of the specificity of the HMGA1 binding to the indicated promoters. Data are mean ± SD of a representative experiment performed in triplicate. See also Supplementary Figure S1. B. Analysis of Bub1, Bub1b, Mad2l1 and Ttk luciferase reporter activities in NIH3T3 cells transiently transfected with empty vector (CV), or 0.25 and 0.5 μg of pcDNA3.1-Hmga1b expression vector. All the transfections were performed in duplicate. Data are mean ± SD of three independent experiments. *p < 0.05; **p < 0.01, Student’s t test. Western blotting analysis of HMGA1 protein from one representative experiment was shown (bottom). Actin was used to equalize protein loading.
Altogether, these results suggest that the deregulation of SAC genes induced by HMGA1 depletion impairs the activity of the checkpoint.
HMGA1 expression levels directly correlate with the expression of genes involved in SAC
We evaluated the correlation between the expression of HMGA1 and of the SAC genes BUB1, BUB1B, MAD2L1 and TTK, in global mRNA profiles of colorectal cancer generated by The Cancer Genome Atlas (TCGA; http://cancergenome.nih.gov/) for 365 and 222 samples profiled with, respectively, RNAseq and DNA microarrays. HMGA1 was found to be significantly correlated with each of the SAC genes both in RNAseq and microarray data (Pearson r between 0.22 and 0.38; p < 10−6 in 6 comparisons, and < 2*10−4 in the remaining two) (Figure 4A). We extended the analysis also to other SAC genes (AURKB, CENPE, AURKA and TPX2) obtaining the same results for two of them. Interestingly, the correlation further raised when the expression of the four SAC genes was averaged (r = 0.34 in RNAseq and 0.35 in array) (Figure 4A and 4B).
It is noteworthy that a stronger correlation between HMGA1 and SAC gene mRNA expression was found when liver metastases from colon carcinomas (n = 185) were analyzed by Illumina array (Figure 4A). In particular, we obtained a Pearson r > 0.62 and a p value < 10−6 for seven of the eight analyzed SAC genes, with a further increase for the averaged SAC genes expression (Pearson r = 0.72; p < 10−6).
Therefore, we attempted to confirm the association of HMGA1 expression with that of two SAC genes (BUBR1 and TTK) at protein level by immunohistochemical analyses of paraffin-embedded tissues evaluating the expression of these proteins in 36 colon tissue specimens (three normal colon tissues and 33 colon carcinoma). The results of this analysis are summarized in Figure 5. Indeed, as previously reported [25, 26], HMGA1 expression was abundant in the colon carcinoma samples, whereas it was not detectable in normal colonic mucosa. Interestingly, a weak immunoreactivity was observed in normal colon mucosa after staining with antibodies raised versus BUBR1 and TTK, whereas colon carcinoma samples showed a strong immunoreactivity that significantly correlated with HMGA1 staining (p = 0.006 for BUBR1 and p < 0.001 for TTK). In fact, 55.5% and 44.4% of tumor samples with a weak HMGA1 staining (1+) had negative or weak staining also for BUBR1 and TTK respectively, whereas 61.5% and 66.7% of tumor samples with a strong HMGA1 immunoreactivity (3+) had also a strong immunoreactivity for BUBR1 and TTK, respectively. Representative cases of normal colon mucosa (a, b, c), colon carcinoma samples with a weak HMGA1 immunoreactivity (d, e, f) and colon carcinoma samples with a strong HMGA1 reactivity (g, h, i) stained with antibodies versus BUBR1 and TTK are shown in Figure 5.
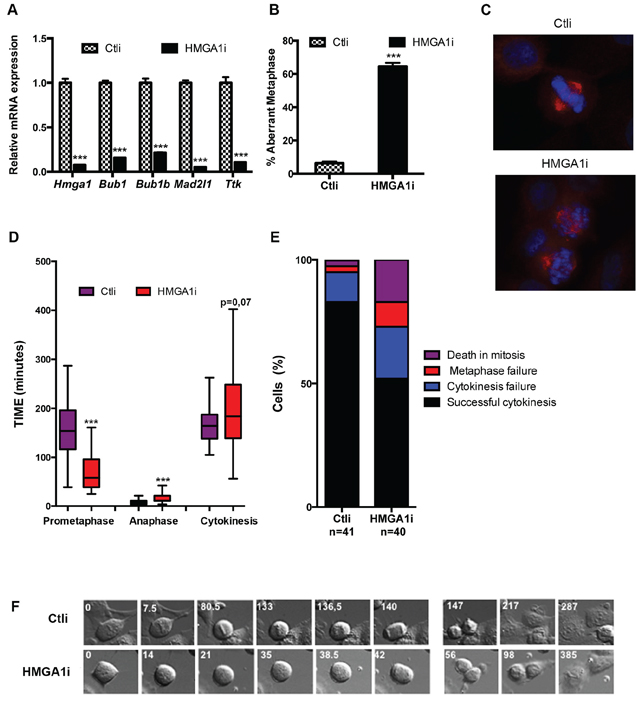
Figure 3: HMGA1 depletion impairs the mitotic checkpoint. A. Control (Ctli) and HMGA1-depleted (HMGA1i) HeLa cells were tested for the expression of HMGA1 and SAC genes by qPCR. B. HeLa cells were transfected with Ctli and HMGAi siRNA as in A, fixed 48 hrs post transfection and stained with DAPI (blue) and anti-β-tubulin Ab (red) to identify the DNA and the mitotic spindle, respectively. About 150 metaphases per sample were scored for the presence of aligned chromosome. The data are represented as mean ± SD. Differences between Ctli and HMGA1i are statistically significant. ***p < 0.001, Student’s t-test. C. Representative immunostainings are shown (right). D. HeLa cells treated as in A and analyzed 48 h post transfection by time lapse video. For each case, duration of the different phases of the mitosis and of the cytokinesis was measured. The duration of the indicated mitotic phases is reported in box plot graph (Whisker diagram). ***p < 0.001, Student’s t-test. E. The percentage of cells with the indicated outcome is reported. F. Still images related to Supplementary Movies S1 and S2. See also Supplementary Figure S3.
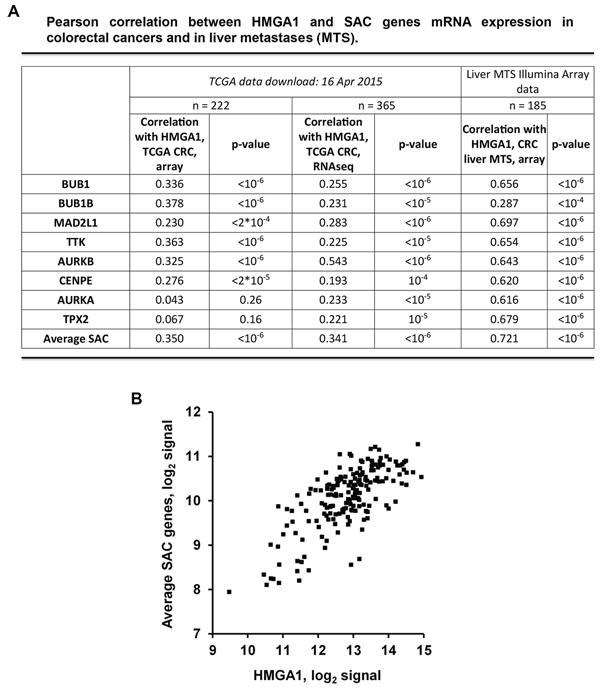
Figure 4: HMGA1 and SAC genes expression correlates in colorectal cancer samples and in liver metastases. A. Correlation between the expression of HMGA1 and of the SAC genes BUB1, BUB1B, MAD2L1, TTK, AURKB, CENPE, AURKA and TPX2 in global mRNA profiles of colorectal cancer and liver metastases (MTS). 365 and 222 clorectal carcinoma samples were profiled by The Cancer Genome Atlas (TCGA; http://cancergenome.nih.gov/) with, respectively, RNAseq and DNA microarrays. 185 liver MTS samples were profiled with Illumina array. B. Dot-plot depicting the correlation between HMGA1 and average SAC genes in liver MTS.
Therefore, human colon carcinoma show SAC gene overexpression that strongly correlates with that of HMGA1, likely contributing to cancer progression.
DISCUSSION
Overexpression of HMGA proteins, a general feature of human malignancies [3], has a critical role in cancer progression since it inhibits p53-dependent apoptosis by modulating transcription of p53 [27] and p53-target genes (reviewed in [14]), impairs DNA repair [28] and induces the epithelial-mesenchymal transition (EMT) [29, 8]. Consistently, HMGA protein expression is associated with a highly malignant phenotype being a marker of poor prognosis for cancer patients as their overexpression correlates with the resistance to anti-cancer therapies [28] and a reduced survival [6].
Also alterations in chromosome number or aneuploidy are a feature of highly malignant neoplasias and it is due to defects in the mitotic checkpoint that controls chromosome segregation during mitosis [17]. Alterations of the spindle assembly checkpoint genes levels likely account for aneuploidy in several human cancer (reviewed in [30, 31]) since mitotic checkpoint impairment and aneuploidy in human tumour cells are often associated with changes in the SAC gene-encoded protein levels [30]. It has also been reported that in some tumour cells these changes occur through altered transcriptional regulation by tumour suppressors or oncogene products [32, 33].
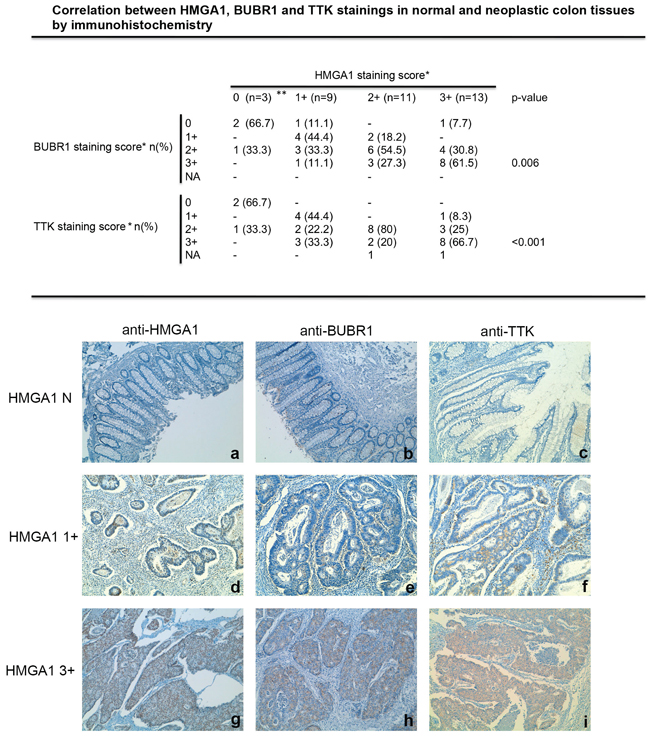
Figure 5: HMGA1 proteins expression correlates with BUBR1 and TTK expression in colorectal cancer samples. Correlation between HMGA1, BUBR1 and TTK stainings in normal and neoplastic colon tissues by immunohistochemistry. *HMGA1, BUBR1 and TTK staining scores were: negative (N), <10% of positive cells; +, positive cells; 1+, 10–40% of positive cells; 2+, 41–70% of positive cells; 3+, 71–100% of positive cells. n, number of cases; %, percentage of examined cases; NA, not assessable; **normal control tissues. The correlation between HMGA1 and BUBR1 and between HMGA1 and TTK immunoreactivity are statistically significant: p = 0.006 and p < 0.001, respectively, calcuted by χ2 test. Representative images of paraffin sections analyzed by immunohistochemistry using anti-HMGA1, anti-BUBR1 and anti-TTK antibodies are shown. Immunostaining of normal mucosa negative (N) for HMGA1 a. BUBR1 b. and TTK c. are shown. Immunostaining of a well-differentiated colon carcinoma showing a weak immunoreactivity for HMGA1 d. BUBR1 e. and TTK f. are shown. Immunostaining of moderately differentiated colon carcinoma showing a strong immunoreactivity for HMGA1 g. BUBR1 h. and TTK i. are shown. Magnification is 10X.
Therefore, in order to investigate the mechanisms accounting for the association of HMGA1 overexpression and chromosome instability, we have analyzed the ability of the HMGA1 proteins to transcriptionally regulate the genes involved in SAC.
Here, we report that HMGA1 proteins are able to activate the expression of the SAC genes Ttk, Mad2l1, Bub1 and Bub1b binding to their promoter regions. Consistently, HMGA1i-interfered HeLa cells (HMGA1i) show downregulation of these genes, whereas HMGA1-overexpression in several human colon cancer and NIH3T3 cells induces their upregulation. Moreover, the analysis of mitotic cells by immunofluorescence showed the presence of a high number of unaligned chromosomes in metaphase in HMGA1i cells associated to a reduction of prometaphase time. This alteration suggests that the HMGA1i cells start the anaphase without waiting for the proper chromosome alignment due to SAC impairment. Interestingly, the HMGA1-interfered HeLa cells resemble the cells in which the SAC gene Bub1b was depleted [34], indicating that HMGA1 depletion affects the mitotic checkpoint in cultured cells.
Notably, we have found a strong correlation between HMGA1 and BUBR1 and TTK protein levels in human colon carcinomas (Figure 4). Moreover, analysis of the TCGA expression data generated on CRC showed a statistically significant correlation, with the highest Pearson index of 0.54, between HMGA1 and SAC genes expression, evaluated either by microarray analysis or by RNAseq. This correlation strongly increased in liver metastases from colon carcinomas (pearson r = 0.72), supporting the idea that HMGA1-induced SAC genes deregulation may be important during tumour progression.
Altogether, these findings suggest that SAC gene overexpression induced by HMGA1 may have a role in colorectal cancer progression causing chromosome instability. Indeed, although it has also been demonstrated that mice carrying conditional Bub1 mutation develop severe defects ranging from early lethality to tumorigenesis [35], even SAC gene overexpression has been reported to impair the spindle assembly checkpoint playing a critical role in cancer progression. In fact, MAD2 overexpression is a common event in many human tumors [36, 37], and its overexpression increases nondisjunction events and aneuploidy in human fibroblasts and cell lines [32]. Moreover, Bub1 and Bub1b expression levels are drastically upregulated in gastric cancer associated with tumor cell proliferation [23]. Furthermore, colorectal cancer patients showing Bub1 and Bub1b upregulation have a shorter relapse-free survival with respect to the groups showing normal expression of these genes [38].
In conclusion, based on the results presented here, we propose a novel mechanism by which HMGA1 overexpression contributes to cancer progression activating SAC gene expression, thereby inducing chromosomal instability that eventually leads to a more advanced cancer status.
MATERIALS AND METHODS
Cell cultures, transfections and plasmids
NIH3T3 and HeLa cell lines were cultured in DMEM with 10% FBS, L-glutamine, and antibiotics (Invitrogen, Carlsbad, CA). HCT116, SW620 and SW48 were cultured in McCoy’s with 10% FBS, L-glutamine, and antibiotics (Invitrogen). For live-cell imaging, cells were cultured in DMEM medium without phenol red, supplemented with heat-inactivated FBS (Invitrogen). HCT116, SW620, SW48 and NIH3T3 cells were transfected using Lipofectamine-Plus reagent (Invitrogen) according to manufacturer’s instructions. The pcDNA3.1-Hmga1b and pCEFL-HA-Hmga1b vectors were previously described, respectively [39, 40]. The pLuc-Bub1b reporter plasmid and pT81-Mad2l1 promoters were gifts of Dr. P. Carbon [41] and Dr. CW Lee [42], respectively. The Bub1 promoter region was amplified by PCR from human genomic DNA using the following primers:
lucBub1Fw: 5′-AATTCTCGAGGCTTGAAGCTGT TTGACAGG-3′
lucbub1Re: 5′-AATTAAGCTTCACATTCCAAAC CCAGGAAG-3′
The forward and reverse primers contain, respectively, the recognition sites for the restriction enzymes Hind III and XhoI. The amplified fragment was cloned into pGL3-Basic Firefly luciferase vector (Promega, Fitchburg, WI, USA) at the XhoI and Hind III sites upstream the luciferase gene. Human Ttk promoter spanning from −524 to +72 relative to the transcription start was previously reported [43].
Luciferase assay
Cells were plated in 6 wells plates and after 24 hours were transfected with 100 ng of pLuc-Bub1, pLuc-Bub1b, pLuc-Mad2l1 or pLuc-Ttk expression vectors together with 50 ng of pCMV-Renilla plasmid and with different amount of pcDNA3.1-Hmga1b expression vector. Luciferase and Renilla activities were assessed with the Dual-Light Luciferase system (Promega), 48 h after the transfection. Luciferase activity was normalized for the Renilla activity. All the experiments were performed three times in duplicate and the mean ± SD was reported.
Protein extraction, western blotting, and antibodies
Cells were lysed in lysis buffer containing 1% NP40, 1 mM EDTA, 50 mM Tris-HCl (pH 7.5) and 150 mM NaCl, supplemented with complete protease inhibitors mixture (Roche Branford, CT, USA). Total proteins were separated by SDS-polyacrylamide gel electrophoresis and transferred to nitrocellulose membranes (Amersham, Rainham, UK) by elettroblotting. Membranes were blocked with 5% non-fat dry milk and incubated with antibodies anti-actin (sc-1616, Santa Cruz Biotechnology), anti-HMGA1 [44], anti-BUBR1 (612503, BD Transduction Laboratories), anti-TTK (C-19, sc-540 Santa Cruz Biotechnology), anti-MAD2 (610678, Transduction Laboratories).
Chromatin immunoprecipitation (ChIP) assay
48 hours after transfection, cells have been treated with formaldehyde 1%, washed and then lysed isolating the nuclei. Then the nuclei have been in turn lysed and chromatin has been sonicated. Chromatin has been immunoprecipitated using anti-HMGA1 antibody [39] or normal rabbit IgG as negative control. After the immunoprecipitation, the chromatin has been incubated overnight at 65°C with DNAse-free RNAse (Roche). Next day, the samples have been incubated 3 hours at 50°C with 0, 5% SDS and 0, 5 mg/ml Proteinase K (Roche) and after the DNA has been purified with a phenol-chloroform extraction. For qPCR analysis, 2 μl out of 150 μl immunoprecipitated DNA was used with primers described below. Gapdh promoter amplicon was used as negative control in all the experiments. Input DNA was used as positive control.
Primers used were:
Bub1-prom -760/-567 Fw 5′-AACCCATCACTTTC CAGTGC-3′
Bub1-prom -760/-567 Re 5′-ACATCCCAGATGCTG AAACC-3′
Bub1b-prom -740/-550 Fw 5′-GCAAGAAGAAGAC CCTGTCTC-3′
Bub1b-prom -740/-550 Re 5′-ATGCTATGGTTCCC AAGGTG-3′
Mad2l1-prom -442/-198 Fw 5′-ACCTTATTCCTGT CCTGCCC-3′
Mad2l1-prom -442/-198 Re 5′-CCACAGCTTTACA GGGTTCG-3′
Ttk-prom -380/-194 Fw 5′-CCGCAAACAGATCAA CGAG-3′
Ttk-prom -380/-194 Re 5′-CGTGAGAGCCCTTCTC AATC-3′
Gapdh-prom-Fw 5′-CCCAAAGTCCTCCTGTTT CA-3′
Gapdh-prom-Re 5′-GTCTTGAGGCCTGAGCTA CG-3′
RNA interference, RNA extraction and quantitative PCR
RNA interference was obtained by HMGA1-specific siRNA sequences (QiagenHs_HMGA1_5 (SI02662023) Sense strand GGACAAGGCUAACAUCCCATT and Antisense strand UGGGAUGUUAGCCUUGUCCAG] using Lipofectamine RNAi MAX (Invitrogen), according to manufacturer’s instructions. Qiagen AllStars control siRNA (SI03650318) was used as negative control. Cells were transduced with 40 nM of siRNA using RNAiMAX reagent (Invitrogen) according to the manufacturer’s instructions and analyzed after 48 hours. Red fluorescent oligonucleotides (Block-it, Invitrogen) were used to evaluate transfection efficiency. In our conditions, about 80% of the cells transfected by siRNA molecules. Total RNA was isolated as already described [45]. qPCR analysis for Bub1, Bub1b, Mad2l1, Ttk and Hmga1 was performed using the Power SYBR Green PCR Master Mix (Applied Biosystems) according to manufacters’s instructions with following primer sequences:
humanHMGA1-Fw 5′-CAACTCCAGGAAGGAAA CCA-3′
humanHMGA1-Re 5′-AGGACTCCTGCGAGAT GC-3′
humanBub1-Fw 5′-ACACCATTCCACAAGCTT CC-3′
humanBub1-Re 5′-CGCCTGGGTACACTGTTT TG-3′
humanBub1b-Fw 5′-TGGAAGAGACTGCACGAC AG-3′
humanBub1b-Re 5′-CAGGCTTTCTGGTGCTTA GG-3′
humanTtk-Fw 5′-ACCAAGCAGCAATACCTTG G-3′
humanTtk-Re 5′-ACTGACAAGCAGGTGGAA AG-3′
humanMad2l1-Fw 5′-GACATTTCTGCCACTGTT GG-3′
humanMad2l1-Re 5′-AACTGTGGTCCCGACTCT TC-3′
humanActin-Fw 5′-CCAACCGCGAGAAGATGA -3′
humanActin-Re 5′-CCAGAGGCGTACAGGGAT AG -3′
mouseBub1-Fw 5′- CAAGGACCTTCCTGCTTC TG-3′
mouseBub1-Re5′-GACTTGGACCCCTCAATTCC-3′
mouseBub1b-Fw5′-GCCAGATTGCAGATTGCTT C-3′
mouseBub1b-Re 5′- GGACAGATGGAACAGGAC AG-3′
mouseTtk-Fw 5′-ATATGGCCCCAGAAGCAAT C-3′
mouseTtk-Re 5′-CCCCAAGGACCAGACATCA C-3′
mouseMad2l1-Fw -5′-AGAAACTGGTGGTGGTC ATC-3′
mouseMad2l1-Re 5′-CGAACACCTTCCTCTTTT GC-3′
mouseActin-Fw 5′-CTAAGGCCAACCGTGAAA AG-3′
mouseActin-Re 5′-ACCAGAGGCATACAGGGA CA-3′
To calculate the relative expression levels we used the 2-ΔΔCT method [46]. Primers specific for the actin were used for normalization of qPCR data.
Statistical analysis
Student’s t test was used to determine the significance for all the quantitative experiments. Error bars represent the standard deviation (SD) of the average. A p-value < 0.05 was considered statistically significant.
The χ2 test was used to test the relationship between the immunoreactivity of HMGA1 and that of BUBR1 and TTK in colon samples. The test indicates how much of the association is accounted for linear trend. Statistical significance for all the tests was assessed by calculating the p-value.
For correlation analysis, TCGA expression data for HMGA1, BUB1, BUB1B, MAD2L1 and TTK in colorectal cancer were downloaded as z-scores from the cBioPortal (http://www.cbioportal.org). Pearson correlation between HMGA1 and SAC gene expression was calculated with Microsoft Excel. Statistical significance of the observed values was assessed on the online portal “Simple Interactive Statistical Analysis” (http://www.quantitativeskills.com/sisa/statistics/correl.htm).
Immunofluorescence
Cells plated on cover-slides in 12 wells plates were fixed in 4% formaldehyde in PBS and permeabilized in a solution of 0.25% Triton X-100 in PBS. Anti β-tubulin antibody conjugated to CY3 (Sigma) was used to identify mitotic spindle in mitotic cells, and DAPI staining was used to identify chromosomes. Cells were observed with a fluorescent microscope (Zeiss, magnification 63X or 100X).
Live-cell imaging
Cells were seeded in slides 8-well (80826, ibiTreat, Ibidi) and observed under an Eclipse Ti inverted microscope (Nikon) using a 40x objective (Nikon). During the observation, cells were kept in a microscope stage incubator (Basic WJ, Okolab) at 37°C and 5% CO2. DIC images were acquired over a 24 hr period by using a DS-Qi1Mc camera. Image and video processing were performed with NIS-Elements AR 3.22.
Immunohistochemistry
Immunohistochemical analysis of paraffin-embedded tissues was performed with antibodies against HMGA1, BUBR1 and TTK, using polyclonal antibodies above mentioned, as previously described [47]. No staining was observed when normal colon samples were stained without the primary antibodies (data not shown).
ACKNOWLEDGMENTS
We are grateful to Dr A. De Stefano for statistical analysis, and Mr. L. Di Guida from “Centro di Eccellenza di Biotecnologie e Biomedicina” (CEBBM) for technical support. We thank F. Magi for the analysis of the nuclei. Live cell imaging experiments were performed at the Nikon Reference Centre, CNR Institute of Molecular Biology and Pathology. We acknowledge Dr Giulia Guarguaglini and Dr Patrizia Lavia for support. Mara Tornincasa is recipient of a fellowship from Fondazione Italiana per la Ricerca sul Cancro (FIRC).
Abbreviations
Mad2l1, mitotic arrest deficient-like 1; Bub1, budding uninhibited by benzimidazoles 1; CIN, chromosome instability; SAC, spindle assembly checkpoint; HMGA1, high mobility group A1; RNAi, RNA interference.
FUNDINGS
This work was supported by grants (IG-11477, MFAG-11702 and MFAG-10363) from the Associazione Italiana Ricerca sul Cancro (AIRC), from the Italian Ministry of Economy and Finance to the CNR for the “Project FaReBio di Qualità”, from Ministero Salute-Giovani Ricercatori, PNR-CNR Aging “Program 2012–2014”, Project CRÈME from the Regione Campania.
CONFLICTS OF INTEREST
The authors declare no competing financial interests.
REFERENCES
1. Johnson KR, Lehn DA, Reeves R. Alternative processing of mRNAs encoding mammalian chromosomal high-mobility-group proteins HMG-I and HMG-Y. Mol Cell Biol. 1989; 9:2114–2123.
2. Manfioletti G, Giancotti V, Bandiera A, Buratti E, Sautière P, Cary P, Crane-Robinson C, Coles B, Goodwin GH. cDNA cloning of the HMGI-C phosphoprotein, a nuclear protein associated with neoplastic and undifferentiated phenotypes. Nucleic Acids Res. 1991; 19:6793–6797.
3. Fusco A, Fedele M. Roles of the HMGA proteins in cancer. Nat Rev Cancer. 2007; 7:899–910.
4. Chiappetta G, Avantaggiato V, Visconti R, Fedele M, Battista S, Trapasso F, Merciai BM, Fidanza V, Giancotti V, Santoro M, Simeone, Fusco A. High level expression of the HMGA1 gene during embryonic development. Oncogene. 1996; 13:2439–2446.
5. Zhou X, Benson KF, Ashar HR, Chada K. Mutation responsible for the mouse pygmy phenotype in the developmentally regulated factor HMGI-C. Nature. 1995; 376:771–774.
6. Liau SS, Whang E. HMGA1 is a molecular determinant of chemoresistance to gemcitabine in pancreatic adenocarcinoma. Clin Cancer Res. 2008; 14:1470–1477.
7. Wood LJ, Maher JF, Bunton TE, Resar LM. The oncogenic properties of the HMG-I gene family. Cancer Res. 2000; 60:4256–4261.
8. Reeves R, Edberg DD, Li Y. Architectural transcription factor HMGI (Y) promotes tumor progression and mesenchymal transition of human epithelial cells. Mol Cell Biol. 2001; 21:575–594.
9. Baldassarre G, Fedele M, Battista S, Vecchione A, Klein-Szanto AJ, Santoro M, Waldmann TA, Azimi N, Croce CM, Fusco A. Onset of natural killer cell lymphomas in transgenic mice carrying a truncated HMGI-C gene by the chronic stimulation of the IL-2 and IL-15 pathway. Proc Natl Acad Sci U S A. 2001; 98:7970–7975.
10. Belton A, Gabrovsky A, Bae YK, Reeves R, Iacobuzio-Donahue C, Huso DL, Resar LM. HMGA1 induces intestinal polyposis in transgenic mice and drives tumor progression and stem cell properties in colon cancer cells. PLoS One. 2012; 7:e30034.
11. Fedele M, Battista S, Kenyon L, Baldassarre G, Fidanza V, Klein-Szanto AJ, Parlow AF, Visone R, Pierantoni GM, Outwater E, Santoro M, Croce CM, Fusco A. Overexpression of the HMGA2 gene in transgenic mice leads to the onset of pituitary adenomas. Oncogene. 2002; 21:3190–3198.
12. Fedele M, Pentimalli F, Baldassarre G, Battista S, Klein-Szanto AJ, Kenyon L, Visone R, De Martino I, Ciarmiello A, Arra C, Viglietto G, Croce CM, Fusco A. Transgenic mice overexpressing the wild-type form of the HMGA1 gene develop mixed growth hormone/prolactin cell pituitary adenomas and natural killer cell lymphomas. Oncogene. 2005; 24:3427–3435.
13. Xu Y, Sumter TF, Bhattacharya R, Tesfaye A, Fuchs EJ, Wood LJ, Huso DL, Resar LM. The HMG-I oncogene causes highly penetrant, aggressive lymphoid malignancy in transgenic mice and is overexpressed in human leukemia. Cancer Res. 2004; 64:3371–3375.
14. Fedele M, Fusco A. HMGA and cancer. Biochim Biophys Acta. 2010; 1799:48–54. Review.
15. Mussnich P, D’Angelo D, Leone V, Croce CM, Fusco A. The High Mobility Group A proteins contribute to thyroid cell transformation by regulating miR-603 and miR-10b expression. Mol Oncol. 2013; 7:531–542.
16. Reeves R, Adair JE. Role of high mobility group (HMG) chromatin proteins in DNA repair. DNA Repair. 2005; 4:926–938.
17. Mertens F, Johansson B, Mitelman F. Isochromosomes in neoplasia. Genes Chromosomes Cancer. 1994; 10:221–230.
18. Fang X, Zhang P. Aneuploidy and tumorigenesis. Semin Cell Dev Biol. 2011; 22:595–601.
19. Rao CV, Yamada HY, Yao Y, Dai W. Enhanced genomic instabilities caused by deregulated microtubule dynamics and chromosome segregation: a perspective from genetic studies in mice. Carcinogenesis. 2009; 30:1469–1474.
20. Lin SF, Lin PM, Yang MC, Liu TC, Chang JG, Sue YC, Chen TP. Expression of hBUB1 in acute myeloid leukemia. Leuk Lymphoma. 2002; 43:385–391.
21. Alizadeh AA, Eisen MB, Davis RE, Ma C, Lossos IS, Rosenwald A, Boldrick JC, Sabet H, Tran T, Yu X, Powell JI, Yang L, Marti GE, Moore T, Hudson J Jr, Lu L, Lewis DB, Tibshirani R, Sherlock G, Chan WC, Greiner TC, Weisenburger DD, Armitage JO, Warnke R, Levy R, Wilson W, Grever MR, Byrd JC, Botstein D, Brown PO, Staudt LM. Distinct types of diffuse large B-cell lymphoma identified by gene expression profiling. Nature. 2000; 403:503–511.
22. van’t Veer LJ, Dai H, van de Vijver MJ, He YD, Hart AA, Mao M, Peterse HL, van der Kooy K, Marton MJ, Witteveen AT, Schreiber GJ, Kerkhoven RM, Roberts C, Linsley PS, Bernards R, Friend SH. Gene expression profiling predicts clinical outcome of breast cancer. Nature. 2002; 415:530–536.
23. Grabsch H, Takeno S, Parsons WJ, Pomjanski N, Boecking A, Gabbert HE, Mueller W. Overexpression of the mitotic checkpoint genes BUB1, BUBR1, and BUB3 in gastric cancer-association with tumour cell proliferation. J. Pathol. 2003; 200:16–22.
24. Shigeishi H, Oue N, Kuniyasu H, Wakikawa A, Yokozaki H, Ishikawa T, Yasui W. Expression of Bub1 gene correlates with tumor proliferating activity in human gastric carcinomas. Pathobiology. 2001; 69:24–29.
25. Chiappetta G, Manfioletti G, Pentimalli F, Abe N, Di Bonito M, Vento MT, Giuliano A, Fedele M, Viglietto G, Santoro M, Watanabe T, Giancotti V, Fusco A. High mobility group HMGI(Y) protein expression in human colorectal hyperplastic and neoplastic diseases. Int J Cancer. 2001; 91:1447–1451.
26. Fedele M, Bandiera A, Chiappetta G, Battista S, Viglietto G, Manfioletti G, Casamassimi A, Santoro M, Giancotti V, Fusco A. Human colorectal carcinomas express high levels of high mobility group HMGI(Y) proteins. Cancer Res. 1996; 56:1896–1901.
27. Puca F, Colamaio M, Federico A, Gemei M, Tosti N, Bastos AU, Del Vecchio L, Pece S, Battista S, Fusco A. HMGA1 silencing restores normal stem cell characteristics in colon cancer stem cells by increasing p53 levels. Oncotarget. 2014; 5:3234–3245.
28. Palmieri D, Valentino T, D’Angelo D, De Martino I, Postiglione I, Pacelli R, Croce CM, Fedele M, Fusco A. HMGA proteins promote ATM expression and enhance cancer cell resistance to genotoxic agents. Oncogene. 2011; 30:3024–3035.
29. Pegoraro S, Ros G, Piazza S, Sommaggio R, Ciani Y, Rosato A, Sgarra R, Del Sal G, Manfioletti G. HMGA1 promotes metastatic processes in basal-like breast cancer regulating EMT and stemness. Oncotarget. 2013; 4:1293–1308.
30. Kops GJ, Weaver BA, Cleveland DW. On the road to cancer: aneuploidy and the mitotic checkpoint. Nat Rev Cancer 2005; 5:773–785.
31. Gordon DJ, Resio B, Pellman D. Causes and consequences of aneuploidy in cancer. Nat Rev Genet. 2012; 13:189–203.
32. Hernando E, Nahlé Z, Juan G, Diaz-Rodriguez E, Alaminos M, Hemann M, Michel L, Mittal V, Gerald W, Benezra R, Lowe SW, Cordon-Cardo C. Rb inactivation promotes genomic instability by uncoupling cell cycle progression from mitotic control. Nature. 2004; 430:797–802.
33. Orr B, Compton DA. A double-edged sword: how oncogenes and tumor suppressor genes can contribute to chromosomal instability. Front Oncol. 2013; 3:164.
34. Ding Y, Hubert CG, Herman J, Corrin P, Toledo CM, Skutt-Kakaria K, Vazquez J, Basom R, Zhang B, Risler JK, Pollard SM, Nam DH, Delrow JJ, Zhu J, Lee J, DeLuca J, Olson JM, Paddison PJ. Cancer-Specific requirement for BUB1B/BUBR1 in human brain tumor isolates and genetically transformed cells. Cancer Discov. 2013; 3:198–211.
35. Schliekelman M, Cowley DO, O’Quinn R, Oliver TG, Lu L, Salmon ED, Van Dyke T. Impaired Bub1 function in vivo compromises tension-dependent checkpoint function leading to aneuploidy and tumorigenesis. Cancer Res. 2009; 69:45–54.
36. Chen X, Cheung ST, So S, Fan ST, Barry C, Higgins J, Lai KM, Ji J, Dudoit S, Ng IO, Van De Rijn M, Botstein D, Brown PO. Gene expression patterns in human liver cancers. Mol Biol Cell. 2002; 136:1929–1939.
37. Teixeira JH, Silva P, Faria J, Ferreira I, Duarte P, Delgado ML, Queirós O, Moreira R, Barbosa J, Lopes CA, do Amaral JB, Monteiro LS, Bousbaa H. Clinicopathologic significance of BubR1 and Mad2 overexpression in oral cancer. Oral Dis. 2015 Mar 5, doi: 10.111/odi.12335.
38. Shichiri M, Yoshinaga K, Hisatomi H, Sugihara K, Hirata Y. Genetic and epigenetic inactivation of mitotic checkpoint genes hBUB1 and hBUBR1 and their relationship to survival. Cancer Res. 2002; 62:13–17.
39. Esposito F, Tornincasa M, Chieffi P, De Martino I, Pierantoni GM, Fusco A. High-mobility group A1 proteins regulate p53-mediated transcription of Bcl-2 gene. Cancer Res. 2010; 70:5379–5388.
40. Pierantoni GM, Battista S, Pentimalli F, Fedele M, Visone R, Federico A, Santoro M, Viglietto G, Fusco A. A truncated HMGA1 gene induces proliferation of the 3T3-L1 pre-adipocytic cells: a model of human lipomas. Carcinogenesis. 2003a; 24:1861–1869.
41. Myslinski E, Gérard MA, Krol A, Carbon P. Transcription of the human cell cycle regulated BUB1B gene requires hStaf/ZNF143. Nucleic Acids Res. 2007; 35:3453–3464.
42. Jeong SJ, Shin HJ, Kim SJ, Ha GH, Cho BI, Baek KH, Kim CM, Lee CW. Transcriptional abnormality of the hsMAD2 mitotic checkpoint gene is a potential link to hepatocellular carcinogenesis. Cancer Res. 2004; 64:8666–8673.
43. Salvatore G, Nappi TC, Salerno P, Jiang Y, Garbi C, Ugolini C, Miccoli P, Basolo F, Castellone MD, Cirafici AM, Melillo RM, Fusco A, Bittner ML, Santoro M. A cell proliferation and chromosomal instability signature in anaplastic thyroid carcinoma. Cancer Res. 2007; 67:10148–10158.
44. Pierantoni GM, Agosti V, Fedele M, Bond H, Caliendo I, Chiappetta G, Lo Coco F, Pane F, Turco MC, Morrone G, Venuta S, Fusco A. High-mobility group A1 proteins are overexpressed in human leukaemias. Biochem J. 2003; 372:145–150.
45. Esposito F, De Martino M, Petti MG, Forzati F, Tornincasa M, Federico A, Arra C, Pierantoni GM, Fusco A. HMGA1 pseudogenes as candidate proto-oncogenic competitive endogenous RNAs. Oncotarget. 2014; 5:8341–54.
46. Livak KJ, Schmittgen TD. Analysis of relative gene expression data using real-time quantitative PCR and the 2(-Delta Delta C(T)) Method. Methods. 2001; 25:402–408.
47. Chiappetta G, Botti G, Monaco M, Pasquinelli R, Pentimalli F, Di Bonito M, D’Aiuto G, Fedele M, Luliano R, Palmieri EA, Pierantoni GM, Giancotti V, Fusco A. HMGA1 protein overexpression in human breast carcinomas: correlation with ErbB2 expression. Clin Cancer Res. 2004; 10:7637–7644.