
INTRODUCTION
Extranodal natural killer (NK)/T-cell lymphoma nasal type (ENKL) is a rare histopathological subtype of lymphoma with unique clinical features and geographic variation. This lymphoma usually occurs in the upper airway tract, mostly in the nasal and paranasal area; however, around 20% of cases can occur in other tissues, including the skin, soft tissue, gastrointestinal tract, and testis [1–4]. Although most of the cases of ENKL are diagnosed in the early stage of the disease, patients usually have poor response to combination chemotherapy, resulting in 46%–60% long-term survival [3, 4]. Only half of the patients with advanced-stage disease can survive for 1 year, despite improvements in treatment [5, 6].
ENKL is strongly associated with Epstein–Barr virus (EBV) infection. EBV infection is thought to be an early event in the pathogenesis of the disease [7], and additional genetic alterations are essential to induce lymphomagenesis. Mutations in well-known tumor suppressor genes (TSGs), including TP53 (20%–60% of cases) and FAS (around 50% of cases), have been reported [8], and array-based comparative genomic hybridization studies reported variable genetic changes, including gains in 1q21–q44, 2q, and 7q, and loss of 6q16–27 and 17p15–22. Among these lesions, the 6q region includes several TSGs, such as PRDM1, FOXO3, and HACE1 [9, 10]. In particular, recent studies reported frequent JAK3-activating mutations in ENKL patients using next-generation sequencing (NGS), which suggests that the JAK/STAT signaling pathway is a key molecular factor in the pathogenesis of this disease [11, 12].
Previous gene expression profiling of NK cell malignancies led to the association between apoptosis, cell adhesion molecules/extracellular matrix (ECM) receptor interaction, and signal transduction pathways (including JAK/STAT, mTOR, etc.) with ENKL tissues [13]. MicroRNA dysregulation, which is significantly enriched among genes involved in cell cycle-related, p53, and MAPK signaling, was also suggested as a mechanism of lymphomagenesis [14]. However, the current knowledge on ENKL does not adequately explain the disease pathogenesis in most cases.
Although several studies have suggested a carcinogenic mechanism for ENKL, its molecular pathogenesis remains under-recognized. Because of the rarity of the disease and limitations in obtaining sufficient amounts of fresh tissues for molecular studies, to date, its study has been restricted to a few research groups. Here, we report genomic information on ENKL using the NGS method, and suggest several novel genes or pathways involved in the pathogenesis of this disease. In addition, we provide comparative data on gene expression profiles in primary ENKL tissues, NK-cell lymphoma cell lines, and normal NK cells, which support the genetic alterations discovered in the genomic sequencing experiments.
RESULTS
ENKL samples exhibited genomic heterogeneity and frequent mutations in TSGs
We performed WES on 9 ENKL tissue samples (cancer tissue, CT1–9) and 4 NK-cell lymphoma/leukemia cell line samples (cancer cell, CC1–4), with 4 paired normal blood (normal blood, NB1–4) and 3 unpaired NK cells from healthy volunteers (normal cell, NC1–3) as controls. A total of 251 somatic mutations, including 220 nonsynonymous single nucleotide variants (nsSNVs) and 31 coding insertions/deletions (indels), were identified from 4 paired samples. However, each mutation was identified in just 1 sample, and only 5 genes (FGF10, KRAS, MLL2, FRY, and TP53) were shared by ≥ 2 samples. These somatic variants were not detected further in 5 ENKL tissues and 4 NK-cell lymphoma cell line samples. Therefore, we extended our variant analysis to include RNA-Seq and targeted sequencing of 21 paraffin-embedded samples, which were analyzed together with 13 WES samples (Supplementary Tables 1 and 2).
When all platforms were considered (WES, targeted sequencing, and RNA-Seq), STAT3 was the most frequently mutated gene (9/34 cases, 26.5%), followed by BCOR (7/34 cases, 20.6%), and MLL2 (6/34 cases, 17.6%) (Figure 1). Interestingly, their variants were nearly mutually exclusive of each other (P = 0.000044). Among the known ENKL-associated genes, mutations were most frequent in TP53 (4/34 cases, 11.8%), followed by KRAS (2/34 cases, 5.9%), and IL6R (2/34 cases, 5.9%) [15]. In total, 22 cases had mutations in TSGs, including MLL2, BCOR, and TP53, 45% of which (10/22 cases) had at least 1 loss-of-function (LOF) mutation (nonsense SNV/frameshift indel), which implies that inactivation of TSGs may play an important role in ENKL pathogenesis. A full list of variants from study samples is shown in Supplementary Table 3.
Genome analysis of ENKL revealed enrichment of alterations in the JAK/STAT pathway, among which STAT3 was the most frequently mutated gene
In JAK/STAT cascade genes, all mutations occurred at different positions, with the exception of 1 nsSNV of STAT3 encoding p.Glu616Gly, which was identified in 2 out of 34 cases. Another 2 cases showed the same amino acid alteration (STAT3 p.Ser614Arg), differing only at the nucleotide level. Interestingly, all mutations occurred at the SRC homology 2 (SH2) domain of STAT3 (Figure 2).
A recent study reported that activating mutations of JAK3 (p.Ala572Val and p.Ala573Val) may play an important role in the pathogenesis of ENKL [11]. Because of the low coverage of WES in this region, we confirmed these mutations by Sanger sequencing. A total of 39 samples were used for checking JAK3 hotspots, which included a subset of the samples used in exome and targeted sequencing and new 17 FFPE samples (ST1–17, Supplementary Table 4). Only 2 cases (2/39 cases, 5.1%) exhibited p.Ala527Val mutations, a frequency that was quite different from that mentioned in the report described above, which discovered either of 2 hotspot mutations in up to 35.4% of ENKL patients. We thoroughly examined the coding regions of JAK3 by targeted deep sequencing again, but no additional mutation was found. However, genes included in the JAK/STAT signaling pathway [16] were mutated in about 55.9% (19/34) of all cases (Figure 1).
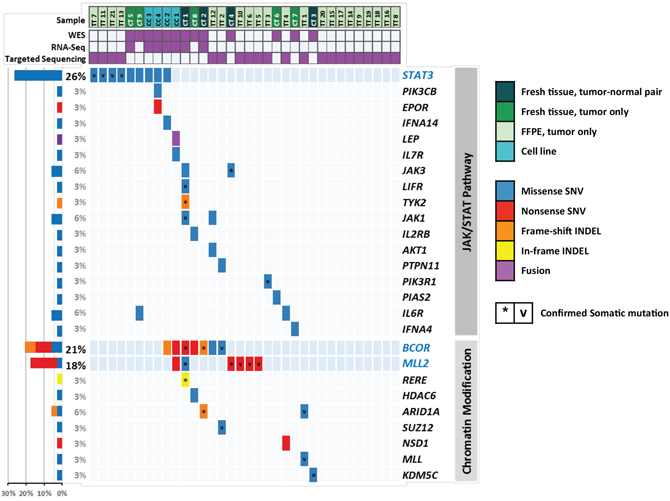
Figure 1: Distribution of mutations in ENKL. Each column represents an ENKL case, which is shown in different colors according to the platform used. Each row represents a gene in the JAK/STAT pathway or chromatin modification gene ontology. Five mutation types are also distinguished by different colors. Asterisks (*) indicate somatic mutations in four tumor-normal pairs of exome sequencing. ‘v’ marks indicate mutations in targeted sequencing which confirmed to be somatic by Sanger sequencing of matched normal (uninvolved bone marrow) samples. Bars (left) represent the mutation rates in the 34 samples. ENKL, extranodal NK/T-cell lymphoma nasal-type.
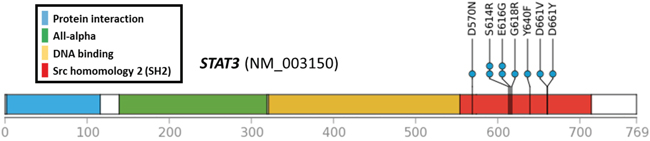
Figure 2: Locations of STAT3 mutations. All 9 missense SNVs were accumulated in the SH2 domain.
Mutations in MLL2 and BCOR, which are related to epigenetic regulation, were also frequent in ENKL
Mutations in BCOR were the second most common mutation (7/34, 20.6%), and about two-thirds of which were LOF mutations in exon 4 (1 frameshift deletion and 3 nonsense SNVs). Specific histone deacetylases (HDAC1, HDAC3, and HDACB/5) have been reported to interact with BCOR [17]. In addition, MLL2 mutations occurred in 6 cases, and all except one were nonsense SNVs. MLL2 is also known as KMT2D and encodes a lysine-specific methyltransferase that methylates the Lys-4 position of histone H3. Both MLL2 and BCOR are classified into the same GO group, “chromatin modification” (GO:0016568) [18]; cases with mutated genes belonging to this category accounted for a total of 38.2% of cancers (13/34 cases) (Figure 1). Considering the mutual exclusivity between mutations in MLL2 and BCOR and those of STAT3 (Figure 1), epigenetic dysregulation might be another important feature of ENKL pathogenesis, together with the alterations of the JAK/STAT cascade.
RNA-Seq revealed novel fusion genes and inactivation of BCOR as driver candidates
After the stepwise filtration of ambiguous calls from deFuse (described in the Methods), we selected 13 fusion candidates from cancer samples (Supplementary Table 5). These included PDE4DIP (PARP8–PDE4DIP in CC2), which was reported previously as fusion gene partners in hematologic malignancy [19]. We discovered an in-frame candidate among fusion genes, SND1–LEP of CC1, which was validated by Sanger sequencing. Even though its function in carcinogenesis remains unclear, the coverage depth pattern around breakpoints was distinctive from those of other samples. LEP is a member of the JAK/STAT signaling pathway and the fusion conserves most of the leptin domain. Supplementary Figure 1A shows SND1-LEP fusion, which were called again in TopHat-Fusion, and Supplementary Figure 1B and C shows the result of validation by RT-PCR and Sanger sequencing.
In addition to the fusion candidates mentioned above, we found BCOR inactivation in CC2, which was called in deFuse but predicted to be adjacent, alternative splicing, and deletion. CC2 is an NK-cell lymphoma cell line that was established from the circulating malignant cells of a 19-year-old female diagnosed with ENKL. The coverage pattern of WES also supported this mutation (Supplementary Figure 2); it was shown to be a homozygous deletion, although BCOR is located on X chromosome and this was a female sample.
We screened the expression levels of the TSGs that were selected from the cancer gene census, and found that 2 genes, BCOR and SH2B3, showed near-complete suppression (fragments per kilobase of transcript, per million fragments sequenced (FPKM) < 0.1), whereas every NC sample had FPKM > 1 (Supplementary Figure 3A and 3B). As previous studies reported that SH2B3 provides negative feedback on the JAK/STAT pathway [20], its expressional suppression might also affect the development of ENKL.
The gene expression profiles of both ENKL tissues and cell line samples reflect JAK/STAT cascade dysregulation and epigenetic alteration
We conducted sample clustering analyses to compare the overall gene expression profiles of each gene, and found that samples were well clustered by their sample groups, CT, CC, and NC. However, CT was clustered together with NC, and not CC, even though they both represent ENKL cancer samples (Supplementary Figure 4A). One previous report listed differentially expressed genes (DEGs) of ENKL using array-based methods [13]. We compared their log2(fold change) values with those found here for CT and CC samples, respectively (Supplementary Figure 4B and 4C). Among DEGs that satisfied |log2(ratio)| ≥ 1 in both studies, 86.63% (175 out of 202) had the same direction in case of CT (r2 = 0.32), whereas only 68.84% (148 out of 215) had changes with the same direction in CC samples (r2 = 0.11); this pattern was concordant with the results of clustering, showing that CC samples were distant from CT. Upregulated genes tended to be well correlated with CT samples (CT, 150 out of 155; CC, 86 out of 148), whereas downregulated genes were correlated with CC samples (CT, 25 out of 47; CC, 62 out of 67).
In the principal component analysis, CC was also separated from the other groups in the PC1 axis. However, in PC2, CT and CC were clustered together and were located apart from NC. Despite their huge difference, CT and CC samples shared 220 upregulated and 260 downregulated DEGs compared with NC samples (Supplementary Figure 4D and 4E, Figure 3A, and Supplementary Table 6). Upregulated DEGs were enriched in the GOs (biological process) regulating phosphatidylinositol 3-kinase (PI3K) activity, which include the JAK/STAT cascade, whereas downregulated DEGs were among the GOs (immune system process) related to T-cell immunity (Figure 3B, Supplementary Table 7). These results suggest that gene expression patterns also support major roles for the PI3K or JAK/STAT pathways in ENKL pathogenesis. Among the Kyoto Encyclopedia of Genes and Genomes (KEGG) gene sets, several pathways related to cancer were ranked in the top 10, in addition to “JAK/STAT signaling pathway” and “mTOR signaling pathway, ” which is located downstream of the JAK/STAT cascade (Figure 3C). We also found that several CGP gene sets related to the polycomb complex PRC2, which is involved in H3K27 trimethylation, were enriched among these upregulated genes (including the Suz12 and Eed target genes). These findings support the contention that epigenetic dysregulation might be a key molecular factor in ENKL pathogenesis, as suggested in the mutation section (Figure 3D).
Cancer tissue-specific DEGs are linked to the pathophysiologic features of ENKL
As there was a huge difference between CT and CC regarding gene expression, we selected genes that were upregulated only in CT, which might reflect the tumor microenvironment of ENKL (Supplementary Table 6). As shown in Figure 4A and 4B, many gene sets involved in blood coagulation and vasculature development were significantly enriched in these DEGs, which was consistent with the results of a previous study that reported the activation of angiogenesis-related genes in ENKL tissues (Supplementary Table 7) [13]. Enriched pathways such as “focal adhesion” and “ECM receptor interaction” also suggest that these genes are activated during the interaction between cancer and the adjacent environment. In particular, gene sets such as “pathways in cancer” were also among the most significant gene sets, and might promote the development of ENKL. Interestingly, cancer-related CGP gene sets were even more significant in CT-specific DEGs than were those of commonly upregulated ones, such as genes that are activated in angioimmunoblastic lymphoma (Figures 3D and 4C).
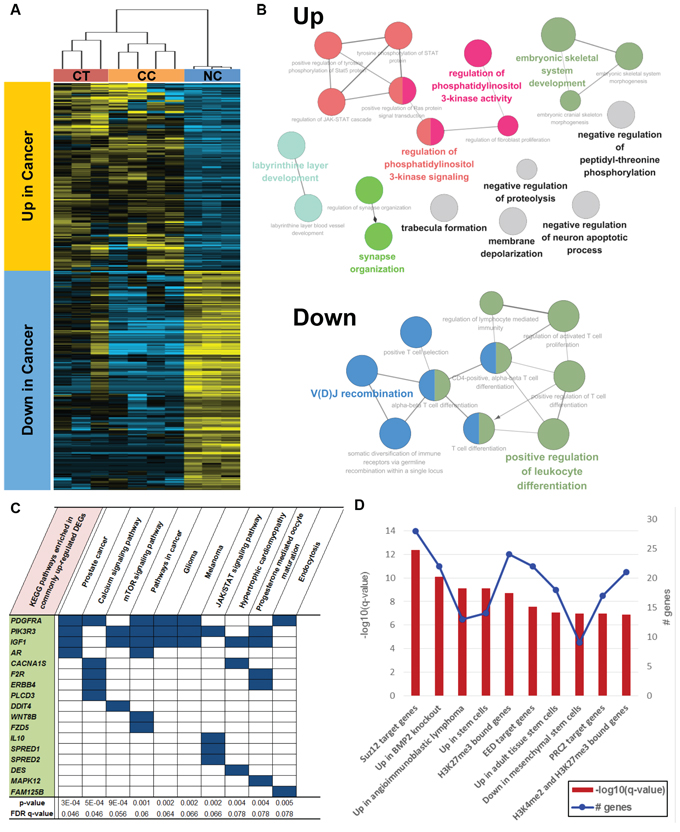
Figure 3: Functional enrichment of commonly upregulated or downregulated genes in both CT and CC samples. A. Hierarchical clustering and heat map of common DEGs. B. Gene ontologies enriched in up- or downregulated genes. C. Top 10 KEGG pathways and D. top 10 CGP gene sets enriched in upregulated genes.
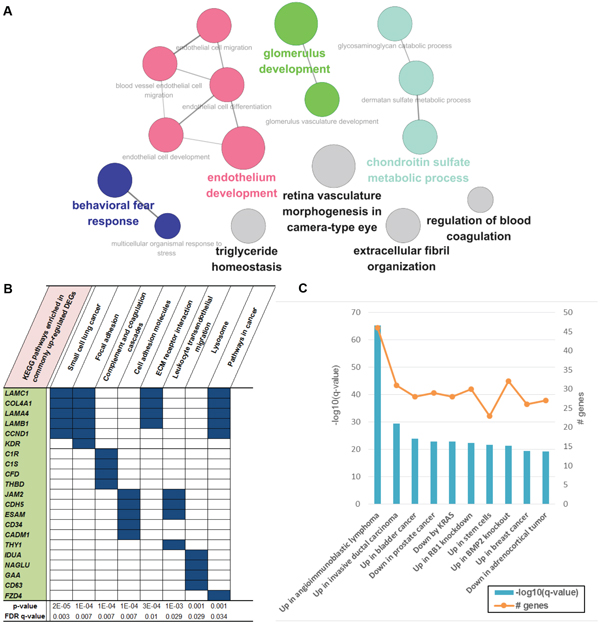
Figure 4: Functional enrichment of genes that were upregulated only in CT samples. A. Gene ontologies enriched in CT-specific upregulated genes. There were several vasculature-development- or endothelium-development-related ontologies, which were the most significant. B. Top 10 KEGG pathways and C. top 10 CGP gene sets enriched in these genes.
DISCUSSION
In this study, the molecular background of ENKL was explored using genome and transcriptome sequencing, which enabled us to discover novel drivers and therapeutic targets. We designed the study to screen exonic regions of known cancer genes, and mutations were shown to be enriched in STAT3, BCOR, and MLL2. In terms of functional gene groups, the JAK/STAT cascade and histones modification-related gene covered 55.9% and 38.2% of samples, respectively. Gene expression analysis also supported these functional groups in ENKL pathogenesis; moreover, we reported the cancer tissue-specific alterations at the molecular level.
Previous studies have suggested that the JAK/STAT and MAPK signaling pathways are crucial for disease development [13, 14]. In particular, frequent JAK3-activating mutations have shown that the JAK/STAT signaling pathway is a key molecular factor of ENKL [11]. However, the mutation frequency of JAK3 (p.Ala572Val and p.Ala573Val) was much lower in our cases compared with previous reports (5.1% vs 35.4%). In a recent study of French population [12], JAK3 mutations encoding p.Ala573Val were observed in the 15.8% of ENKL samples (3/19). In that study, most of the cases expressed phosphorylated JAK3 regardless of their JAK3 mutation status (100% of mutant cases and 84.2% of wild type cases). Such result was also supported by a study of Japanese population that reported frequent JAK3 phosphorylation and low JAK3 mutation (5.0%). Another Japanese group even showed that no JAK3 mutations (p.Ala572Val or p.Ala573Val) was found in a total of 49 samples which included 17 ENKL cases [21]. These results suggest that the function of JAK3 might be altered mainly due to phosphorylation than mutation, and molecular backgrounds of JAK3-activation in ENKL might be different according to ethnicity. Instead of JAK3 mutations, we identified several alterations in other components of the JAK/STAT pathway. About a quarter (26.5%) of our ENKL cases had nsSNVs in STAT3, which were clustered on the SH2 domain. Its pro-oncogenic role has been demonstrated by stabilizing via the formation of dimers with other STAT proteins through reciprocal SH2 domain interactions [22]. Frequent mutations in this domain can be presumed to be gain-of-oncogenic function mutations; however, additional studies are needed to confirm these mutations and their functional effects.
STAT3 can be activated by extrinsic ways as well as by intrinsic ways. EBV, the well-known pathogen of ENKL, is one of the extrinsic sources of activation of STAT3; the latent membrane protein 1 of EBV was suggested as a STAT-activating agent in a mouse model [23]. Another study demonstrated that the Epstein–Barr nuclear antigen 2 also was a coactivator for the transcriptional enhancer of STAT3 [24]. Our results can be partly interpreted as intrinsic components of STAT3 activation. We found a novel fusion gene of LEP in 1 sample, the protein product of which (leptin) plays a role at the top of the JAK/STAT pathway as a stimulator of STAT3 phosphorylation [25]. Loss of SH2B3 has also been reported to increase STAT3 phosphorylation [26], the expression of which was nearly completely suppressed in half of the cases (Supplementary Figure 3B). In addition to the inactivation of SH2B3, we found that PIK3R3 was upregulated in all ENKL samples; this gene is also known as a downstream element of the JAK/STAT cascade and leads to cell proliferation and survival (KEGG pathways). Together with STAT3 mutations, or independently, these alterations may play roles in ENKL pathogenesis.
Epigenetic dysregulation is an emerging part of cancer genomics, which is attributed to new genes discovered by NGS technology. The protein encoded by MLL2 is a histone methyltransferase that targets the H3K4 site, and LOF mutation of MLL2 has been reported in hematologic malignancy. In one recent study that was performed using NGS, B cell lymphomas had frequent somatic mutations in MLL2, most of which (83.3%) were LOF mutations, similar to ours (85.7%) [27]. Some types of solid tumors also had MLL2 mutations, although those exhibited a somewhat lower proportion of LOF (11.8% of renal cell carcinoma [28] and 66.7% of medulloblastoma [29] cases). The effect of altered MLL2 might vary according to tumor type.
BCOR was first reported as a corepressor of BCL-6 that is critical for germinal center formation [17], and its role in hematologic malignancy has been studied previously. Interestingly, most BCOR alterations occurred in male ENKL cases (6 mutations in men and 1 mutation in women), although this association was not statistically significant (27.3% of men vs 8.3% of women, P = 0.378). We tried to check whether mutations in BCOR in the X chromosome are related to the male predominance. However, BCOR mutation rates of male patients were lower in other male predominat malignancies (myelodysplastic syndrome (MDS), 3.8% of men vs 6.5% of women [31]; acute myeloid leukemia (AML), 5.5% of men vs 6.9% of women [32]; EBV-positive gastric cancer (EBV-GC), 14.2% of men vs 20% of women [33]). Next, we reviewed several public data to check whether BCOR mutations are associated with EBV infection-related malignancies. EBV-GCs, one of 4 molecular subtypes of gastric cancer, had frequent BCOR mutations (3 nonsense and 1 splicing) compared with the other 3 types (15.4% vs 4.8%, P = 0.051) [33]. With reference to the cBioPortal for Cancer Genomics (http://www.cbioportal.org), we selected several other solid tumors that are among the top 10 BCOR-mutated cancers and have available supplementary data sets (uterine endometrial carcinoma (UECA) [34], lung adenocarcinoma (LUAD) [35], melanoma [36], and colorectal adenocarcinoma (CRC) [37]), along with those of 2 hematologic malignancies, AML [32] and MDS [31]. Figure 5 shows the BCOR mutation rate and the proportion of LOF mutations for each cancer. EBV-associated malignancies (ENKL and EBV-GC) showed high percentages for both properties. UECA, which is not associated with EBV infection, exhibited a rather high BCOR mutation rate, but a low LOF proportion in BCOR, similar to LUAD and melanoma. The hematologic malignancies showed opposite patterns to those observed in UECA. In summary, EBV infection might be related to high mutation rates of BCOR, and LOF mutations seem to account for their majority.
As summarized above, BCOR mutation tended to occur significantly more frequently in EBV-associated malignancy (odds ratio = 3.74, P = 0.001) and mostly in the form of LOF. Previously, the oncogenic effect of EBV was explained by various epigenetic regulation mechanisms [38]. Considering that BCOR regulates chromatin modification by interacting with some histone-deacetylase-family genes, we were able to link the 2 major features, EBV infection and BCOR mutation, via an epigenetic mechanism. Overall, the mutations found in MLL2 and BCOR led to the association between epigenetic dysregulation and ENKL pathogenesis. To the best of our knowledge, the present study was the first to identify mutations in chromatin-modifying genes in this disease. Together with the mutational features, RNA-Seq data also support this finding; upregulated genes were enriched in PRC2-related gene sets in gene expression analysis.
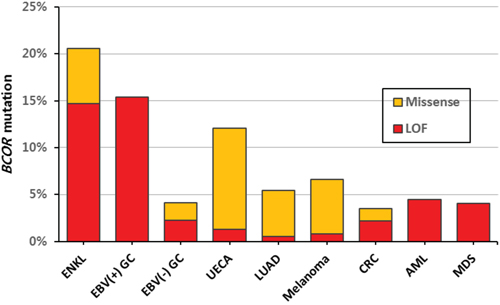
Figure 5: Mutation rates of BCOR according to tumor type. EBV-associated malignancies (ENKL and EBV(+) GC) showed high percentages for both BCOR mutation rate and LOF proportion. LOF, loss-of-function; GC, gastric carcinoma; UECA, uterine endometrial carcinoma; LUAD, lung adenocarcinoma; CRC, colorectal adenocarcinoma; AML, acute myeloid leukemia; MDS, myelodysplastic syndrome.
Until now, cell line samples have been used broadly in most types of cancer studies. For gene expression profiling, we designed a study to include both CT and CC samples, and tried to discover the common and different points between them. We found that CT and CC samples were quite different at the level of gene expression for both up and downregulated genes. The unsupervised clustering revealed even closer distance between CT and NC than that of CT and CC. As we selected study subjects which satisfied sufficient tumor cell contents, the difference could not be explained by normal cell contamination of tumor tissues. Due to the accumulated genetic alterations over division, the cancer cell lines may exhibit more prominent expression pattern far from primary tissue. Since we used the genes showing most variable expression patterns throughout samples for clustering analysis, these alterations specific for CC might affect greatly to the results. Although only some parts of DEGs were shared between the two groups, it seems meaningful that the DEGs included genes of JAK/STAT pathway or chromatin modification, supporting our main findings derived from mutational profiles.
Regarding genes that were upregulated only in CT, GO analysis showed that they were enriched in gene sets associated with angiogenesis, which is consistent with a previous study [13]. One possible explanation is that this might be a compensation for the vascular destruction caused by the angiocentric and angiodestructive growth of ENKL [39]. In addition, the pathways that are enriched among these genes include “focal adhesion” and “ECM receptor interaction, ” which include genes that mostly overlapped with those of “pathways in cancer.” As these types of pathways are associated with aggressive features of cancer [40], we suggest that the CT-specific changes might be linked to the characteristics of ENKL. These findings would have been missed if we analyzed cell line samples only, which do not include the effect of interaction between cancer and adjacent tissues, such as tumor microenvironment.
Here, we proposed several molecular candidates that can be applied as new therapeutic approaches using targeted agents. There seems the ethnic specificity of genetic backgrounds of ENKL, and more evaluations are required for these candidates in Asian populations. In addition to the validation of these candidates, it is necessary to subclassify ENKL patients according to their molecular backgrounds and check whether clinical features differ according to these groups, which will be feasible if a large sample size is used. We believe that the findings of this study will contribute substantially to the design of future studies of ENKL and of personalized approaches for cancer patients.
METHODS
NGS study subjects
In this study, we collected 34 cancer samples for sequencing, which included 9 fresh-frozen ENKL tissues (CT1–9), 4 NK-cell lymphoma cell lines (CC1–4), and 21 formalin-fixed paraffin-embedded (FFPE) ENKL tissues (TT1–21). The diagnosis of ENKL was established according to the 2008 World Health Organization classification. In all cases, the immunohistochemical study for CD3, CD56, TIA-1, and granzyme B, as well as EBER in situ hybridization was carried out using FFPE tissues. More than 70% of the infiltrated cells in the samples were positive for CD56. At least more than 70% of CD56-positive cells were positive for EBER in situ hybridization. In the CD56-negative case, the case was included for the study if EBV was positive in more than 50% of the infiltrating cells. For the frozen samples, frozen section was made for evaluation of cellularity and necrosis. As controls, 4 matched normal control samples (NB1-4, each paired with CT1-4) and NK cell samples from the peripheral blood of volunteers (NC1-3) were used [10]. For NGS, we extracted DNA from all study samples and RNA from some tissues (CT1, 2, and 5) and cell lines (CC1–4 and NC1–3). Supplementary Table 8 summarizes the information of the study subjects who were enrolled in this study. All patient samples were obtained in Samsung Medical Center, Seoul, Korea and this study was approved by the Institutional Review Board of the Samsung Medical Center, in accordance with the Declaration of Helsinki (approval number, 2013–12-076).
DNA and RNA sequencing
DNA samples from 13 cancers (CT1–9 and CC1–4) and 7 normals (NB1–4 and NC1–3) underwent WES using SureSelect Human All Exon 50M (Agilent Inc., Palo Alto, CA). For the FFPE tissue samples, we applied targeted amplicon sequencing using the HaloPlex target enrichment kit (Agilent Inc.). The target regions were designed to include coding exons of ENKL-associated genes [15], cancer-driver genes [19], JAK/STAT signaling pathway genes, and BCOR network genes, together with those of genes with ≥ 2 somatic variants in 4 tumor-normal WES pairs. The full list of target genes is available in the Supplementary Table 9. Sequencing was performed on a HiSeq 2000 machine (Illumina, San Diego, CA), and the reads that were generated were aligned to the National Center for Biotechnology Information (NCBI) human reference genome (hg19) using Bowtie2 [41]. The mutated genes in GO group, “chromatin modification” (GO:0016568) and JAK/STAT signaling pathway of KEGG from targeted sequencing were confirmed to be somatic by Sanger sequencing on paired-normal DNAs, which were extracted from uninvolved bone marrow tissues. In all cases, bone marrow biopsy was performed as a staging work up. Bone marrow involvement was analyzed by FACS analysis for aspirate and EBER in situ hybridization for trephine biopsy. Mutual exclusivities of the genes were tested by Gitools [42]. We also checked for known JAK3 mutations (p.Ala572Val, p.Ala573Val) by Sanger sequencing.
RNA was assessed for quality and was quantified using an RNA 6000 Nano LabChip on a 2100 Bioanalyzer (Agilent Inc.). The sequencing libraries were prepared as described previously and sequenced on a HiSeq 2000 machine (Illumina) [43]. The sequenced reads were aligned to the NCBI human reference genome (hg19) using the STAR 2-pass method [44, 45].
Sequence variation analysis
In WES, reads marked as PCR duplicates were removed from downstream analysis (Picard, http://broadinstitute.github.io/picard/), and GATK was used to perform indel realignment and base quality score recalibration [46]. For somatic variant calling from 4 tumor/normal pairs, we used muTect and GATK SomaticIndelDetector to call SNVs and indels, respectively [47]. In the case of unpaired DNA samples, including those from FFPE tissues, GATK UnifiedGenotyper was used to call mutation candidates. All variants called were annotated in several genomic databases using ANNOVAR [48] and further narrowed down to driver candidates, as follows: (1) nonsilent SNVs or coding indels; (2) allele frequency = 0.0 in the 1000 Genomes Project, Exome Sequencing Project, and Complete Genomics sequencing data [49, 50]; (3) not shown in an additional 919 Korean exomes including NC1–3 (unpublished); and (4) located in genes other than those reported previously as having many false positives [51].
For variant calling from RNA sequencing data, we followed the best-practice recommendations of GATK, which include indel realignment, base recalibration, and a variant-calling process using HaplotypeCaller [46]. As a validation step, called variants were compared with those obtained in the genomic sequencing experiment described above.
Fusion gene analysis
We used the deFuse tool to discover fusion transcripts in RNA-sequenced samples [52]. In addition to the default filtration, we tried to filter false-positive calls according to the following criteria: (1) every gene pair shown in NC samples was excluded; (2) adjacent gene fusions and those with gene distances < 200 kb were removed, unless they were predicted to be inversions or eversions; (3) fusions called as alternative splicing events were ignored; (4) fusions were supported by ≥ 5 spanning reads and ≥ 8 spanning mate pairs across breakpoints; (5) at least 1 gene in pairs was included in the RefSeq gene set; and (6) pairs of gene fusions were not paralogs of each other based on Ensembl version 72 [53, 54]. The fusions selected above were confirmed using the TopHat-Fusion caller with default options [55], and their genes were compared with the cancer gene census of COSMIC [56].
Gene expression profiles of ENKL
We applied the HTSeq and DESeq2 tools to our RNA-Seq reads for gene expression analysis [57, 58]. Hierarchical clustering of samples was conducted with gene expression levels using Cluster 3.0, the results of which were visualized using Java Treeview [59, 60].
DEGs were defined as those with a q-value < 0.05 and |log2(fold change)| ≥ 1, thus differentiating 1 sample group from another. For further filtration, we also called DEGs for each cancer sample in comparison with NC. The genes selected here underwent gene set enrichment analysis (GSEA) [61]. Among the Molecular Signatures Database, which is a collection of gene sets for use with GSEA, we selected the following gene databases for analysis: curated gene sets including chemical and genetic perturbations (CGP) and KEGG gene sets. For gene ontology (GO) analysis, we used the ClueGO program, which is implemented in Cytoscape [62, 63].
ACKNOWLEDGMENTS
Cell line samples used for this study were kindly provided by Dr. Masao Seto and Dr. Kennosuke Karube at Aichi Cancer Center in Nagoya.
Authorship contributions
S.J.K, W.S.K., J.-I.K., and Y.H.K designed and supervised experiments; H.Y.P., S.Y.K, S.L. and H.Y.Y. performed experiments; S.L, H.Y.P, and J.H. analyzed data; S.H.K. and K.S.P. generated normal control exomes; S.L. and H.Y.P. wrote the manuscript.
CONFLICTS OF INTEREST
The authors declare no competing financial interests.
GRANT SUPPORT
This research was supported by the Samsung grant, SM01132671 and SMO115091, and was also supported by a grant of the Korea Health Technology R&D Project through the Korea Health Industry Development Institute (KHIDI), funded by the Ministry of Health & Welfare, Republic of Korea (grant number : HI13C2148, HI14C0060, Hl14C3414, HI13C2096).
REFERENCES
1. Au WY, Weisenburger DD, Intragumtornchai T, Nakamura S, Kim WS, Sng I, Vose J, Armitage JO, Liang R. Clinical differences between nasal and extranasal natural killer/T-cell lymphoma: a study of 136 cases from the International Peripheral T-Cell Lymphoma Project. Blood. 2009; 113:3931–3937.
2. Lee J, Kim WS, Park YH, Park SH, Park KW, Kang JH, Lee SS, Lee SI, Lee SH, Kim K, Jung CW, Ahn YC, Ko YH, Park K. Nasal-type NK/T cell lymphoma: clinical features and treatment outcome. Br J Cancer. 2005; 92:1226–1230.
3. Lee J, Suh C, Park YH, Ko YH, Bang SM, Lee JH, Lee DH, Huh J, Oh SY, Kwon HC, Kim HJ, Lee SI, Kim JH, Park J, Oh SJ, Kim K, et al. Extranodal natural killer T-cell lymphoma, nasal-type: a prognostic model from a retrospective multicenter study. J Clin Oncol. 2006; 24:612–618.
4. Suzuki R, Suzumiya J, Yamaguchi M, Nakamura S, Kameoka J, Kojima H, Abe M, Kinoshita T, Yoshino T, Iwatsuki K, Kagami Y, Tsuzuki T, Kurokawa M, Ito K, Kawa K, Oshimi K. Prognostic factors for mature natural killer (NK) cell neoplasms: aggressive NK cell leukemia and extranodal NK cell lymphoma, nasal type. Ann Oncol. 2010; 21:1032–1040.
5. Yamaguchi M, Kwong YL, Kim WS, Maeda Y, Hashimoto C, Suh C, Izutsu K, Ishida F, Isobe Y, Sueoka E, Suzumiya J, Kodama T, Kimura H, Hyo R, Nakamura S, Oshimi K, et al. Phase II study of SMILE chemotherapy for newly diagnosed stage IV, relapsed, or refractory extranodal natural killer (NK)/T-cell lymphoma, nasal type: the NK-Cell Tumor Study Group study. J Clin Oncol. 2011; 29:4410–4416.
6. Jaccard A, Gachard N, Marin B, Rogez S, Audrain M, Suarez F, Tilly H, Morschhauser F, Thieblemont C, Ysebaert L, Devidas A, Petit B, de Leval L, Gaulard P, Feuillard J, Bordessoule D, et al. Efficacy of L-asparaginase with methotrexate and dexamethasone (AspaMetDex regimen) in patients with refractory or relapsing extranodal NK/T-cell lymphoma, a phase 2 study. Blood. 2011; 117:1834–1839.
7. Kanavaros P, Briere J, Emile JF, Gaulard P. Epstein-Barr virus in T and natural killer (NK) cell non-Hodgkin’s lymphomas. Leukemia. 1996; 10:s84–87.
8. Aozasa K, Takakuwa T, Hongyo T, Yang WI. Nasal NK/T-cell lymphoma: epidemiology and pathogenesis. Int J Hematol. 2008; 87:110–117.
9. Nakashima Y, Tagawa H, Suzuki R, Karnan S, Karube K, Ohshima K, Muta K, Nawata H, Morishima Y, Nakamura S, Seto M. Genome-wide array-based comparative genomic hybridization of natural killer cell lymphoma/leukemia: different genomic alteration patterns of aggressive NK-cell leukemia and extranodal Nk/T-cell lymphoma, nasal type. Genes Chromosomes Cancer. 2005; 44:247–255.
10. Karube K, Nakagawa M, Tsuzuki S, Takeuchi I, Honma K, Nakashima Y, Shimizu N, Ko YH, Morishima Y, Ohshima K, Nakamura S, Seto M. Identification of FOXO3 and PRDM1 as tumor-suppressor gene candidates in NK-cell neoplasms by genomic and functional analyses. Blood. 2011; 118:3195–3204.
11. Koo GC, Tan SY, Tang T, Poon SL, Allen GE, Tan L, Chong SC, Ong WS, Tay K, Tao M, Quek R, Loong S, Yeoh KW, Yap SP, Lee KA, Lim LC, et al. Janus kinase 3-activating mutations identified in natural killer/T-cell lymphoma. Cancer discovery. 2012; 2:591–597.
12. Bouchekioua A, Scourzic L, de Wever O, Zhang Y, Cervera P, Aline-Fardin A, Mercher T, Gaulard P, Nyga R, Jeziorowska D, Douay L, Vainchenker W, Louache F, Gespach C, Solary E, Coppo P. JAK3 deregulation by activating mutations confers invasive growth advantage in extranodal nasal-type natural killer cell lymphoma. Leukemia. 2014; 28:338–348.
13. Huang Y, de Reynies A, de Leval L, Ghazi B, Martin-Garcia N, Travert M, Bosq J, Briere J, Petit B, Thomas E, Coppo P, Marafioti T, Emile JF, Delfau-Larue MH, Schmitt C, Gaulard P. Gene expression profiling identifies emerging oncogenic pathways operating in extranodal NK/T-cell lymphoma, nasal type. Blood. 2010; 115:1226–1237.
14. Ng SB, Yan J, Huang G, Selvarajan V, Tay JL, Lin B, Bi C, Tan J, Kwong YL, Shimizu N, Aozasa K, Chng WJ. Dysregulated microRNAs affect pathways and targets of biologic relevance in nasal-type natural killer/T-cell lymphoma. Blood. 2011; 118:4919–4929.
15. Huang Y, de Leval L, Gaulard P. Molecular underpinning of extranodal NK/T-cell lymphoma. Best practice & research Clinical haematology. 2013; 26:57–74.
16. Kanehisa M, Goto S. KEGG: kyoto encyclopedia of genes and genomes. Nucleic acids research. 2000; 28:27–30.
17. Huynh KD, Fischle W, Verdin E, Bardwell VJ. BCoR, a novel corepressor involved in BCL-6 repression. Genes & development. 2000; 14:1810–1823.
18. Ashburner M, Ball CA, Blake JA, Botstein D, Butler H, Cherry JM, Davis AP, Dolinski K, Dwight SS, Eppig JT, Harris MA, Hill DP, Issel-Tarver L, Kasarskis A, Lewis S, Matese JC, et al. Gene ontology: tool for the unification of biology. The Gene Ontology Consortium. Nature genetics. 2000; 25:25–29.
19. Vogelstein B, Papadopoulos N, Velculescu VE, Zhou S, Diaz LA Jr, Kinzler KW. Cancer genome landscapes. Science. 2013; 339:1546–1558.
20. Oh ST, Simonds EF, Jones C, Hale MB, Goltsev Y, Gibbs KD Jr, Merker JD, Zehnder JL, Nolan GP, Gotlib J. Novel mutations in the inhibitory adaptor protein LNK drive JAK-STAT signaling in patients with myeloproliferative neoplasms. Blood. 2010; 116:988–992.
21. Kimura H, Karube K, Ito Y, Hirano K, Suzuki M, Iwata S, Seto M. Rare occurrence of JAK3 mutations in natural killer cell neoplasms in Japan. Leukemia & lymphoma. 2014; 55:962–963.
22. Yu H, Pardoll D, Jove R. STATs in cancer inflammation and immunity: a leading role for STAT3. Nature reviews Cancer. 2009; 9:798–809.
23. Shair KH, Bendt KM, Edwards RH, Bedford EC, Nielsen JN, Raab-Traub N. EBV latent membrane protein 1 activates Akt, NFkappaB, and Stat in B cell lymphomas. PLoS pathogens. 2007; 3:e166.
24. Muromoto R, Ikeda O, Okabe K, Togi S, Kamitani S, Fujimuro M, Harada S, Oritani K, Matsuda T. Epstein-Barr virus-derived EBNA2 regulates STAT3 activation. Biochemical and biophysical research communications. 2009; 378:439–443.
25. Sanchez-Margalet V, Martin-Romero C. Human leptin signaling in human peripheral blood mononuclear cells: activation of the JAK-STAT pathway. Cellular immunology. 2001; 211:30–36.
26. Perez-Garcia A, Ambesi-Impiombato A, Hadler M, Rigo I, LeDuc CA, Kelly K, Jalas C, Paietta E, Racevskis J, Rowe JM, Tallman MS, Paganin M, Basso G, Tong W, Chung WK, Ferrando AA. Genetic loss of SH2B3 in acute lymphoblastic leukemia. Blood. 2013; 122:2425–2432.
27. Morin RD, Mendez-Lago M, Mungall AJ, Goya R, Mungall KL, Corbett RD, Johnson NA, Severson TM, Chiu R, Field M, Jackman S, Krzywinski M, Scott DW, Trinh DL, Tamura-Wells J, Li S, et al. Frequent mutation of histone-modifying genes in non-Hodgkin lymphoma. Nature. 2011; 476:298–303.
28. Dalgliesh GL, Furge K, Greenman C, Chen L, Bignell G, Butler A, Davies H, Edkins S, Hardy C, Latimer C, Teague J, Andrews J, Barthorpe S, Beare D, Buck G, Campbell PJ, et al. Systematic sequencing of renal carcinoma reveals inactivation of histone modifying genes. Nature. 2010; 463:360–363.
29. Parsons DW, Li M, Zhang X, Jones S, Leary RJ, Lin JC, Boca SM, Carter H, Samayoa J, Bettegowda C, Gallia GL, Jallo GI, Binder ZA, Nikolsky Y, Hartigan J, Smith DR, et al. The genetic landscape of the childhood cancer medulloblastoma. Science. 2011; 331:435–439.
30. Hilton E, Johnston J, Whalen S, Okamoto N, Hatsukawa Y, Nishio J, Kohara H, Hirano Y, Mizuno S, Torii C, Kosaki K, Manouvrier S, Boute O, Perveen R, Law C, Moore A, et al. BCOR analysis in patients with OFCD and Lenz microphthalmia syndromes, mental retardation with ocular anomalies, and cardiac laterality defects. European journal of human genetics : EJHG. 2009; 17:1325–1335.
31. Damm F, Chesnais V, Nagata Y, Yoshida K, Scourzic L, Okuno Y, Itzykson R, Sanada M, Shiraishi Y, Gelsi-Boyer V, Renneville A, Miyano S, Mori H, Shih LY, Park S, Dreyfus F, et al. BCOR and BCORL1 mutations in myelodysplastic syndromes and related disorders. Blood. 2013; 122:3169–3177.
32. Grossmann V, Tiacci E, Holmes AB, Kohlmann A, Martelli MP, Kern W, Spanhol-Rosseto A, Klein HU, Dugas M, Schindela S, Trifonov V, Schnittger S, Haferlach C, Bassan R, Wells VA, Spinelli O, et al. Whole-exome sequencing identifies somatic mutations of BCOR in acute myeloid leukemia with normal karyotype. Blood. 2011; 118:6153–6163.
33. Cancer Genome Atlas Research N: Comprehensive molecular characterization of gastric adenocarcinoma. Nature. 2014; 513:202–209.
34. Cancer Genome Atlas Research N: Kandoth C, Schultz N, Cherniack AD, Akbani R, Liu Y, Shen H, Robertson AG, Pashtan I, Shen R, Benz CC, Yau C, Laird PW, Ding L, Zhang W, Mills GB, et al. Integrated genomic characterization of endometrial carcinoma. Nature. 2013; 497:67–73.
35. Imielinski M, Berger AH, Hammerman PS, Hernandez B, Pugh TJ, Hodis E, Cho J, Suh J, Capelletti M, Sivachenko A, Sougnez C, Auclair D, Lawrence MS, Stojanov P, Cibulskis K, Choi K, et al. Mapping the hallmarks of lung adenocarcinoma with massively parallel sequencing. Cell. 2012; 150:1107–1120.
36. Hodis E, Watson IR, Kryukov GV, Arold ST, Imielinski M, Theurillat JP, Nickerson E, Auclair D, Li L, Place C, Dicara D, Ramos AH, Lawrence MS, Cibulskis K, Sivachenko A, Voet D, et al. A landscape of driver mutations in melanoma. Cell. 2012; 150:251–263.
37. Cancer Genome Atlas N. Comprehensive molecular characterization of human colon and rectal cancer. Nature. 2012; 487:330–337.
38. Tempera I, Lieberman PM. Epigenetic regulation of EBV persistence and oncogenesis. Seminars in cancer biology. 2014; 26:22–29.
39. Steven H. Swerdlow EC, Nancy Lee Harris, Elaine Jaffe, S., Stefano, A Pileri, Harald Stein, Jurgen Thiele, James, W. Vardiman. WHO Classification of Tumours of Haematopoietic and Lymphoid Tissues. 2008; International Agency for Reasearch on Cancer: WHO PRESS.
40. Shan Z, Li G, Zhan Q, Li D. Gadd45a inhibits cell migration and invasion by altering the global RNA expression. Cancer biology & therapy. 2012; 13:1112–1122.
41. Langmead B, Salzberg SL. Fast gapped-read alignment with Bowtie 2. Nature methods. 2012; 9:357–359.
42. Perez-Llamas C, Lopez-Bigas N. Gitools: analysis and visualisation of genomic data using interactive heat-maps. PloS one. 2011; 6:e19541.
43. Ju YS, Lee WC, Shin JY, Lee S, Bleazard T, Won JK, Kim YT, Kim JI, Kang JH, Seo JS. A transforming KIF5B and RET gene fusion in lung adenocarcinoma revealed from whole-genome and transcriptome sequencing. Genome Res. 2012; 22:436–445.
44. Engstrom PG, Steijger T, Sipos B, Grant GR, Kahles A, Consortium R, Ratsch G, Goldman N, Hubbard TJ, Harrow J, Guigo R, Bertone P. Systematic evaluation of spliced alignment programs for RNA-seq data. Nature methods. 2013; 10:1185–1191.
45. Dobin A, Davis CA, Schlesinger F, Drenkow J, Zaleski C, Jha S, Batut P, Chaisson M, Gingeras TR. STAR: ultrafast universal RNA-seq aligner. Bioinformatics. 2013; 29:15–21.
46. McKenna A, Hanna M, Banks E, Sivachenko A, Cibulskis K, Kernytsky A, Garimella K, Altshuler D, Gabriel S, Daly M, DePristo MA. The Genome Analysis Toolkit: a MapReduce framework for analyzing next-generation DNA sequencing data. Genome research. 2010; 20:1297–1303.
47. Cibulskis K, Lawrence MS, Carter SL, Sivachenko A, Jaffe D, Sougnez C, Gabriel S, Meyerson M, Lander ES, Getz G. Sensitive detection of somatic point mutations in impure and heterogeneous cancer samples. Nature biotechnology. 2013; 31:213–219.
48. Wang K, Li M, Hakonarson H. ANNOVAR: functional annotation of genetic variants from high-throughput sequencing data. Nucleic acids research. 2010; 38:e164.
49. Abecasis GR, Auton A, Brooks LD, DePristo MA, Durbin RM, Handsaker RE, Kang HM, Marth GT, McVean GA. An integrated map of genetic variation from 1, 092 human genomes. Nature. 2012; 491:56–65.
50. Drmanac R, Sparks AB, Callow MJ, Halpern AL, Burns NL, Kermani BG, Carnevali P, Nazarenko I, Nilsen GB, Yeung G, Dahl F, Fernandez A, Staker B, Pant KP, Baccash J, Borcherding AP, et al. Human genome sequencing using unchained base reads on self-assembling DNA nanoarrays. Science. 2010; 327:78–81.
51. Lawrence MS, Stojanov P, Polak P, Kryukov GV, Cibulskis K, Sivachenko A, Carter SL, Stewart C, Mermel CH, Roberts SA, Kiezun A, Hammerman PS, McKenna A, Drier Y, Zou L, Ramos AH, et al. Mutational heterogeneity in cancer and the search for new cancer-associated genes. Nature. 2013; 499:214–218.
52. McPherson A, Hormozdiari F, Zayed A, Giuliany R, Ha G, Sun MG, Griffith M, Heravi Moussavi A, Senz J, Melnyk N, Pacheco M, Marra MA, Hirst M, Nielsen TO, Sahinalp SC, Huntsman D, et al. deFuse: an algorithm for gene fusion discovery in tumor RNA-Seq data. PLoS Comput Biol. 2011; 7:e1001138.
53. Steidl C, Shah SP, Woolcock BW, Rui L, Kawahara M, Farinha P, Johnson NA, Zhao Y, Telenius A, Neriah SB, McPherson A, Meissner B, Okoye UC, Diepstra A, van den Berg A, Sun M, et al. MHC class II transactivator CIITA is a recurrent gene fusion partner in lymphoid cancers. Nature. 2011; 471:377–381.
54. Kangaspeska S, Hultsch S, Edgren H, Nicorici D, Murumagi A, Kallioniemi O. Reanalysis of RNA-sequencing data reveals several additional fusion genes with multiple isoforms. PLoS One. 2012; 7:e48745.
55. Kim D, Salzberg SL. TopHat-Fusion: an algorithm for discovery of novel fusion transcripts. Genome Biol. 2011; 12:R72.
56. Forbes SA, Bindal N, Bamford S, Cole C, Kok CY, Beare D, Jia M, Shepherd R, Leung K, Menzies A, Teague JW, Campbell PJ, Stratton MR, Futreal PA. COSMIC: mining complete cancer genomes in the Catalogue of Somatic Mutations in Cancer. Nucleic acids research. 2011; 39:D945–950.
57. Anders S, Pyl PT, Huber W. HTSeq — A Python framework to work with high-throughput sequencing data. bioRxiv. 2014.
58. Love MI, Huber W, Anders S. Moderated estimation of fold change and dispersion for RNA-Seq data with DESeq2. bioRxiv. 2014.
59. de Hoon MJ, Imoto S, Nolan J, Miyano S. Open source clustering software. Bioinformatics. 2004; 20:1453–1454.
60. Saldanha AJ. Java Treeview—extensible visualization of microarray data. Bioinformatics. 2004; 20:3246–3248.
61. Subramanian A, Tamayo P, Mootha VK, Mukherjee S, Ebert BL, Gillette MA, Paulovich A, Pomeroy SL, Golub TR, Lander ES, Mesirov JP. Gene set enrichment analysis: a knowledge-based approach for interpreting genome-wide expression profiles. Proc Natl Acad Sci U S A. 2005; 102:15545–15550.
62. Bindea G, Mlecnik B, Hackl H, Charoentong P, Tosolini M, Kirilovsky A, Fridman WH, Pages F, Trajanoski Z, Galon J. ClueGO: a Cytoscape plug-in to decipher functionally grouped gene ontology and pathway annotation networks. Bioinformatics. 2009; 25:1091–1093.
63. Saito R, Smoot ME, Ono K, Ruscheinski J, Wang PL, Lotia S, Pico AR, Bader GD, Ideker T. A travel guide to Cytoscape plugins. Nature methods. 2012; 9:1069–1076.