
INTRODUCTION
Hepatocellular carcinoma (HCC) is one of the most common types of cancers (with the highest prevalence in the Asia-Pacific region) and the third leading cause of cancer death worldwide. [1] Because this disease is mostly diagnosed at an advance stage, potentially curative therapies are effective in less than 30–40% of HCC patients. [2, 3] While systemic therapies are indicated for advanced HCC, no effective systemic therapy for patients with advanced HCC existed until the development of sorafenib therapy. Sorafenib is a multikinase inhibitor that targets HCC angiogenesis, and it has been shown to impart survival benefits (2.8 and 2.3 months, respectively) on patients in Western and Eastern phase III randomized controlled trials. [4, 5] These trials have established sorafenib as a first-line treatment option for patients with advanced HCC, who have sufficiently preserved liver function. [2, 6]
Sorafenib is known to inhibit receptor tyrosine kinases in cell membranes (e.g., vascular endothelial growth factor receptors and platelet-derived growth factor receptor-beta) and downstream intracellular serine/threonine kinases (e.g., Raf-1, wild-type B-Raf, and mutant B-Raf). These kinases are involved in tumor cell proliferation and tumor angiogenesis. In a previous study, sorafenib treatment resulted in dose-dependent inhibition of cell proliferation and induction of apoptosis in human HCC cells lines in vitro [7]; however, the precise underlying responsible mechanisms remain largely unknown.
Two phase III clinical trials have shown that about 50–60 percent of the study subjects are non-responders to sorafenib treatment, and reliable biomarkers are needed for predicting treatment responses prior to therapy initiation. [8, 9] In practice, identification of good responders to sorafenib treatment may be critical for personalized therapy for management of advanced HCC. Unfortunately, no such reliable biomarkers or clinical factors currently have been identified to date. In addition, understanding the reasons for such differential responses is essential as is identifying stratification factors such as tumor molecular profiles and individual genetic differences in drug metabolism.
To distinguish good responders to sorafenib treatment from the poor responders, it is necessary to identify genes or markers related to the sorafenib response. However, conventional technologies such as massive PCR amplification and Sanger sequencing are time consuming and expensive; therefore, a single laboratory cannot undertake such a study independently. Recently developed molecular genetics technologies such as next-generation sequencing (NGS) are innovative research tools for detecting genomic variations and are practical methods for detecting mutations with high accuracy. [10] In particular, whole-genome sequencing by NGS can be used to detect all genomic variations in exons, introns, and regulatory regions such as promoters and enhancers, [11, 12] allowing a systemic approach to biomarker identification. Consequently, challenges to identify genomic variations associated with drug response is emerged by analyzing the genome of exceptional responder by NGS. [13] As an effort to this, The National Cancer Institute (NCI) is funding for researches which are focused to “super responder” with hope to further identify patients of good responder using knowledge generated from super responder.
In this study, we present the results of a whole-genome sequencing analysis to identify sorafenib-response markers and genes using the peripheral blood of HCC patients treated with sorafenib. From the patients who were treated with sorafenib, we selected two extraordinary responders who showed time-to-progression (TTP) more than 38 months and two good responders. With further three poor responder who showed less than 5 month TTP, whole genome analysis was performed followed by bioinformatics analysis to compare their genomic variations. We identified genome-wide germline variations associated with the response to sorafenib treatment, especially in sorafenib-candidate targets and in absorption, distribution, metabolism, excretion (ADME) genes. Furthermore, we discovered that non-synonymous single-nucleotide variations (ns SNVs) in solute carrier family 15 (H+/peptide transporter) member 2 (SLC15A2) were functionally relevant to sorafenib metabolism by in silico and in vitro functional study. This finding was validated by genotyping of another 174 patients with HCC which revealed statistically significant progression-free survival (PFS) rate depending on genotype. This is the first report of precise identification of SNVs as associated with the extraordinary response to sorafenib treatment, and our results may prove useful for classifying patients with advanced HCC on the basis of outcomes from sorafenib treatment.
RESULTS
Patients demographics
Table 1a shows the baseline demographics and clinical characteristics of the seven enrolled patients which were analyzed by whole-genome sequencing. Five (71.4%) patients were male and HBsAg-positive. Their median age was 60 years, and all were Child-Pugh class A. The seven patients were at Barcelona Clinic of Liver Cancer (BCLC) stages B (n = 4) and C (n = 3). The median of maximum tumor size was 45 mm, and two patients exhibited macrovascular invasion. According to time-to-progression (TTP) with sorafenib treatment, patients were arbitrarily classified into as being good responders (n = 4, Nr. 1, 2, 3 and 4 in Table 1a) harboring two extraordinary responders (Nr. 1 and 2) and poor responders (n = 3; Nr.5, 6 and 7 in Table 1a). A validation cohort (Table 1b) comprised 174 patients, with a median age of 56 years (interquartile range [IQR], 49–63) and 84.5% were male. According to BCLC staging system, the number of patients with stage A, B, and C HCC were 2 (1.2%), 35 (20.1%), and 137 (78.7%), respectively. Twenty patients (11.5%) were administered sorafenib as an initial treatment. The median overall survival (OS) and PFS of the validation cohort was 11.0 months (95% CI, 8.9–12.7) and 4.4 months (95% CI, 3.7–5.0), respectively.
Table 1a: Baseline demographic and clinical characteristics of enrolled patients (n = 7)
Patient number |
1 |
2 |
3 |
4 |
5 |
6 |
7 |
Sex |
Female |
Male |
Male |
Male |
Female |
Male |
Male |
Age |
54 |
45 |
47 |
60 |
61 |
66 |
68 |
Etiology |
HBV |
HBV |
HBV |
HBV |
HBV |
HCV |
HCV |
mUICC stage |
IVa |
II |
III |
IVa |
II |
IVa |
III |
BCLC stage |
C |
B |
B |
C |
B |
C |
B |
Tumor morphology |
Infiltrative |
Multinodular |
Multinodular |
Multinodular |
Multinodular |
Multinodular |
Multinodular |
Macrovascular invasion |
Yes |
No |
No |
Yes |
No |
No |
No |
Maximum size of tumor (mm) |
60 |
45 |
72 |
13 |
15 |
83 |
20 |
Child-Pugh class |
A |
A |
A |
A |
A |
A |
A |
Serum AFP (ng/mL) |
3505.9 |
3104.7 |
9.6 |
14 |
730.6 |
123016 |
23.9 |
TTP (mo) |
55.5 |
38.1 |
9.3 |
8.1 |
4.7 |
3.5 |
4.3 |
Follow-up (mo) |
62.2 |
55.4 |
60.5 |
33.1 |
4.9 |
14.5 |
15.5 |
Sorafenib response |
good |
good |
good |
good |
poor |
poor |
poor |
mUICC, Modified International Union against Cancer; BCLC, the Barcelona Clinic of Liver Cancer; TTP, time to progression; HBV, hepatitis B virus; HCV, hepatitis C virus
Table 1b: Baseline characteristics of the validation cohort (n = 174)
Patient Characteristics (n, [IQR]) |
Tumor Characteristics |
||
Age (years) |
56 [49–63] |
Size of the largest nodule in the liver |
|
Male |
147 (84.5%) |
None |
14 (8.1%) |
Etiology |
≤ 2 cm |
22 (12.6%) |
|
HBV |
135 (77.6%) |
2–5 cm |
47 (27.0%) |
HCV |
13 (7.5%) |
>5 cm |
91 (52.3%) |
HBV + HCV |
2 (1.2%) |
||
Alcoholic |
13 (7.5%) |
||
NBNCNA |
11 (6.3%) |
||
BCLC |
|||
Cirrhosis |
140 (80.5%) |
Stage A/B/C |
1.2%/20.1%/78.7% |
Bilirubin (mg/dL) |
1.1 [0.7–1.6] |
||
Prothrombin time (INR) |
1.05 [0.9–1.15] |
Massive/infiltrative type |
87 (50.0%) |
Creatinine (mg/dL) |
1.1 [1.0–1.2] |
Vascular invasion |
95 (54.6%) |
Albumin (g/dL) |
3.9 [3.5–4.2] |
Portal vein invasion |
85 (48.9%) |
AST (IU/L) |
63.5 [43–106] |
Hepatic vein invasion |
25 (14.4%) |
ALT (IU/L) |
37 [26–72] |
Extrahepatic metastasis |
84 (48.3%) |
Child-Pugh class (A/B) |
82.8%/17.2% |
AFP (ng/mL) |
181.5 [16.3–2544.5] |
MELD* |
8.8 [7.7–10.6] |
≥ 200 |
85 (48.9%) |
Number (proportion) or median [interquartile range] are shown.
HBV, hepatitis B virus; HCV, hepatitis C virus; NBNCNA, non-B/non-C/non-alcoholic; INR, internationalized normalized ratio; MELD, Model for End-Stage Liver Disease; AFP, alpha-fetoprotein; UICC, International Union Against Cancer; BCLC, Barcelona Clinic Liver Cancer
*The MELD score was calculated according to the original formula without rounding or lower and upper bounds in the variables and the final score.
Whole-genome analysis of patients genome by NGS
On average, >96 gigabase sequences per sample were generated with a ~32X mapping depth minimum and at a mapping rate of over 95% to the reference genome (NCBI build 37, HG19; Supplementary Table 1). This baseline value of whole-genome sequencing indicates that we obtained sufficient qualified sequencing reads to cover the entire genome. Using the final mapped bases, we constructed a genomic profile database for detecting SNVs, copy number variations, and structural variations. For each sample, we identified approximately 0.6 – 0.8 million small indels and approximately 3.9 – 4.1 million SNVs. The majority of these SNVs was located in the intron, but a large proportion of SNVs was found in coding regions and splicing sites—including missense, nonsense, or frameshift mutations—which may cause functional changes of affected genes (Supplementary Table 2). The number of functional SNVs was approximately the same for all samples without any significant difference between good and poor responder. All data generated by whole genome sequencing was deposited in public database (NCBI SRA, Accession Nr. SRS 428124). Chip data generated by the genome-wide Axiom array were used for quality control of the identified SNVs (>99% concordance rate for each samples; Supplementary Table 3).
Identification of sorafenib response-associated variations
Genetic pattern analysis was used to identify genetic variations associated with drug responsiveness in the genomes of patients. Seven patients were assigned into two groups according to their sorafenib-responsiveness (good or poor responders). Alleles different from the human reference genome were coded as “A,” whereas alleles found the same as the reference genome were coded as “B.” This classification conferred four different genetic patterns in the response to sorafenib treatment, as shown in Supplementary Table 4. Subclasses 1 and 4 were dominant models in which “A” or “B” alleles dominantly contributed to the good sorafenib response, whereas subclasses 2 and 3 were recessive models whereby “A” or “B” homozygous alleles contributed to the good response to sorafenib treatment. We uncovered 1813 SNVs that were perfectly matched to one of these subclasses and identified as being 100% associated (Supplementary Table 5), 708 of which were located in the sorafenib target candidate genes or sorafenib ADME candidate genes (Supplementary Tables 6 and 7). Among the 708 SNVs, 36 variations were SNVs located in genomic regions, 15 of which were located in the coding regions of nine genes (Table 2), all confirmed as being true-positive variants by Sanger sequencing. Thirteen of these 15 coding SNVs were confirmed to be located in the drug responsiveness-related genes, whereas two of them were candidates as sorafenib target gene. Six coding SNVs were non-synonymous, which cause amino-acid change and possibly damage the functions of their encoded proteins, and located in four genes: MUSK was a sorafenib target gene candidate; ABCB1, FMO3, and SLC15A2 were ADME genes (Fig. 1).
Pathway analysis
To further investigate sorafenib-associated variations at the pathway level, all variations were analyzed by gene positioning in the functionally annotated KEGG database. The genes that harbored 1813 genomic variations were mapped in the KEGG pathways; significantly affected pathways (P < 0.001) are displayed in Supplementary Table 8. Interestingly, the outcome of the pathway analysis was in accordance with that of the marker analysis, and the drug metabolism pathway (including its components such as FMO3 and ALDH3B1) were found to be the most significantly affected. This suggests that these genetic differences in the patients with HCC are involved in mechanisms implicated in different responses to sorafenib treatment.
Validation of sorafenib-associated SNVs in SLC15A2 and functional analysis
Since SLC15A2 belongs to the solute carrier family that supposedly participates in drug transport, we wanted to validate the genomic variations in SLC15A2. From five coding variants in SLC15A2 identified by NGS analysis, we selected three non-synonymous SNVs (L350F, P409S, R509K), which may cause functional alteration in the gene product, and analyzed the genotypes for an additional 174 HCC patients (Table 1b). We obtained individual genotypes of these three SNPs, which displayed complete linkage disequilibrium (Supplementary Table 9). Because of missing clinical data, we could only analyze PFS but not TTP. However, upon analyzing the association between genotypes and the PFS of these patients, we observed that cohorts of patients with C/C genotype for rs2257212 (correspond to L350F) showed shorter progression-free survival time compared to the group of patients with C/T or T/T genotype (HR, 2.18; 95% CI, 1.15–4.15; P = 0.018) as it was indicated by NGS analysis. The Kaplan-Meier plot displayed significant genotype-dependent difference for PFS of 174 patients (Fig. 2) which may be caused by different drug responsiveness for sorafenib. Additional analysis by pair-wise addition of SNPs in coding variants to Cox proportional hazard model with SLC15A2 did not significantly improve model predictability (data not shown).
Table 2: Coding variants in candidate genes
Gene |
Chromosomea |
Positionb |
Refc |
Variantd |
Ref amino acide |
Variant amino acidf |
ABCB1 |
chr7 |
87160618 |
A |
C |
S |
A |
ALDH3B1 |
chr11 |
67795299 |
G |
A |
P |
P |
ALDH3B1 |
chr11 |
67795353 |
G |
A |
L |
L |
CYP21A2 |
chr6 |
32006317 |
C |
T |
L |
L |
DDR1 |
chr6 |
30865204 |
A |
C |
P |
P |
FMO3 |
chr1 |
171076966 |
G |
A |
E |
K |
MUSK |
chr9 |
113538122 |
G |
A |
M |
I |
SLC15A2 |
chr3 |
121646641 |
A |
G |
A |
A |
SLC15A2 |
chr3 |
121643804 |
C |
T |
L |
F |
SLC15A2 |
chr3 |
121641693 |
G |
A |
A |
A |
SLC15A2 |
chr3 |
121647286 |
C |
T |
P |
S |
SLC15A2 |
chr3 |
121648168 |
G |
A |
R |
K |
SLC22A15 |
chr1 |
116534852 |
C |
T |
S |
S |
SLC7A7 |
chr14 |
23282449 |
C |
T |
S |
S |
SLC7A7 |
chr14 |
23282110 |
A |
G |
I |
I |
aChromosome on which the variation was located
bNucleotide position of the variant allele in the human reference genome sequence version 19/build 37
cNucleotide at the same position in human reference genome sequence version 19/build 37
dNucleotide at the variation site
eAmino acid encoded by the corresponding codon in the reference sequence
fAmino acid encoded by the corresponding codon in the variant sequence
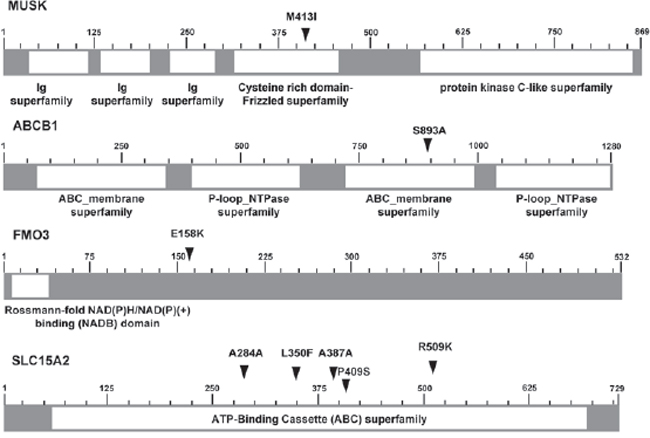
Figure 1: Schematics of six non-synonymous SNVs located in 4 genes. Schematics of six non-synonymous SNVs located in four genes (MUSK, ABCB1, FMO3, and SLC15A2), illustrated with functional domains (arrows indicate the locations of variants; numbers indicate the position of amino acids.)
Further, we analyzed the functional effect of a non-synonymous variant in SLC15A2. For in vitro functional analysis, we first identified the variant genotypes of rs2257212(L350F) in several human HCC cell lines and found that Hep3B, PLC/PRF5, and SNU182 possessed the C/C, C/T and T/T genotypes, respectively (Fig. 3A). Consistent with the results of whole-genome analysis and validation study, the T variant of rs2257212 in SLC15A2 showed a better response to sorafenib than the C variant. Although the proliferation of cell lines was inhibited by sorafenib treatment in a dose-dependent manner, SNU182 cells that harbored the T/T genotype displayed a better response to sorafenib than the Hep3B cells that harbored the C/C genotype (Fig. 3B). Additional western blot analysis showed similar SLC15A2 expression levels in all three cell lines (Fig. 3C), suggesting that structural, rather than expressional, changes were the cause of the function aberration.
DISCUSSION
Cancer biomarkers predicting outcomes of drug treatment may be used to assess the probability that a patient will benefit from a particular regimen of cancer treatment. [14] Previous biomarker response studies have evaluated the correlation between plasma angiogenesis biomarkers, alpha-fetoprotein (AFP) level or vascular permeability-perfusion of dynamic magnetic resonance imaging, and responses to sorafenib in patients with advanced HCC. [15–17] However, finding reliable biomarkers is not an easy task and none of biomarkers are clinically applicable to date. Recent approaches focusing comprehensive genome analysis of extraordinary response patients give rise to hope to identify genomic alterations associate with drug response. Especially, two studies identified genomics alterations related to drug responses by analyzing “outlier” responder in lung cancer patients. [18, 19] Here, we analyzed four good responder of sorafenib and one of them is extreme outlier with more than 55 months TTP although disease stage at the beginning of treatment was IVa by mUICC stage. One other patient also showed extraordinary response to treatment with more than 38 months TTP. Our study represents the first effort to identify sorafenib-response variations and related genes through whole-genome analysis of HCC patients.
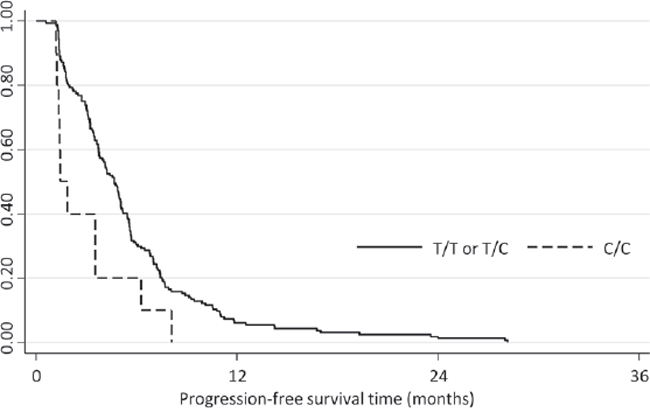
Figure 2: Kaplan-Meier plot depicting the progression-free survival of the validation cohort according to the SLC15A2 genotype. Progression-free survival was significantly longer for patients with C/C genotype compared with those with C/T or T/T genotypes (HR: 2.18; 95% CI, 1.15–4.15; P = 0.018).
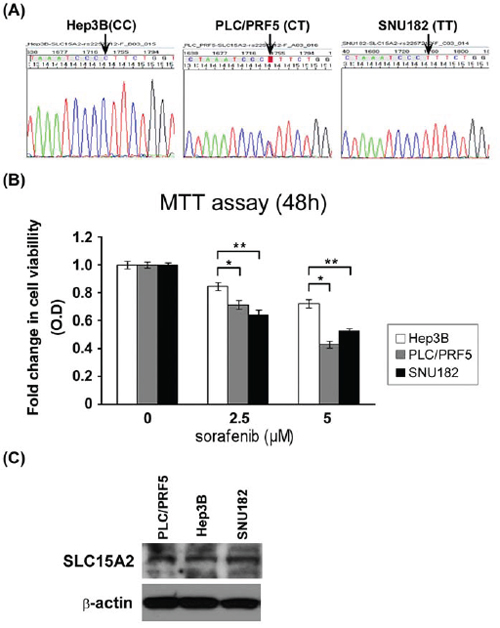
Figure 3: Functional analysis of SLC15A2 variant in liver cancer cell lines. Three liver cancer cell lines were selected after their genotypes were validated by Sanger sequencing A. MTT assay after sorafenib treatment revealed that cell viability of the Hep3B cell line harboring the C/C genotype was considerably less affected than that of the SNU182 cell line harboring T/T genotype B. Western blot analysis showed similar expression SLC15A2 levels for all cell lines, irrespective of the genotype, which may indicate structural changes in the protein and which may be responsible for the differential drug response C. (** indicate P < 0.05, *** indicate P < 0.01)
This study was conducted in a phase II clinical trial setting (named COTSUN), whereby the safety and efficacy of concurrent TACE and sorafenib in patients with HCC was evaluated. [20] TACE used as a locoregional therapy may not directly affect the sorafenib response and, in the present study, clinical characteristics were well collected and balanced between the good and poor responder cohorts; hence, we used blood samples from prospectively collected specimens from the COTSUN trial. Using blood samples from such a study is more convenient than using tumor specimens in terms of availability of biomarkers.
A total of 1813 genomic variations with 100% association for sorafenib responsiveness was discovered in this study. Among these, six non-synonymous SNVs were located in one sorafenib target gene (MUSK) and three ADME genes (ABCB1, FMO3, and SLC15A2), which could be considered as the member of main causes for sorafenib drug responsiveness, possibly by influencing protein function. To the best of our knowledge, this is the first to report suggesting that MUSK, ABCB1, FMO3, and SLC15A2 could be indicative for the response to sorafenib in patients with HCC. Among the four candidate genes that we identified in this study, ABCB1 is a member of the superfamily of ATP-binding cassette (ABC) transporters. Interestingly, for Asian nasopharyngeal carcinoma patients, polymorphisms in the ABCG2 and ABCB1 genes could be predictive markers of drug (irinotecan) activity. [21] The FMO3 gene is a type of flavin-containing monooxygenase, which is a member of an important class of drug-metabolizing enzymes. [22–24] Unfortunetly, the results from our validation set of patients and in vitro study did not confirm a meaningful association between these genes (ABCB1, FMO3) and the response to sorafenib (data not shown). These may be caused by marginal number of patients or multiple variations could be associated simultaneously which should be further analyzed.
The most interesting result of this study was the identification of non-synonymous single nucleotide variations in SLC15A2 as an important predictor of the response to sorafenib treatment in patients with HCC. SLC15A2 belongs to the family of proton-coupled peptide transporters that is responsible for the absorption of small peptides, as well as beta-lactam antibiotics and other drugs. [25] In our whole-genome analysis, the variations in this gene were found to be associated with sorafenib responsiveness and this result was validated in the practice-based cohort of 174 patients who were treated with sorafenib (Fig. 2; Table 1b). Patients with the T/T or C/T genotype displayed a significantly longer PFS than did patients with C/C genotypes (P = 0.003) maybe caused by better response to sorafenib. In the in vitro study, the suppression of HCC cell proliferation by sorafenib displayed greater dominance in SNU182 (an HCC cell line that was T/T homozygous for SLC15A2) compared to that in Hep3B (an HCC cell line that was C/C homozygous for SLC15A2). Taken together, our findings indicate that the functional impact of coding variants in SLC15A2 may affect sorafenib metabolism and responsiveness.
When we consider the results of in vitro assays in which similar SLC15A2 expression levels were observed in cell lines with different genotypes, the functional mechanism of the SLC15A2 variants should be related not to the change of expression level but to the structural changes caused by these variants. Although in silico analysis for three-dimensional structure prediction did not display substantial differences between both genotypes (data not shown), computational analysis (pubmed id: 15980458, kinasephos.mbc.nctu.edu.tw) of post-translational modifications revealed that protein generated from genes with variant genotypes (identified in good responders) may have more potential phosphorylation sites than wild type (identified in poor responders), as shown in Supplementary Table 10. The increased number of phosphorylation sites of SLC15A2 may delay the dephosphorylation of the protein, contributing to the longer activation required for SLC15A2, such that it could participate more in the mechanism of the sorafenib reaction. Together, patients with variant types of SLC15A2 may possess advantages in the effectiveness and responsive to sorafenib treatment because of the increased stability of the SLC15A2 protein which should be involved in the transport of this drug.
The analysis of gene-to-gene connection using the Liver hepatocellular carcinoma data in c-BioPortal (http://www.cbioportal.org/public-portal/) showed the association of SLC15A2 with cystic fibrosis transmembrane conductance regulator (CFTR) via PDZ domain containing 1 or 3 (PDZK1 or PDZD3; Supplementary Fig. 1). CFTR, a well-established member of the ATP-binding cassette (ABC) transporter superfamily, transport various molecules across extracellular and intracellular membranes. Polymorphisms of CFTR are known to be associated with benefit for clinical evaluation. [26, 27] Also, molecular alteration of PDZK1 may be associated with metabolic syndrome and drug-resistance phenotype in multiple myeloma. [28, 29] Additionally, many members of solute carrier family were revealed, especially the organic cation transporter OCT/OCT novel (OCTN) family. SLC22A4 (OCTN1) and SLC22A5 (OCTN2) were linked with SLC15A2 via PDZK1 and/or PDZD3. Interestingly, recent study reported that the polymorphisms of these genes are associated with prolonged TTP in unresectable gastrointestinal stromal tumors treated with imatinib therapy. [30] Taken together, the results of this network analysis provide additional evidence for the functional relevance of SLC15A2 in the response to sorafenib treatment.
SLC15A2 may transport many clinical and experimental therapeutic compounds, including beta-lactams, angiotensin-converting enzyme inhibitors, 5-aminolevulinic acid, bestatin, and pro-drugs such as Val-acyclovir and Val-ganciclovir. [31, 32] Previous reports have shown that different haplotypes of these variants exhibited markedly different Km values for glycyl-sarcosine (Gly-Sar). [33] Moreover, these variants revealed ethnic disparities for which Caucasian (0.371–0.500) and European (0.465–0.492) possessed lower frequencies of the T allele in than the Asian population did (0.744–0.800) [http://www.ncbi.nlm.nih.gov/projects/SNP/]. These disparate frequencies may provide one possible explanation for the differential responses to sorafenib treatment vis à vis ethnicity. Although validation with the independent cohort of this study displayed a predictive significance to SLC15A2 genetic variation, further prospective clinical studies are needed to confirm the predictive and/or prognostic values of SLC15A2 genetic variation in responses to sorafenib treatment.
In conclusion, we discovered genomic variants and their genes that should be associated with sorafenib responses for patients with HCC which could be used as biomarkers for predicting the effectiveness of drug responses. This is also the first report showing a significant influence of the SLC15A2 genotype on the response to sorafenib in patients with HCC; our results suggest that SLC15A2 is a novel gene involved in sorafenib metabolism. Although further prospective validation and functional studies are needed, our results provide the initial clues for classifying patients with HCC by predicting the outcome of sorafenib treatment and for tailoring individualized therapy for these patients.
MATERIALS AND METHODS
Patients and specimen collection
The whole genome of seven patients was used for NGS analysis. Six patients were selected from a cohort of 50 patients with HCC, who were enrolled in a phase II study of concurrent transarterial chemoembolization (TACE) and sorafenib treatment. [20] Another patient was selected from a patient cohort displaying a long-term (>48 weeks) response to sorafenib treatment. [34] HCC was diagnosed by histological examination or on the basis of clinicoradiologic criteria based on the guidelines of the Korean Liver Cancer Study Group and the National Cancer Center (NCC), Republic of Korea. [35] A validation cohort was derived from 408 patients with HCC who had been treated with sorafenib for greater than a 6-week period between June 2007 and March 2012 at the NCC. [36] Fifty-seven patients who were lost to follow up or who discontinued sorafenib treatment due to non-medical issues were excluded. Out of the 351 patients, blood samples were obtained from 174 patients and were subsequently used for genotyping (Supplementary Fig. 2). This study was conducted in accordance with the Declaration of Helsinki and International Conference on Harmonization-Good Clinical Practice. The study protocol was approved by the Institutional Review Board at the National Cancer Center (Goyang, Republic of Korea). All patients provided us with their written informed consent to undertake the study.
Nucleic acid preparation and whole-genome sequencing
Genomic DNA was extracted from patient leukocytes by a MagAttract DNA Blood Midi Kit (Qiagen, Inc. Valencia, CA, USA) according to the manufacturer’s protocol. The DNA quality was assessed using a Nanodrop spectrometer (Nanodrop Technologies, Wilmington, DE, USA). An absorbance 260/280 value greater than 1.7 was accepted for further analysis. Five micrograms of genomic DNA was sheared using a Covaris S series ultrasonicator (Covaris, Woburn, MA, USA). The fragments of sheared DNA were then end-repaired, A-tailed, ligated to pair-end adapters (Pair End Library Preparation Kit, Illumina, CA, USA), and amplified by PCR according to the manufacturer’s protocol. The quality of the library and DNA concentration were determined using an Agilent 2100 BioAnalyzer (Agilent, Santa Clara, CA, USA) and quantified using a SYBR green qPCR protocol on a LightCycler 480 (Roche, Indianapolis, IN, USA) according to Illumina’s library quantification protocol. Paired-end sequencing (2 × 100 bp) was performed on an Illumina HiSeq 2000 by using HiSeq Sequencing kits
Read alignment and variation detection
Next, 90-bp paired-end sequence reads with ~300-bp inserts were aligned to the hg19 human reference genome (NCBI build 37) by using a BWA algorithm1 ver. 0.5.9. Two mismatches were permitted in the 45-bp seed sequence. SAMtools were used to remove PCR duplicates of the sequence reads, which may have been generated during the library construction process. The aligned reads were realigned at putative insertion/deletion (indel) positions by using the GATK IndelRealigner algorithm to enhance mapping quality. [37] Base quality scores were recalibrated using the GATK TableRecalibration algorithm.
SNP and small indel analysis
Putative SNVs were called and filtered using the UnifiedGenotyper and VariantFiltration commands in GATK. The options used for SNP calling were a minimum of 5 to a maximum of 200 reads in terms of mapping depth with a consensus quality of 20, and the prior likelihood for heterozygosity value of 0.001. To obtain small indels, the dINDEL mode of the GATK UnifiedGenotyper was used.
Validation of SNVs by using genome-wide SNP chips and Sanger sequencing
SNP genotyping to confirm the NGS data was performed using an Axiom genotyping solution with an Axiom Genome-Wide ASI 1 Array Plate (Affymetrix, Santa Clara, CA, USA) and a reagent kit according to the manufacturer’s protocol. Total genomic DNA (200 ng) was used and the resulting data in the form of a DAT file was automatically saved as a CEL file. The CEL intensity file was normalized, and genotype calling was performed using Genotyping Console 4.1 (Affymetrix) with Axiom GT1 algorithms according to the manufacturer’s instructions. The cutoff value for data quality control was a DISHQC ≥ 0.82 for hybridization and a QC call rate ≥ 97%.
Twenty-six SNVs, including 15 coding variations, were validated by conventional Sanger sequencing using dye-terminator chemistry. The sequences were analyzed using an automatic sequencer ABI 3730 (Applied Biosystems, Carlsbad, CA, USA). The target regions were amplified by PCR followed by direct sequencing or were cloned into TA vectors. Details of the PCR and sequencing primers are provided in Supplementary Table 11.
Annotation and in silico analysis of variations
Each SNV was mapped onto the UCSC gene table according to its genomic features such as coding region, untranslated region (UTR), and introns. Non-synonymous SNV information was extracted by comparing UCSC (http://genome.ucsc.edu/) reference gene information. Pathway analysis was performed for the genes annotated to harbor significant mutations by using the Kyoto Encyclopedia of Genes and Genomes (KEGG; 32, http://www.genome.jp/kegg/) and Biocarta (http://www.biocarta.com/). For structural analyses of variations in SLC15A2, RefSeq NM_001145998 was used. Three-dimensional structures were generated using Phyre 2.0 (http://www.sbg.bio.ic.ac.uk/phyre2/html/page.cgi?id=index). Post-translational modification was analyzed using KinasePhos (kinasephos.mbc.nctu.edu.tw). Integrative analysis for SLC15A2 with publicly available data and pathways was performed by the cBioPortal website (www.cbioportal.org).
Validation of candidate SNPs and Statistical analyses
To validate the candidate SNPs, 174 patients with HCC who had been treated with sorafenib were genotyped using the MassARRAY system (Sequenom, San Diego, CA, USA) as previously described. [38] Progression-free survival (PFS) was assessed by the Kaplan-Meier method, and the association between generic polymorphisms and risk for progression was assessed by Cox proportional hazard model with adjustment by stage of hepatocellular carcinomas. Hazard ratios and their 95% confidence intervals (95% CI) were computed. Data analyses were performed using STATA version 12.0 (Stata Corp, College Station, TX, USA)
Validation and functional analysis of SLC15A2
Hep3B, PLC/PRF5 and SNU182 cells derived from human HCCs were obtained from the Korean Cell Line Bank (KCLB; Seoul, Republic of Korea) and cultured in RPMI-1640 (Invitrogen, Carlsbad, CA, USA) with 10% (v/v) FBS and 100 U/mL penicillin-streptomycin at 37°C in 5% CO2. Genomic DNA was extracted from cells using a MagAttract DNA mini M48 kit (Qiagen) according to the manufacturer’s instructions. For analysis of the SLC15A2 genotypes, genomic DNA was amplified by PCR using SLC15A2 primers, forward: (5′-GGGTCTTGGGTGTAAATGGA-3′), reverse: (5′-CACACTTGGAGACCAGACGA-3′), and sequenced as described above. For the MTT assay, cells were plated in 96-well plates at a density of 1 × 10⁴ cells/well and treated with sorafenib for 48 h in RPMI-1640 medium. Next, the number of viable cells was measured by performing MTT assay (Promega Fitchburg, WI, USA) according to the manufacturer’s instructions. For western blot analysis, 30 μg of each cell lysates was resolved on 4–12% NuPage gel (Invitrogen) and then transferred onto Immobilon (Millipore, Billerica, MA, USA). Immunoblotting was performed using an anti-SLC15A2 primary antibody (Santa Cruz Biotechnology, Santa Cruz, CA, USA) and anti-β-actin (Abcam, Cambridge, MA, USA). Protein bands were detected using WestZol (iNtRon, Gyeonggi, Republic of Korea).
ACKNOWLEDGMENTS
This study was supported by research funding from the National Cancer Center (#1130730-1, #1410030, and #1510520-1). The bioinformatics work was supported by “Bioinformatics platform development for next generation bioinformation analysis” by the Ministry of Knowledge Economy (MKE, Korea; #10040231). The funders had no role in study design, data collection and analysis, decision to publish, or preparation of the manuscript.
CONFLICTS OF INTEREST
No conflicts of interest were declared.
REFERENCES
1. Jemal A, Siegel R, Ward E, Hao Y, Xu J, Murray T, Thun MJ. Cancer statistics. CA Cancer J Clin. 2008; 58:71–96.
2. EASL-EORTC clinical practice guidelines: management of hepatocellular carcinoma. J Hepatol. 2012; 56:908–943.
3. Park JW, Sherman M, Colombo M, Roberts L, Schwartz M, Degos F, Chen PJ, Chen M, Kudo M, Johnson P, Huang B, Orsini LS. Observations of hepatocellular carcinoma (HCC) management patterns from the global HCC BRIDGE study: first characterization of the full study population. J Clin Oncol. 2012; 30. suppl:abstr 4033.
4. Llovet JM, Ricci S, Mazzaferro V, Hilgard P, Gane E, Blanc JF, de Oliveira AC, Santoro A, Raoul JL, Forner A, Schwartz M, Porta C, Zeuzem S, Bolondi L, Greten TF, Galle PR, et al. Sorafenib in advanced hepatocellular carcinoma. N Engl J Med. 2008; 359:378–390.
5. Cheng AL, Kang YK, Chen Z, Tsao CJ, Qin S, Kim JS, Luo R, Feng J, Ye S, Yang TS, Xu J, Sun Y, Liang H, Liu J, Wang J, Tak WY, et al. Efficacy and safety of sorafenib in patients in the Asia-Pacific region with advanced hepatocellular carcinoma: a phase III randomised, double-blind, placebo-controlled trial. Lancet Oncol. 2009; 10:25–34.
6. Bruix J, Sherman M. Management of hepatocellular carcinoma: an update. Hepatology. 2011; 53:1020–1022.
7. Wilhelm SM, Adnane L, Newell P, Villanueva A, Llovet JM, Lynch M. Preclinical overview of sorafenib, a multikinase inhibitor that targets both Raf and VEGF and PDGF receptor tyrosine kinase signaling. Mol Cancer Ther. 2008; 7:3129–3140.
8. Thomas MB, Jaffe D, Choti MM, Belghiti J, Curley S, Fong Y, Gores G, Kerlan R, Merle P, O’Neil B, Poon R, Schwartz L, Tepper J, Yao F, Haller D, Mooney M, et al. Hepatocellular carcinoma: consensus recommendations of the National Cancer Institute Clinical Trials Planning Meeting. J Clin Oncol. 2010; 28:3994–4005.
9. Kim HY, Park JW. Molecularly targeted therapies for hepatocellular carcinoma: sorafenib as a stepping stone. Dig Dis. 2011; 29:303–309.
10. Meyerson M, Gabriel S, Getz G. Advances in understanding cancer genomes through second-generation sequencing. Nature reviews Genetics. 2010; 11:685–696.
11. Bentley DR, Balasubramanian S, Swerdlow HP, Smith GP, Milton J, Brown CG, Hall KP, Evers DJ, Barnes CL, Bignell HR, Boutell JM, Bryant J, Carter RJ, Keira Cheetham R, Cox AJ, Ellis DJ, et al. Accurate whole human genome sequencing using reversible terminator chemistry. Nature. 2008; 456:53–59.
12. Wheeler DA, Srinivasan M, Egholm M, Shen Y, Chen L, McGuire A, He W, Chen YJ, Makhijani V, Roth GT, Gomes X, Tartaro K, Niazi F, Turcotte CL, Irzyk GP, Lupski JR, et al. The complete genome of an individual by massively parallel DNA sequencing. Nature. 2008; 452:872–876.
13. Dimond PF. (2014). Exceptional Responders: The “N of 1” Paradigm. (http://www.nxtbook.com/nxtbooks/gen/clinical_omics_issue13/#/6).
14. Sawyers CL. The cancer biomarker problem. Nature. 2008; 452:548–552.
15. Llovet JM, Pena CE, Lathia CD, Shan M, Meinhardt G, Bruix J. Plasma biomarkers as predictors of outcome in patients with advanced hepatocellular carcinoma. Clinical cancer research: an official journal of the American Association for Cancer Research. 2012; 18:2290–2300.
16. Shao YY, Lin ZZ, Hsu C, Shen YC, Hsu CH, Cheng AL. Early alpha-fetoprotein response predicts treatment efficacy of antiangiogenic systemic therapy in patients with advanced hepatocellular carcinoma. Cancer. 2010; 116:4590–4596.
17. Hsu CY, Shen YC, Yu CW, Hsu C, Hu FC, Hsu CH, Chen BB, Wei SY, Cheng AL, Shih TT. Dynamic contrast-enhanced magnetic resonance imaging biomarkers predict survival and response in hepatocellular carcinoma patients treated with sorafenib and metronomic tegafur/uracil. J Hepatol. 2011; 55:858–865.
18. Imielinski M, Greulich H, Kaplan B, Araujo L, Amann J, Horn L, Schiller J, Villalona-Calero MA, Meyerson M, Carbone DP. Oncogenic and sorafenib-sensitive ARAF mutations in lung adenocarcinoma. The Journal of clinical investigation. 2014; 124:1582–1586.
19. Wagle N, Grabiner BC, Van Allen EM, Hodis E, Jacobus S, Supko JG, Stewart M, Choueiri TK, Gandhi L, Cleary JM, Elfiky AA, Taplin ME, Stack EC, Signoretti S, Loda M, Shapiro GI, et al. Activating mTOR mutations in a patient with an extraordinary response on a phase I trial of everolimus and pazopanib. Cancer discovery. 2014; 4:546–553.
20. Park JW, Koh YH, Kim HB, Kim HY, An S, Choi JI, Woo SM, Nam BH. Phase II study of concurrent transarterial chemoembolization and sorafenib in patients with unresectable hepatocellular carcinoma. J Hepatol. 2012; 56:1336–1342.
21. Zhou Q, Sparreboom A, Tan EH, Cheung YB, Lee A, Poon D, Lee EJ, Chowbay B. Pharmacogenetic profiling across the irinotecan pathway in Asian patients with cancer. British journal of clinical pharmacology. 2005; 59:415–424.
22. Zhou J, Shephard EA. Mutation, polymorphism and perspectives for the future of human flavin-containing monooxygenase 3. Mutation research. 2006; 612:165–171.
23. Koukouritaki SB, Poch MT, Henderson MC, Siddens LK, Krueger SK, VanDyke JE, Williams DE, Pajewski NM, Wang T, Hines RN. Identification and functional analysis of common human flavin-containing monooxygenase 3 genetic variants. The Journal of pharmacology and experimental therapeutics. 2007; 320:266–273.
24. Krueger SK, Vandyke JE, Williams DE, Hines RN. The role of flavin-containing monooxygenase (FMO) in the metabolism of tamoxifen and other tertiary amines. Drug metabolism reviews. 2006; 38:139–147.
25. Shen H, Keep RF, Hu Y, Smith DE. PEPT2 (Slc15a2)-mediated unidirectional transport of cefadroxil from cerebrospinal fluid into choroid plexus. The Journal of pharmacology and experimental therapeutics. 2005; 315:1101–1108.
26. Thauvin-Robinet C, Munck A, Huet F, de Becdelievre A, Jimenez C, Lalau G, Gautier E, Rollet J, Flori J, Nove-Josserand R, Soufir JC, Haloun A, Hubert D, Houssin E, Bellis G, Rault G, et al. CFTR p.Arg117His associated with CBAVD and other CFTR-related disorders. Journal of medical genetics. 2013; 50:220–227.
27. Hebestreit H, Sauer-Heilborn A, Fischer R, Kading M, Mainz JG. Effects of ivacaftor on severely ill patients with cystic fibrosis carrying a G551D mutation. Journal of cystic fibrosis : official journal of the European Cystic Fibrosis Society. 2013; 12:599–603.
28. Junyent M, Arnett DK, Tsai MY, Kabagambe EK, Straka RJ, Province M, An P, Lai CQ, Parnell LD, Shen J, Lee YC, Borecki I, Ordovas JM. Genetic variants at the PDZ-interacting domain of the scavenger receptor class B type I interact with diet to influence the risk of metabolic syndrome in obese men and women. The Journal of nutrition. 2009; 139:842–848.
29. Inoue J, Otsuki T, Hirasawa A, Imoto I, Matsuo Y, Shimizu S, Taniwaki M, Inazawa J. Overexpression of PDZK1 within the 1q12-q22 amplicon is likely to be associated with drug-resistance phenotype in multiple myeloma. The American journal of pathology. 2004; 165:71–81.
30. Angelini S, Pantaleo MA, Ravegnini G, Zenesini C, Cavrini G, Nannini M, Fumagalli E, Palassini E, Saponara M, Di Battista M, Casali PG, Hrelia P, Cantelli-Forti G, Biasco G. Polymorphisms in OCTN1 and OCTN2 transporters genes are associated with prolonged time to progression in unresectable gastrointestinal stromal tumours treated with imatinib therapy. Pharmacological research: the official journal of the Italian Pharmacological Society. 2013; 68:1–6.
31. Anderson CM, Thwaites DT. Hijacking solute carriers for proton-coupled drug transport. Physiology. 2010; 25:364–377.
32. Smith DE, Clemencon B, Hediger MA. Proton-coupled oligopeptide transporter family SLC15: physiological, pharmacological and pathological implications. Molecular aspects of medicine. 2013; 34:323–336.
33. Pinsonneault J, Nielsen CU, Sadee W. Genetic variants of the human H+/dipeptide transporter PEPT2: analysis of haplotype functions. The Journal of pharmacology and experimental therapeutics. 2004; 311:1088–1096.
34. Kim BH, Park J-W, Koh YH, Kim C-M. Clinical characteristics of long-term sorafenib therapy in patients with advanced hepatocellular carcinoma. Internaltional Liver Cancer Association Meeting. 2012. Abtract:P-201.
35. KLCSG-NCC K. Practice guidelines for management of hepatocellular carcinoma. Korean J Hepatol. 2009; 15:391–423.
36. Kim BH, Park JW, Koh YH, Kin C-M. Clinical characteristics of long-term responders to sorafenib in patients with advanced hepatocellular carcinoma [Abstract]. The 19th Annual Meeting of the Korean Association for the Study of the Liver. 2013.
37. Kanehisa M. The KEGG database. Novartis Found Symp. 2002; 247:91–101. discussion 101–103, 119–128, 244–152.
38. Yoo JY, Kim SY, Hwang JA, Hong SH, Shin A, Choi IJ, Lee YS. Association Study between Folate Pathway Gene Single Nucleotide Polymorphisms and Gastric Cancer in Koreans. Genomics & informatics. 2012; 10:184–193.