
INTRODUCTION
Intratumor phenotypic heterogeneity is a defining characteristic of human tumors. Cancer cell populations within tumors manifest various traits, including growth rates [1, 2], metastatic capacity [3], and therapy resistance [4, 5]. Heterogeneity complicates the study and treatment of tumors, because small tumor samples may not be representative of the whole tumor [6], and because cancers often become refractory to treatments [7]. Two models have been proposed to explain how heterogeneity arises and contributes to cancer progression. Clonal evolution theory emphasizes that tumor heterogeneity is the result of heritable genetic and epigenetic variation [8], whereas cancer stem cell (CSC) theory proposes that cancer cells stay in different differentiated states and exhibit tumor heterogeneity [9]. Three sources, genetic mutation, epigenetic variations and tumor microenvironment, which contribute to tumor heterogeneity have been discussed and reviewed [10–14]. Evolving evidence implicates other mechanism in intratumor heterogeneity. For example, considerable plasticity exists between cancer cells [10], tumors without driver mutations and/or epigenetic mutations are found [15–17], genetically divergent cells exhibit similar phenotypes [18], and cells harbor critical genetic mutations while no manifesting cancerous phenotypes [19]. In addition, abundant mosaic copy number variation (CNV) is found in normal human neurons, despite not contributing to the functional heterogeneity of the human brain [20]. Moreover, studies suggest that the relationship between genotype and phenotype is more complex than a one-to-one relation, and a complicated regulatory network may control heterogeneous functional phenotypes [11, 21–25]. Therefore, a systematic understanding of the specific driving forces behind heterogeneous subtypes of cancer via an integrated network is required.
GC is the second-most common cause of global cancer mortality, with an overall 5-year survival rate of approximately 20% [26, 27]. Histologically, human GC has been classified into intestinal and diffuse types by Lauren [28]. It is thought that intestinal-type GC develops from intestinalized mucosae, whereas diffuse-type GC arises in gastric mucosae [28, 29]. At a cellular level, human GC cells can also be classified into two heterogeneous phenotypes based on their phenotypic expression: the gastric epithelial cell type (including surface mucous cells and pyloric gland cells) and the intestinal epithelial cell type (including goblet and intestinal absorptive cell types) [30–32]. The two heterogeneous GC cell phenotypes are found in both intestinal- and diffuse-type GC. In the present work, the intratumor heterogeneity of GC is referred as to the two GC cell phenotypes, gastric and intestinal, which will be the focus of our modeling analysis. Phenotypic transition from gastric- to intestinal-type epithelial cells has been observed in human GC and precancerous lesions [33]. The transcription factor Cdx2 is the key mediator of intestinal differentiation in both normal and aberrant locations [34]. Sox2 and Shh are indicated as essential regulators of gastric differentiation [35, 36]. Increased expression of intestinal transcription factor Cdx2 and decreased expression of gastric transcription factors Sox2 are observed in intestinal metaplasia, a precancerous lesion of intestinal type GC [37]. However, the regulatory mechanism of maintaining two heterogeneous GC phenotypes and phenotypic transition is still largely unknown.
Previously, we have proposed an endogenous molecular network hypothesis to understand the genesis and progression of cancer at a systematic level [25, 38, 39]. The endogenous molecular network is formed by endogenous molecular factors, such as transcription factors, growth factors and cytokines, and the interactions among them through signal transduction pathways and transcriptional interactions. We assume that cell types can be characterized by the activities or concentration of these endogenous factors. The dynamics of biochemical factors representing the endogenous network can be quantitatively described by a set of nonlinear and coupled differential equations. Local attractors, including stable equilibrium or limit cycles, are generated by the nonlinear interactions among endogenous factors. Biologically, these attractors may represent cell phenotypes with obvious or non-obvious biological functions, for example, cell cycling and cell arrest. We also assume that normal tissue cells and heterogeneous cancer cells are endogenous attractors in the endogenous molecular network.
In this work we study the heterogeneity of GC via the endogenous molecular network. In the following section, we first discussed the assumption and procedure of the endogenous network construction using GC as an example. Then, the working network is quantified by a nonlinear dynamic system, and the modeling results are compared with experimental data. The working network reproduces the principal known features of normal gastric epithelium and GC at both module and molecular levels, which suggests that the working model is valid for studying GC. For example, normal gastric epithelial cells mainly exhibited cell cycle arrest and differentiated phenotype, while gastric cancer cells showed proliferative, apoptosis resistant, inflammatory and abnormal differentiated phenotype. Finally, two mechanisms that contribute to the intratumor heterogeneity of GC are identified. One is that particular positive feedback loops are found to be responsible for the maintenance of intestinal and gastric phenotypes of GC cells. Second, 16 transition routes of GC cell progression from a normal attractor to GC cell attractors are identified. Different transition routes are characterized by the dynamic behaviors of individual key molecular components, suggesting that GC cells progression may be heterogeneous.
MATERIALS AND METHODS
Biological assumptions and endogenous network construction
The endogenous molecular network of GC was constructed according to the endogenous molecular network hypothesis [38, 39]. The endogenous molecular network of GC aimed to describe the core regulatory mechanism of GC from a mechanistic perspective; thus we started from the conservative part: core network, which included important functional modules, molecular components and interactions (activation and inhibition). The work flow of network construction and modeling are summarized in Figure 1A. The main assumptions underlying and approaches of constructing the network are listed as follow. First, the endogenous network of GC was assumed to be constructed by a group of functional modules and crosstalk among them. Hanahan and Weinberg [14, 40] have proposed general cancer hallmarks, which provide an organizing principle for understanding the biology of cancer. Moreover, the essential traits of GC have also been reviewed over the past decades [41–43], which are similar to general cancer hallmarks. These essential traits include self-stimulating proliferative signaling, abnormal cell cycling, evading cell death, activating angiogenesis, inducing invasion and metastasis, reprogramming of energy metabolism, inflammation and abnormal gastric differentiation. These distinctive and complimentary traits may represent the main features of GC and provide a logical framework for modeling GC from a mechanistic perspective. Thus, based on general cancer hallmarks, particular dysregulations of signaling pathways and gene signatures for GC, GC was described by a group of essential functional modules, including cell cycle, apoptosis, inflammation, angiogenesis, growth factor signaling pathways, metabolism, cell adhesion and gastric differentiation.
For the same reason, the key components that are dysregulated in GC and control the functional status of modules and their interactions were included in the core network [40–43]. The endogenous factors were assumed to be proteins or protein complexes, because proteins are main executors of biological processes via the role they play in regulating signalling transduction and gene expression. The interactions of endogenous factors are mainly direct activation/upregulation and inhibition/downregulation relationships based on current knowledge of signal transduction pathways and the gene transcription network. The PubMed literature database was used to search for those interaction relations, and a total of 275 publications from 1987 to 2013 were referenced.
Taking the cell cycle module as an example, normal tissues carefully control the cell cycle, thereby ensuring a homeostasis of cell number and thus maintenance of normal tissue architecture and function. In contrast, cancer cells are able to deregulate growth-promoting signaling as well as some negative feedback mechanisms. Thus, in our network, critical kinases and transcription factors (e.g., cyclin D-Cdk4/6, cyclin E-Cdk2, E2F) were included to describe the core molecular mechanisms that control the restriction (R) point of the cell cycle. The activated cyclin D-Cdk4 complex phosphorylates the retinoblastoma protein (Rb). The hyperphosphorylated Rb dissociates from the E2F/Rb complex, activating E2F. Activated E2F then induces the transcription of various genes, such as cyclin E and Cdk2. Cyclin E and Cdk2 form the cyclin E-Cdk2 complex, which pushes the cell go through the R point and to enter the S phase. At a module level, the growth factors module, which involves essential growth factor signals (e.g., EGF, HGF, IGF), instruct cells to enter and process through the cell cycle. For example, the EGF and its receptor activate the transcription of cell-cycle-related genes, such as myc and cyclinD, by inducing activation of the Ras/MAPK pathway and the PI3K/Akt pathway. In addition, the negative-feedback mechanisms that attenuate proliferative signaling (e.g., PTEN, p21, p27 and p53) were included to characterize the core regulatory mechanism of cancer proliferation. For example, PTEN can dephosphorylate phosphatidylinositol (3,4,5)-trisphosphate (PtdIns (3,4,5)P3 or PIP3) and negatively regulate the Akt/PKB-signaling pathway. The detailed molecular mechanisms of constructing the core endogenous molecular network are summarized in the text under Text S1. Supporting method.
Based on studies of feedback control of intercellular signaling and the transcriptional network [44, 45], another rational assumption was that these endogenous factors and their interactions constitute an autonomous and closed-loop network. The closed-loop network introduces positive or negative feedback at each node in the network: process input has an effect on the process output; the output is fed back as input to the process, closing the loop. Based on the above hypothesis, a core endogenous molecular network for GC has been constructed (Figure 1). These interactions and literature references are summarized in Figure 1A and Supplementary Table S1.
Quantification of the network
The endogenous molecular network was constructed based on a group of endogenous factors and their interactions. The activity/concentration of each endogenous factor was modulated by other endogenous factors via signal transduction and transcriptional relations. This process can be described by a set of typical chemical rate equations that includes production rate and degradation rate [46]. We assumed that molecular interactions among endogenous factors show a switch-like behavior that can be modeled by the sigmoid-shaped Hill function. Thus, the production rate was quantitatively represented by the Hill functions which have been used to model many biological processes [22, 47, 48]. We take cyclin D-Cdk4/6 complex as an example to illustrate how to construct differential equations. cyclin D-Cdk4/6 can be activated by Myc, NF-κB, ERK, p38, and JNK and inhibited by GSK3β, Sox2 and p21. To re-illustrate the underlying biology of this network, the deterministic description for the cyclin D-Cdk4/6 complex activity/concentration under the influence of Myc, NF-κB, ERK, p38/JNK, GSK3β, Sox2 and p21 takes the form in equation (1): [22, 47–50]
(1),
where represents the activity/concentration of cyclin D-Cdk4/6 and represents the degradation rate of cyclin D-Cdk4/6. is the degradation constant of cyclin D-Cdk4/6, which is normalized to 1. is the integrated production rate that is modeled by the sigmoid-shaped Hill function in equation (2):
f(Myc, NF − κB, ERK, p38/JNK, Sox2, p21) =
(2),
where is the Hill coefficient and describes the kinetic properties of each component in regulating the production of the cyclin D-Cdk4/6 complex. The relative activity/concentration of the component was considered with these formulations, and the component activity or concentration was permitted to vary between 0 and 1, which indicates the maximal and minimal activity/concentration, respectively. This assumption will not influence validations, because many experimental data, such as gene expression data, are also measured in a framework of relative concentration. Other components in the network were quantified in the same approach. With the above quantitative assumptions, the network was transformed into a set of coupled ordinary differential equations (Text S1. Supporting method), which represents a nonlinear dynamic system and implies some attractors underlying the endogenous network.
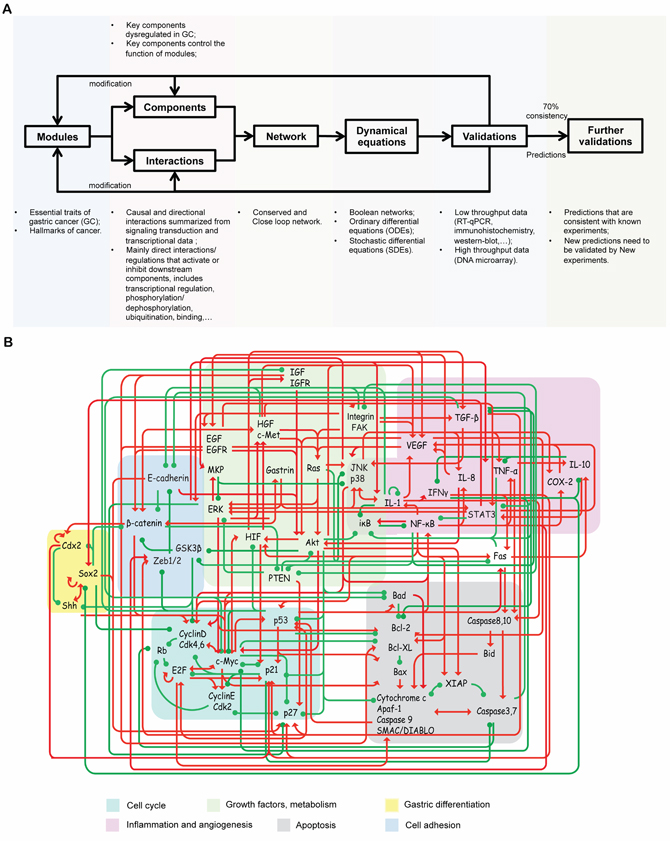
Figure 1: Work flow and the core endogenous network of GC. A. Work flow of the core endogenous network of GC construction and modeling. B. The core network included 8 functional modules, 48 functional components and 215 connections. Differently colored areas represent different functional modules. The interactions include both direct and indirect effects. The interactions can be interpreted as follows: the red arrows and green hammerheads indicate activation and inhibition processes, respectively.
The total numbers of dynamic variables is 48. As the total numbers of interactions is 215 and define the cooperativity of each interaction and corresponding to , thus the total number of and are 215 and 215, respectively. Because the exact values of the parameter and in the function are not known, several assumptions were made based on biological literature. First, the activating (red lines) and inhibiting (green lines) relations were assumed to be quantified by the following Hill functions, respectively,
The Hill coefficient n mathematically determines the slope of the sigmoid curve (Supplementary Figure 1), and biologically defines the interactional cooperativity. Quantitative studies on signal transduction systems have revealed that switch-like and sigmoidal input/output relationships are common in cell signaling [51]. For example, the multistep binding of oxygen to hemoglobin [52], the binding of transcriptional factors to multiple DNA binding sites and priming in multisite phosphorylation [53] are known to exhibit switch-like and sigmoidal input-output relationships. Cooperativity has been demonstrated to account for the sigmoidal curve, and the mechanisms capable of creating a switch-like response have been discussed [51]. The Hill coefficient n that determines the slope of the sigmoid curve (Supplementary Figure 1), can quantitatively define the cooperativity. If , the system exhibits negative cooperativity; if , the system exhibits no cooperativity; if , the system exhibits positive cooperativity; if , the sigmoidal curve can barely represent a switch-like behavior; if , the sigmoidal curve represent a switch-like behavior; if , the equations correspond to Boolean functions (Supplementary Figure 1). Moreover, quantitative studies of signal transduction systems—for example, cell cycle regulation [51], MAPK pathways [51], Ras activation [54] and Notch signaling [55]—have shown that Hill coefficient . Thus, the parameter range was used in the working model.
As for parameter a, it biologically describes the kinetic properties of each component L in regulating the production of x. Mathematically, a defines a threshold at which the activation/concentration of x is half its maximal value. The deductive process of a is listed below.
Because the concentration/activity of each component x was normalized to the range from 0 to 1, we assumed that when , then ; when , then ; and when , then . Thus, we deduced that .
Some studies have showed that Hill coefficients might vary in different cell types [51]. Thus, the Hill coefficients and were used in the current model. The invariant 8 attractors (Supplementary Table S4–S9) and 14 saddle points (Supplementary Table S10–S13) under parameter and were found. In addition, the random parameter and were checked, and the 8 attractors and 14 saddle points (Supplementary Table S14–S15) were still invariant under random parameter and .
In some cases, the signal transduction process may exhibit a hyperbolic response or gradual activation/inhibition rather than a switch-like response. The hyperbolic response indicats that there is no or weak cooperativity, suggesting the Hill coefficient . Thus, the random parameters and were also checked in the working model. The 8 attractors and 13 saddle points (Supplementary Table S16–S17) were found still to be invariant under the random parameter and . Several theoretical [56, 57] and experimental [58, 59] studies also have found that, in variations of biochemical parameters, the key processes of specific intracellular networks still exhibit a robust behavior.
Moreover, similar attractors were obtained via a Boolean approach within the same network (Supplementary Table S18). As shown in these results, the primary properties of the working network are mainly constrained by the network structure rather than by specific parameters. The parameters used to produce the figures in this study are as follows: .
Attractor caculation
First, through normalization, all biologically possible values of variables were confined to the interval [0,1]. Then, we chose random initial conditions and used the following two independent algorithms, the fixed-point iteration algorithm and the Newton iteration algorithm, to calculate attractors for the nonlinear dynamical system.
(1) Fixed-point iteration algorithm:
Firstly, we generated a random vector ; then, according to the dynamical systems, we iterated using ; after a considerable number of iterations, we judged its convergence by . Last, we recorded , which meet the definition of being an attractor. The above calculations were repeated to find other attractors.
(2) Newton iteration algorithm:
We solved the nonlinear function using Newton’s method. We obtained fixed points using this algorithm. Eigenvalues linearized around a fixed point were used to determine whether the fixed points were stable or unstable. If the set of real eigenvalues for the system were uniformly negative, the fixed point was regarded as a stable point/ point attractor. If the set of real eigenvalues for the system had both positive and negative eigenvalues, the fixed point was regarded as an unstable saddle point. Point attractors obtained by the Newton iteration algorithm were consistent with the results obtained by the fixed-point iteration algorithm.
It is practically impossible to enumerate all of the possible attractors of such a high-dimensional nonlinear dynamic system. We sampled enough times to confirm that there were at least 8 attractors. As shown in Supplementary Table S6, when the calculations were repeated 40000 times, we obtained 8 attractors (point attractors and cyclic attractors). When the calculations were repeated 40,000,000 or more times, we still obtained 8 attractors. Thus, we concluded that there were at least 8 attractors.
Saddle point caculation
Using Newton’s method to solve the nonlinear function , we obtain fixed points for the system , which included both unstable and stable saddle points. We used two methods to determine unstable saddle points. First, as mentioned above, eigenvalues can be used to determine whether a fixed point is stable or unstable. The second method is that we perturbed the fixed point in the system. A stable point can be perturbed in any dimension yet eventually return to its original location and remain there. A saddle point will roll away from its original location and roll into its connecting stable points/attractors under perturbation. Saddle points calculated by the two independent methods are the same. In addition, through perturbation on saddle points, we were able to determine their connecting attractors and identify possible transition routes among attractors.
RESULTS
Construction of the core endogenous network of gastric cancer (GC)
The core endogenous network of GC was constructed according to the endogenous network hypothesis. (The biological assumptions and methods are provided in the Methods section and Text S1. Supporting method.) In this network, GC was described by a group of essential functional modules, and the functional status of each module was regulated by a group of key endogenous factors (Table 1). The endogenous factors and their activation/up-regulation and inhibition/down-regulation relations were drawn from documented signalling transduction pathways and gene transcription network in the PubMed literature database (including 275 references; details are provided in Text S1. Supporting method and Supplementary Table S1). These endogenous factors and their interactions constituted a closed-loop network, encompassing 8 functional modules, 48 endogenous factors and 215 connections. The working network aimed to present the core endogenous regulatory mechanism of gastric epithelium and analyze how these endogenous factors cooperate and collectively function at a systematic level. Because the key endogenous factors and their interaction relations have been demonstrated to be conserved, the core endogenous network of GC can be reproduced according to the hypothesis.
Table 1: Modules and components in the core endogenous molecular network for gastric epithelium
Essential modules |
Key components |
Cell cycle |
Rb, Cyclin D-CDK4/6, Cyclin E-CDK2, Myc, E2F, p21, p27, |
Apoptosis |
Caspase 3/7, Cytochrome c/Caspase 9/Apaf-1, Caspase 8/10, XIAP, Bcl-2, Bcl-XL, Bid, Bad, Bax/Bak |
Growth factors |
EGF/EGFR, IGF/IGFR, HGF/Met, VEGF/VEGFR, Gastrin, Ras, PI3K-AKT, ERK, JNK, p38, PTEN, MKP |
Cell adhesion |
Integrin, E-cadherin, Zeb1/2 |
Inflammation |
p53, HIF, NF-κB, iκB, TNF-α, IL-10, IL-1, IL-8, Fas, TGF-β, IFN-γ, STAT3 |
Angiogenesis |
VEGF/VEGFR, COX-2 |
Metabolism |
GSK3β, HIF, Akt |
Gastric differentiation |
Sox2, Shh, β-catenin, Cdx2 |
It should be noted that the current endogenous network of GC is vastly simplified under our framework. A detailed molecular endogenous network will contain a vast number of endogenous factors; at present, the modeling of all interactions remains beyond our capabilities [60]. Therefore, only essential functional modules and key components were included in the network. Functional modules or components that were not presented in the current work may exert influence or be influenced by the working network. The working network is one of the simplest versions and can be expanded or revised to accommodate those effects. Nevertheless, we will demonstrate that the simplest version may characterize the main features of normal gastric epithelium and GC at the modular and molecular levels. In addition, we provide new predictions that need to be tested by new experimental data.
Eight attractors were identified
We have provided a general framework to quantify the core endogenous molecular network [22, 47, 48] (the complete list of model ODEs being provided in Supplementary Table S1) and transformed it into a nonlinear dynamic system, which contained some attractors underlying the endogenous molecular network. Two independent algorithms were used to calculate attractors; these algorithms yield consistent results: at least 8 local attractors were found in the network (Figure 2).
Each attractor potentially corresponded to a specific cellular phenotype with significant biological functions. Attractors are characterized by the relative activities/concentrations of components. According to the components activation or expression level of a component, the functional status (i.e., “ON” or “OFF”) of the modules in each attractor can be determined. We then summarized the status of functional modules in each attractor (Figure 3). The 8 attractors were classified into the following 4 unique cell fates based on the status of function modules: cell cycle arrest (A1–A3), proliferation (P1 and P2), cell death (D), and stress response (R1 and R2) (Figure 2). Point attractors A1–A3 with relatively high Rb and p27 activities manifested an “OFF” cell cycle and were defined as possessing a cell fate of cell cycle arrest. Cyclic attractor D with relatively high activities of pro-apoptosis factors and low activities of anti-apoptosis factors indicated that apoptosis is “ON”, and the cell fate was defined to be cell death. Point attractors R1 and R2 manifested relatively high HIF, NF-κB and inflammatory factor/receptor activities, suggesting that the stress response is “ON.” The cell fate of this class was defined as stress response. Point attractors P1 and P2 manifested relatively high cyclin E/Cdk2 and E2F activities and low Rb and p27 activities, indicating an “ON” cell cycle. The cell fate of this class was defined as proliferation. In summary, these attractors may represent specific cellular phenotypes.
Validation of the endogenous network at the modular and molecular levels
The working network was validated by the main features of gastric epithelium and GC at the modular and molecular levels. Normal gastric epithelium was assumed mainly to consist of normal differentiated epithelial cells, and GC tissue was assumed mainly to include cancer cells. The statuses of the functional modules were summarized, including cell cycle, apoptosis, inflammation, angiogenesis, metabolism, cell adhesion and gastric differentiation, in normal gastric epithelium and GC using clinical and experimental data (Figure 3) [14, 61]. The normal gastric epithelium and GC exhibited opposing statuses for some essential modules. The attractors A1 and P1–P2 were specifically consistent with normal gastric epithelium and GC, respectively, at modular level. In summary, we preliminarily concluded that A1 and P1–P2 characterize normal gastric epithelium and GC, respectively.
The preliminary conclusion was then validated with both low- and high-throughput data at the molecular level in normal gastric epithelium and GC. First, we collected relative changes in the expression or activity of each component from GC and adjacent, noncancerous gastric tissues from low-throughput experimental data (Supplementary Table S2). For the low-throughput data, gene expression was detected by real-time reverse transcription quantitative PCR (RT-qPCR), whereas protein concentration and activity status were detected by immunohistochemistry and western blotting. For example, the activation statuses of cytokines, such as EGF, TNF-α and gastrin, were mainly regulated at the transcription level, which were checked by RT-qPCR data; whereas the activation statuses of signaling proteins, such as PI3K/Akt, ERK, JNK and p38, were mainly regulated by phosphorylation, which were checked by immunohistochemistry and western blot data.
Next, we summarized the relative transcriptional changes of each component from sporadic gastric adenocarcinoma samples and normal gastric mucosa samples from high-throughput data (Supplementary Table S3). The relative changes of the components in P1 and P2 were compared with A1 (Supplementary Table S2 and S3). The comparison indicated that 97.5% of modeling results P1/A1 were consistent with low-throughput experimental data (including 74 references, Figure 4 and Supplementary Table S2) and that 72.1% and 73.3% were consistent with high-throughput data, respectively (Figure 4 and Supplementary Table S3); and for modeling results P2/A1, that 95%, 72.1% and 71.1% were consistent with low and high-throughput data (Figure 4, Supplementary Table S2 and S3, GEO ID: GSE 19826, GSE 22183), respectively. For high throughput data, with the exception of checking the gene expression of the components in the working network, we also checked the gene expression of downstream nodes of some signaling pathways, including Ras/MAPK, VEGF, NF-κB and Wnt/β-catenin signaling (presented in Supplementary Table S19). The comparison indicated that 67% (GSE 19826) and 66.7% (GSE 22183) of the relative gene expression changes of downstream nodes predicted by the modeling results were consistent with high-throughput data. Considering the heterogeneity of cancer [10] and the intrinsic experimental error [62], the accuracy rates suggested good consistency.
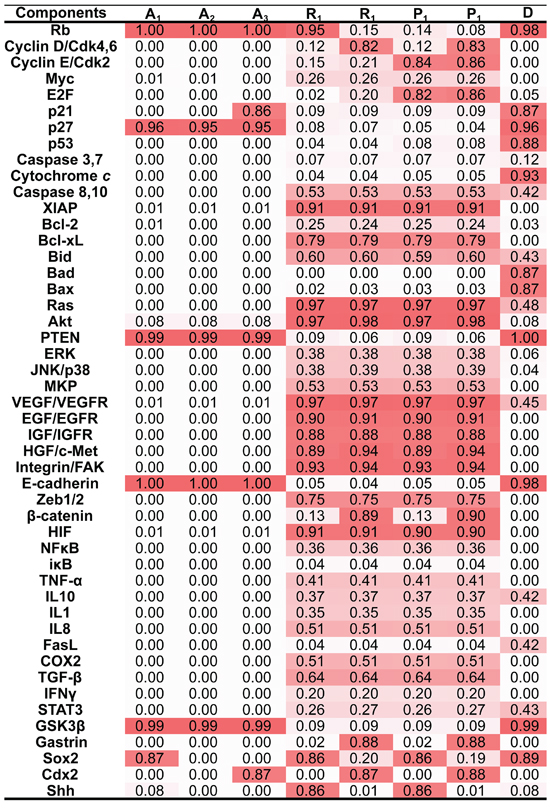
Figure 2: Attractors in the working network. Eight attractors were identified in the endogenous molecular network for GC. Each attractor was characterized by the relative activities of all components, which were normalized to the range from 0 to 1, with 0 (white) denoting minimal activity and 1 (Red) denoting maximal activity. According to the component activity level in different functional modules, the eight attractors were classified into 4 cell fates including cell cycle arrest (A1, A2 and A3), cell death D., stress response (R1 and R2) and proliferation (P1 and P2). Each column represents a component and each row represents an attractor. A1, A2, A3, R1, R2, P1 and P2 are point attractors, whereas D is a cyclic attractor. The dynamical trajectories of caspase 8/10, Bid, Fas, VEGF/VEGFR, IL10, Ras and STAT3 are shown in Supplementary Figure 2.
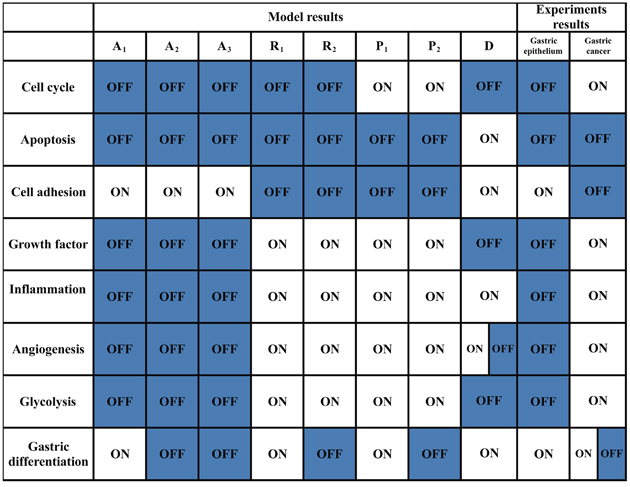
Figure 3: Functional status of modules from the model and experimental results. The functional statuses of the modules for each attractor from the endogenous network are listed in column 2—9. A1–A3: cell cycle arrest attractor; P1–P2: proliferation attractor; D: cell death attractor; R1–R2: stress response attractor. D is a cyclic attractor from which some components activities, such as VEGF/VEGFR, oscillated (Supplementary Figure 1). Thus, the functional status of angiogenesis module could oscillate between ON and OFF. The functional statuses of modules in normal gastric epithelium and GC based on experimental and clinical data are listed in column 10–11. [14, 61] N/A indicates that the functional module status is experimentally inconclusive. The clinical samples of GC show either gastric or non-gastric (mainly intestinal) phenotype at both cellular and histological level. Thus, the functional statuses of the gastric differentiation module in GC are either ON or OFF in GC.
The consistency of the model results and the experimental data at the modular and molecular levels support the notion that the working network may characterize the main features of the normal gastric epithelial and GC phenotypes, respectively. The result is quite interesting because the molecular components and interactions in the network were obtained independent from microarray data and because the attractors closely agreed with those data. It should be noted that, given the heterogeneity characteristic of cancer, intrinsic experimental error, assumption about parameters and incomplete working network, it was neither sufficient nor necessary to adjust the model to exactly fit existing experimental data, such as fold changes.
Specific positive feedback loops maintain the intestinal and gastric types of GC cell attractors
One important property of a nonlinear dynamic system is that the multistability of the system is produced and maintained by key components and their interactions [63, 64]. Because the endogenous molecular network is quantified by a nonlinear dynamic system, its properties can be discussed here. The working model revealed that underlying positive feedback loops (PFLs) are responsible for maintaining the heterogeneous phenotypes of GC.
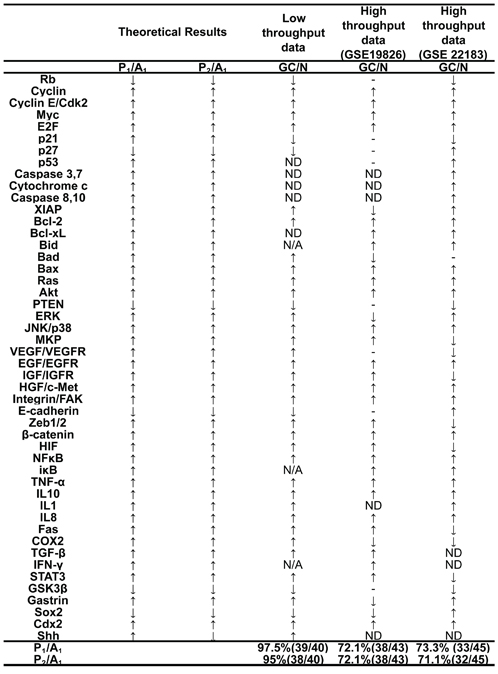
Figure 4: Comparing the modeling results and experimental data of the relative change of components. If the ratios of one component between two attractors (for example, P1 to A1) are greater than 1, we define the component activity as increased; otherwise, the component activity is decreased. Relative changes in expression or activities of components from normal gastric epithelium to GC are summarized from low and high throughput data (in column 3–5, detail references in Supporting Supplementary Table S2 and S3). The comparison indicates that 97.5% of modeling results P1/A1 are consistent with low-throughput experimental data and that 72.1% and 73.3% are consistent with high-throughput data, respectively; and for modeling results P2/A1, that 95%, 72.1% and 71.1% are consistent with low and high-throughput data, respectively. GC, gastric cancer; N, normal gastric epithelium; ↑, increased component activity or expression; ↓, decreased component activity or expression; ↓, non-significant or uncertain variation in component activity or expression; N/A, no experimental data; ND, non-determined variation in component expression.
The working network revealed that the GC cell attractor P1 is maintained by four positive feedback loops: growth-factor-related, cell-cycle-related, inflammation-related and gastric-differentiation-related PFLs (Figure 5A). In contrast, the GC cell attractor P2 was maintained by growth-factor-related, cell-cycle-related, inflammation-related and intestinal-differentiation-related PFLs (Figure 5B).
Both P1 and P2 were maintained by the growth-factor-related, cell-cycle-related and inflammation-related PFL. The growth-factor-related PFL included receptor tyrosine kinases (RTKs)-Ras, Akt and mitogen-activated protein kinases (MAPK, including ERK, JNK and p38). RTKs are cell surface receptors for many growth factors, including EGFR, IGFR, Met and VEGFR [65]. RTK activation may lead to the activation of downstream signal transduction pathways, such as the MAPK signaling cascade, and the activation of signal transduction pathways can change gene expression and activate RTKs and, subsequently, establish a growth-factor-related PFL [65, 66]. Inflammatory cytokines (IL-1, IL-8, TNF-α) and NF-κB establish an inflammation-related PFL [67, 68]. Inflammatory cytokines, IL-1, IL-8 and TNF-α, can activate NF-κB through IKK-iκB-signaling or JNK-signaling pathways. Activated NF-κB in epithelial cells can produce cytokines, such as IL-1 and IL-8, thus constituting an inflammation-related PFL. The transcription factors Myc and E2F can induce the expression of each other, and E2F also can transcriptionally activate its own genes E2F-1 and E2F-2, thus establishing a cell-cycle-related PFL [69, 70].
The difference between the P1 and P2 attractors is that P1 is also maintained by the Sox2-Shh PFL, whereas P2 is also maintained by the gastrin-β-catenin and the Cdx2 autoregulatory PFLs. Expression of the Sox2 gene can be regulated by the Gli2 transcription factor, a downstream effector of Shh signaling, and Shh is also a target of Sox2, thus establishing a PFL [71]. Gastrin was identified as a target of the β-catenin/TCF-4 growth-signaling pathway, and gastrin also stabilizes β-catenin protein and activates β-catenin-mediated transcription, thus establishing a PFL [72]. The gastrin-β-catenin positive loop can activate the Cdx2 autoregulatory loop, which plays a critical role in intestinal differentiation [34].
The working network revealed that different positive loops are responsible for maintaining heterogeneous GC cell attractors. The Sox2-Shh PFL may be responsible for maintaining the gastric-type GC cell attractor P1. Biologically, Sox2 exerted a dominant effect on the maintenance of the gastric epithelial phenotype [73] and is involved in the regulation of gastric-specific genes, such as pepsinogen and Muc5ac [74, 75]. Shh target genes modulate gastric parietal cell functions, such as acid secretion [76]. The activated Sox2-Shh PFL may influence other functional module statuses, such as modulating the cell cycle and inducing differentiation of gastric epithelial cells [73]. The working network also showed that the Gastrin-Wnt/β-catenin and Cdx2 autoregulatory PFLs might be responsible for maintaining intestinal-type GC cell attractor P2. Cdx2 and Wnt/β-catenin signaling play pivotal roles in intestinal development [77, 78] and are abnormally expressed/activated in intestinalized gastric mucosa and intestinal-type GC [79, 80]. Clinical data also revealed that Sox2 was up regulated in gastric-type GC, whereas Cdx2 was up regulated in intestinal-type GC [81]. These experimental data indicate that gastric- and intestinal-type GC cell phenotypes are maintained by the Sox2-Shh and Gastrin-Wnt/β-catenin-Cdx2 loops, respectively. The activated Gastrin-Wnt/β-catenin-Cdx2 loops may also affect the statuses of other functional modules, such as modulating the cell cycle and inducing the transdifferentiation of gastric epithelial cells [34, 79, 82].
Regulating the two distinct positive feedback loops may control the transition between the two heterogeneous cancer attractors. The working model indicated that intestinal-type attractor can be induced to the gastric-type by consistently expressing Sox2 (Supplementary Figure 3A). However, gastric-type GC can be induced to the intestinal-type merely by consistently activating Cdx2 and inhibiting Sox2 simultaneously (Supplementary Figure 3B). Biologically, PFLs can be activated/inhibited by activating/inhibiting proteins in the loops directly, or by modulating other regulatory molecules that affect the PFL indirectly. Small interfering RNA (siRNA) transfection and Cre-Lox recombination technologies can be used to inhibit and induce the expression of proteins in the loops; thus, we can use these technologies to testify these predictions. In short, the network posits a potential regulatory mechanism that controls the transition between two heterogeneous cancer cell phenotypes transition.
Heterogeneous dynamic routes of GC progression
Another property of nonlinear dynamic system is that the multistable system is thought to be involved in the generation of switch-like biological process. In response to a transient perturbation, the system may flip back and forth between attractors. The saddle point, a particular unstable equilibrium, of a multistable system is highly relevant to understand the global behavior of the transition process between attractors. One feature of a saddle point is that it is like a mountain pass connecting neighboring valleys and reveals the possible transition routes between attractors [83]. Fourteen saddle points were obtained in the model, which were robust against reasonable parameters as well as random parameters. The attractors and saddle points depicted a schematic functional landscape of the working network (Supplementary Figure 4). The functional landscape has provided a useful framework to consider non-genetic changes that occur during cancer progression [11]. From this perspective, non-genetic perturbations, such as fluctuations in gene expression or environmental stimuli, may drive transition between distinct attractors in the given landscape. The functional landscape of the working network revealed 16 transition routes from the normal gastric epithelial cell attractor A1 to either of the GC cell attractors P1 or P2 (Figure 6).
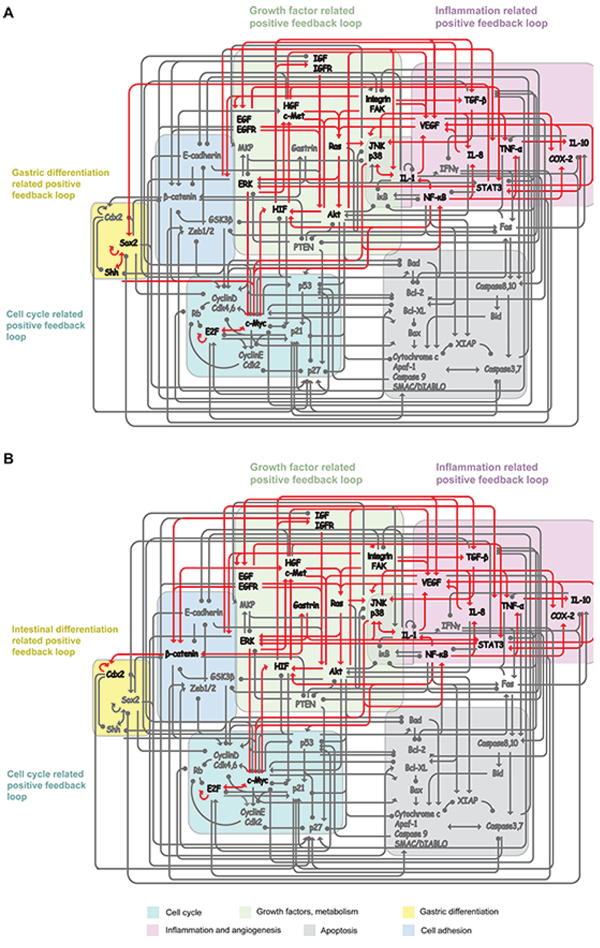
Figure 5: Positive feedback loops (PFLs) maintain heterogeneous GC cell attractors. A. Gastric type GC cell attractor is maintained by four positive feedback loops: growth factor related PFL (RTKs, Ras, Akt, MAPKs and HIF); cell cycle related PFL (Myc and E2F); inflammation related PFL (NF-κB, TNF-α, IL-1, IL-8 and IL-10)); gastric differentiation related PFL (Sox2 and Shh). B. Intestinal type GC cell attractor was maintained by growth factor related PFL, cell cycle related PFL; inflammation related PFL and intestinal differentiation related PFL (Gastrin, β-catenin and Cdx2).
Another feature of saddle point is that it captures the intermediate phase of the transition process. Transition routes that connected the normal gastric epithelial cell attractor A1, stress response attractors R1 or R2, the GC cell attractors P1 or P2 and the saddle points among them may reveal definite dynamic routes of GC cell progression. According to the component activation pattern in these transition routes, these transition routes characterized the main features of GC cell progression, including increased cell proliferation, enhanced inflammation, evasion of apoptosis, induced angiogenesis and activated invasiveness [41, 84].
The 16 transition routes were determined by the connections of attractors and saddle points, which revealed heterogeneous activation patterns of particular components. According to the combined activation pattern of β-catenin, Cdx2, gastrin, Sox2 and Shh, the 16 transition routes could be classified into 4 definite heterogeneous routes of GC cell progression: (1) Sox2 and Shh activities are high, whereas β-catenin, Cdx2 and gastrin activities are low (Figure 7A); (2) Sox2 and Shh activities decrease and then increase, while β-catenin, Cdx2 and gastrin activities increase and then decrease (Figure 7B); (3) Sox2 and Shh activities oscillate and then decrease, whereas β-catenin, Cdx2 and gastrin activities oscillate and then increase (Figure 7C); and (4) Sox2 and Shh activities gradually decrease, whereas β-catenin, Cdx2 and gastrin activities increase (Figure 7D). The heterogeneous activation patterns resulted from the mutually inhibitory natures of the Sox2-Shh and Gastrin-Wnt/β-catenin-Cdx2 PFLs (Supplementary Figure 3). When components in the two PFL are expressed at appropriate levels, the Sox2-Shh or Gastrin-Wnt/β-catenin-Cdx2 PFL may switch on/off; then the system may tend to settle upon either gastric- or intestinal-type attractors.
The Sox2-Shh and Gastrin-Wnt/β-catenin-Cdx2 PFLs not only influenced gastric differentiation but also mutually interacted with other functional modules, such as cell cycle, apoptosis, metabolism and angiogenesis. Some components of the cell cycle module also exhibited heterogeneous patterns during GC cell progression (Supplementary Figure 5). The cell state transitions between R1, R2, P1 and P2 may affect the cellular phenotype during GC cells progression, such as the proliferative capacity and morphology of cancer cells. Thus, the 16 transition routes indicated that GC cell progression is heterogeneous, which is revealed by the dynamic behaviors of individual key molecular components. In addition, the functional landscape indicates that cells in GC can be in cancer attractors P1 and P2 and saddle points. Thus, they may exhibit gastric, intestinal, or even intermediate cancer phenotypes, respectively, thereby providing a potential mechanism for then co-occurrence of intestinal- and gastric-type cancer cells in clinical samples [85].
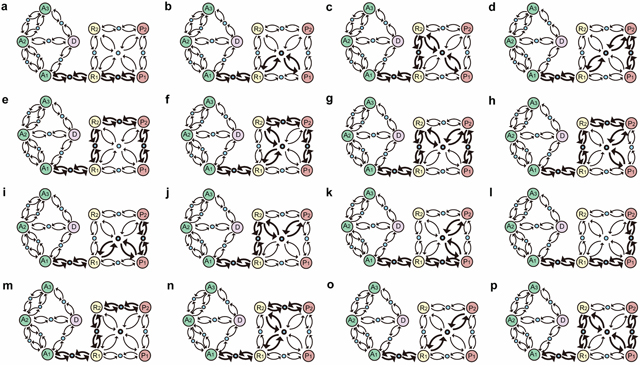
Figure 6: Inherent evolutional routes from normal gastric epithelial cell attractor A1 to GC cell attractors P1 and P2. Sixteen routes (a–p) from A1 to P1 or P2 were identified in the functional landscape of the core endogenous molecular network for gastric epithelium. Large circles represent attractors indicating 8 cellular phenotypes. Blue circles represent saddle points, which are unstable equilibrium states. Arrows denote where a transition likely occurs between 2 attractors. A1, A2 and A3, cell cycle arrest; D, cell death; R1 and R2, stress response; P1 and P2, proliferation.
DISCUSSION
Specific positive feedback loops contribute to heterogeneity within GC
Our work suggests that two mechanisms can contribute to the heterogeneous phenotypes of GC cells. First, the nonlinear biochemical interactions among endogenous factors formed two kinds of PFLs, Sox2-Shh and Gastrin-Wnt/β-catenin-Cdx2, that generate and maintain the gastric and intestinal types of GC cells, respectively. The PFLs confer stability and robustness of heterogeneous phenotypes upon perturbations. For example, Helicobacter pylori is a strong stimuli of inducing intestinal transformation of gastric epithelial cells [86]. Following H. pylori eradiation in patients, intestinal-type epithelial cells do not readily revert because these intestinalized cells may be maintained by PFLs activated by the stimulation of H. pylori. Without exogenous stimulation, the PFLs are still activated.
In addition, some experiments have indicated that the knockdown, knockout or overexpression of critical components of positive feedback loops change cell phenotypes. For example, the Shh mutant mice have been shown to exhibit intestinal transformation of the gastric epithelium [87], which indicates that breaking the gastric-phenotype-related PFL Sox2-Shh changes the gastric phenotype. Moreover, ectopic Sox2 expression in the primitive gut has been shown to redirect the developmental fate of the intestinal epithelium toward a gastric-like phenotype [73], suggesting that the gastric-differentiation-related regulatory network may be activated by activating Sox2. This experimental result was also consistent with the modeling result that consistently activating Sox2 can activate Sox2-Shh PFL and then induce transformation of the intestinal-type attractor to gastric-type attractor (Supplementary Figure 3A).
As regards the intestinal-differentiation-related Cdx2-Wnt/β-catenin-gastrin feedback loops, there are evidences indicating that H. pylori can deregulate Wnt/β-catenin signal [88], induce Cdx2 expression and inhibit Sox2 expression in gastric epithelial cells [35]. These studies indicate that H. pylori infiltration may activate intestinal-differentiation-related PFL and inhibit gastric-differentiation-related PFL of GC cells, thus inducing the intestinal transformation of the gastric epithelium. These are consistent with our modeling results, which also indicated that the gastric-type attractor can be transformed to the intestinal-type attractor by consistently activating the Wnt/β-catenin or Cdx2 and inhibiting the Sox2 simultaneously (Supplementary Figure 3B). Additionally, frequent somatic mutations of the APC and β-catenin genes were found only in intestinal-type GC [89]. Increased β-catenin mRNA levels were also significantly more frequently occurring in intestinal-type GC compared to the diffuse-type GC [90]. These studies indicate that abnormal activation of the intestinal-differentiation-related PFL via genetic mutation and aberrant expression of related proteins may be the cause of the intestinal transformation of the gastric epithelium.
The working model also indicated that perturbation of cancer related PFLs can influence the cancer-like phenotype. The modeling results showed that persistently inhibiting phosphatidylinositol 3-kinase (PI3K)/Akt activity induce the switch of GC cell attractors to cell-cycle-arrest and apoptosis-like attractor (Supplementary Figure 6), indicating that PI3K/Akt is a critical component of cancer-related PFLs and persistently inhibiting the PI3K/Akt signaling pathway may increase the susceptibility of cancer cells to apoptosis. Intriguingly, using PI3K/Akt pathway inhibitors in gastric cancer cell lines caused cell cycle arrest, enhanced sensitivity to apoptosis and attenuated the chemotherapeutic resistance of GC cells [91–94].
Different transition routes contribute to heterogeneity within GC
The properties of the nonlinear dynamic system revealed that the transition between normal gastric epithelial cell attractor and GC cell attractors can occur along no fewer than 16 transition routes characterized by the dynamic behaviors of individual key molecular components, thereby suggesting that the GC cells progression routes are heterogeneous. The working model identified that the normal gastric epithelial cell attractor A1 needs to go through at least one intermediate attractor to arrive at the GC cell attractors P1 or P2. For example, A1 may go through attractor R1 to arrive at P1, but A1 may also go through R1 and then R2 to arrive at P1. Moreover, in some cases, more than one saddle point was found between two attractors, which indicated that there were different transition routes or mechanisms between two attractors. Thus, there were 16 total different potential transition routes from the normal gastric epithelial cell attractor A1 to the GC cell attractor P1 or P2 were found.
The 16 transition routes of GC cell progression can be classified into 4 patterns according to the dynamic behaviors of individual key molecular components. One pattern of GC cell progression was found consistent with the pathogenic process of intestinal-type GC. Pelayo Correa proposed that intestinal-type GC passes through a sequence precancerous lesions including inflammation, atrophy, intestinal metaplasia (IM) and dysplasia [27, 29]. The expression levels of some key molecules of intestinal-type GC at different carcinogenesis stages were studied. For example, Cdx2 expression was activated in cells of IM, dysplasia and intestinal-type GC [95], whereas the gastric transcriptional factor Sox2 was down regulated in IM cells and intestinal-type GC cells [37, 96]. Moreover, the cytoplasmic and nuclear accumulation of β-catenin could be observed in premalignant lesions (atrophic gastritis and IM) [97], and increased β-catenin mRNA levels and mutational alterations of the APC and β-catenin gene are present in intestinal-type GC [90]. These independent clinical trajectory data were consistent with our modeling predictions and corresponded to one dynamic pattern of key molecules during intestinal-type GC cell progression (Figure 7D).
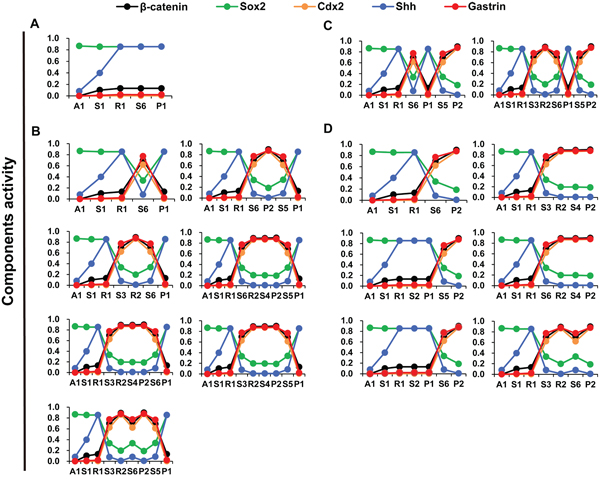
Figure 7: Dynamics of differentiation components in the routes of GC progression. A–D. shows components activity dynamics in 16 possible inherent evolutional routes from normal gastric epithelial cell attractor A1 to GC cell attractors P1 and P2. The dynamic process of certain critical regulators exhibit 4 major patterns of GC progression: A–D. A1, A2 and A3, cell cycle arrest; D, cell death; R1 and R2, stress response; P1 and P2, proliferation; S1–S14, saddle points.
The routes also showed that activation of Cdx2 and β-catenin may not occur in the intermediate attractor R during intestinal-type GC cell progression, suggesting that IM may be not a necessary step for intestinal-type GC cell progression (Figure 7D). By contrast, diffuse-type GC arises without identifiable IM precursor lesions. Interestingly, some experiments have shown that diffuse-type GC includes both gastric- and intestinal-type GC cells, which suggested that IM might be independent with induction of intestinal-type GC cells [33]. Further experiments are required to validate this prediction.
The working model also predicted three other patterns of GC cell progression. For example, the gastrin-Wnt/β-catenin-Cdx2 PFL may not activate during some GC cells progressions (Figure 7A). Moreover, GC cells may switch between gastric- (P1) and intestinal-type (P2) attractors (Figure 7B and 7C), suggesting that under proper perturbation, intestinal-type GC cells may transform into gastric-type GC cells, and vice versa. In addition, because gastric epithelial cells may stay in different GC attractors, intermediate attractors or saddle points during GC cell progression, whole cancer tissues may exhibit different proportions of heterogeneous cancer cells and precancerous cells among patients. To further validate these predictions and clarify the dynamic molecular process of GC cells, new technology and experiments at the cellular level are required.
The adaptive landscape is useful to graphically depict the dynamic system and transition between attractors [98]. Fluctuation/noise in gene expression or other cellular processes as well as transient environmental stimuli/exogenous factors may shift the cell state in a given landscape, causing changes in cellular phenotypes [11]. Phenotypic switch via stochastic fluctuation has been observed and modeled in prokaryotic [78, 99] and eukaryotic [100] systems. Although the dynamics of biochemical factors representing the endogenous network can be described via a set of stochastic differential equations [99, 101], recent progress allows us to ignore the stochastic effect during first step of studying cancer cell progression [102, 103]. For example, theoretically, adding a stochastic term will not influence the deterministic results, such as the attractors and the saddle points. Moreover, recent progress in dynamic stochastic systems has provided a methodology to constructing the adaptive landscape and quantitatively analyzing the transition process based endogenous molecular network [103, 104].
The endogenous molecular network hypothesis and current models of tumor heterogeneity
The endogenous molecular network includes both genetic information and biochemical interactions among endogenous factors. The nonlinear biochemical interactions among endogenous factors that establish particular structures, such as PFLs, generate and maintain heterogeneous tumor attractors. According to clonal evolution theory and CSC theory, three sources—genetic diversity, epigenetic modification, and the tumor microenvironment—contribute to tumor heterogeneity [10, 105]. It is affirmed that these three sources can be incorporated in the endogenous molecular network theory. Genetic mutation can be represented by removing or adding endogenous factors and the interactions among them to the endogenous network [39]. Epigenetic modification is commonly used to describe chromatin-based events, such as DNA methylation, histone modification, noncoding RNA and nucleosome location, which regulate DNA-templated processes, such ad gene expression [106]. Epigenetic variations are assumed to subtly enhance or weaken the interactions strengths of endogenous factors. For example, DNA methylation and histone modification may regulate gene expression via affect the kinetics of transcription-factor binding to DNA [107]. Microenvironmental stimuli correspond to the exogenous factors referenced in this article, which include biological, physical and chemical exogenous factors. Microenvironmental stimuli can directly or indirectly influence the endogenous network by causing genetic mutation and epigenetic variation and by activating/inhibiting signaling transduction or metabolic pathways. These three facets may strengthen or impair the loops that maintain distinct attractors. The CSC concept can also be discussed in the framework of endogenous networks and adaptive landscapes [38, 108]. The “CSC” and “non-CSC” phenotypes could serve as attractors in the endogenous network, and bidirectional conversion between the CSC and non-CSC phenotypes can occur under the control of endogenous and exogenous factors.
We can also explain some phenomena that are difficult to describe using current mechanisms posited for heterogeneity. For example, some studies have found that breast cancer adjacent cells are genetically divergent but phenotypically similar [18], which indicate that cells with different genetic mutations can exhibit similar phenotypes. On the other hand, in some cases, no critical mutations or epigenetic variations are found in cancer cells, despite their exhibiting cancer cell morphology and immunology [15–17]. Moreover, one study suggests that a small number of cells in patients with prolonged remissions of APL still harbor PML-RARα fusion genes but do not exhibit the APL phenotype [19]. These data suggest that cells with similar genetic mutations are nevertheless able to exhibit different phenotypes. According to our results, the working network generates attractors with different biological functions, which indicate that the same genome type with the same epigenetic modification and microenvironment can also generate heterogeneous cell phenotypes. Moreover, if the genetic mutation, epigenetic modification and microenvironment variation do not impair the feedback loops that maintain a specific phenotype in the network, they may only influence the stability of attractors; they do not cause attractors to disappear or induce cellular phenotype changes.
The endogenous molecular network and other literature based networks
Other cancer networks based on signaling-pathway and transcriptional-regulation databases have also been proposed. Small-scale networks, such as the p53 network [109], MAPK network [110] and death receptor-mediated signaling network [111], have been proposed to study detailed key pathways and their dynamic behaviors related to human cancer. These pathways and functional modules do not work independently to promote carcinogenesis; rather, they closely cooperate through signaling crosstalk, transcriptional regulation and other forms of feedback mechanisms [112].
Some large-scale cancer networks were also constructed by data mining of comprehensive databases [113, 114]. Wang et al. [115] provided a cancer hallmark network framework that combined a literature-based cellular signaling and transcriptional network and genome sequencing data to predict clinical phenotype and better design patient treatment. The literature-based data also has been used in our network modeling. Some differences between the cancer hallmark network framework and the endogenous molecular network theory nevertheless remains. First, the cancer hallmark network is an open-loop network that considers comprehensive signaling pathways and interactions. However, based on studies of feedback control of intercellular signalling and transcriptional network [18, 19], one assumption of the working model is that the endogenous network is an autonomous and closed-loop network. The closed-loop network introduces feedback on each node in the network: the process input has an effect on the process output; the output is fed back as input to the process, thereby closing the loop. Second, the PFL of the cancer hallmark network is the loop formed by mutual activation of the mutation network and the survival network. In contrast, the PFLs in the endogenous molecular network are the loops formed by the signaling pathways and transcriptional relations among endogenous factors. The endogenous molecular network also can consider mutation effects. Genetic mutation can be represented by removing or adding endogenous factors and interactions among them in the endogenous network [39], thereby attenuating the loops that maintain the normal phenotype and strengthening the loops that maintain the malignant phenotype in the network, which may then result in phenotype change.
Interestingly, the endogenous molecular network showed some consistency with the cancer hallmark network. For example, the two networks showed good agreement with respect to signaling pathways and functional modules, such as cell proliferation/cell cycle, cell death, angiogenesis, differentiation, EMT/cell adhesion and metabolism. Moreover, Wang proposed that the cancer hallmark network could be quantified by optimized network scoring functions and the nodes and links in network could be weighted. We are also trying to quantify the working network and transform it into a dynamic system. Our work provided a preliminary method to quantify the concentrations/activities of components and their interaction strengths in working network, and helped to integrate data to elucidate mechanism of intratumor heterogeneity.
In conclusion, we constructed an endogenous molecular network of GC that can be expanded in future and our work suggested that particular PFLs are responsible for producing and maintaining heterogeneous phenotypes of GC cells. Furthermore, we characterized different GC progression routes and corresponding dynamic behaviors of key molecular components. During cancer progression, cancer cells may follow different progression routes. Moreover, it is possible for cells in GC to stay in different cancer attractors or saddle points, indicating that they may manifest gastric and intestinal or even intermediate cancer phenotypes, respectively, a phenomenon that also contributes to intratumor heterogeneity. Our integrated approach combining the cooperative effects of signaling transduction and transcriptional interactions may broaden the mechanism of intratumor heterogeneity.
ACKNOWLEDGMENTS
We thank Ruoshi Yuan and Song Xu for helpful comments, and Bin Li, Shuang Tan and other members of the Systems Biology lab for helpful discussions. One of us (XMZ) thanks the hospitality of SCSB, which enabled the collaboration. This work was funded in part by the National 973 Project No. 2010CB529200 and the Natural Science Foundation of China No. NFSC91029738.
REFERENCES
1. Danielson KG, Anderson LW, Hosick HL. Selection and characterization in culture of mammary tumor cells with distinctive growth properties in vivo. Cancer Res. 1980; 40:1812–1819.
2. Dexter DL, Kowalski HM, Blazar BA, Fligiel Z, Vogel R, Heppner GH. Heterogeneity of tumor cells from a single mouse mammary tumor. Cancer Res. 1978; 38:3174–3181.
3. Raz A, McLellan WL, Hart IR, Bucana CD, Hoyer LC, Sela BA, Dragsten P, Fidler IJ. Cell surface properties of B16 melanoma variants with differing metastatic potential. Cancer Res. 1980; 40:1645–1651.
4. Heppner GH, Dexter DL, DeNucci T, Miller FR, Calabresi P. Heterogeneity in drug sensitivity among tumor cell subpopulations of a single mammary tumor. Cancer Res. 1978; 38:3758–3763.
5. Barranco SC, Ho DH, Drewinko B, Romsdahl MM, Humphrey RM. Differential sensitivites of human melanoma cells grown in vitro to arabinosylcytosine. Cancer Res. 1972; 32:2733–2736.
6. Gerlinger M, Rowan AJ, Horswell S, Larkin J, Endesfelder D, Gronroos E, Martinez P, Matthews N, Stewart A, Tarpey P, Varela I, Phillimore B, Begum S, McDonald NQ, Butler A, Jones D, et al. Intratumor heterogeneity and branched evolution revealed by multiregion sequencing. N Engl J Med. 2012; 366:883–892.
7. Turner NC, Reis-Filho JS. Genetic heterogeneity and cancer drug resistance. Lancet Oncol. 2012; 13:e178–185.
8. Nowell PC. The clonal evolution of tumor cell populations. Science. 1976; 194:23–28.
9. Reya T, Morrison SJ, Clarke MF, Weissman IL. Stem cells, cancer, and cancer stem cells. Nature. 2001; 414:105–111.
10. Lin Y, Devin A, Rodriguez Y, Liu ZG. Cleavage of the death domain kinase RIP by caspase-8 prompts TNF-induced apoptosis. Genes Dev. 1999; 13:2514–2526.
11. Marusyk A, Almendro V, Polyak K. Intra-tumour heterogeneity: a looking glass for cancer? Nat Rev Cancer. 2012; 12:323–334.
12. Burrell RA, McGranahan N, Bartek J, Swanton C. The causes and consequences of genetic heterogeneity in cancer evolution. Nature. 2013; 501:338–345.
13. Junttila MR, de Sauvage FJ. Influence of tumour micro-environment heterogeneity on therapeutic response. Nature. 2013; 501:346–354.
14. Hanahan D, Weinberg RA. Hallmarks of cancer: the next generation. Cell. 2011; 144:646–674.
15. Grimwade D, Biondi A, Mozziconacci MJ, Hagemeijer A, Berger R, Neat M, Howe K, Dastugue N, Jansen J, Radford-Weiss I, Lo Coco F, Lessard M, Hernandez JM, Delabesse E, Head D, Liso V, et al. Characterization of acute promyelocytic leukemia cases lacking the classic t(15,17): results of the European Working Party. Groupe Francais de Cytogenetique Hematologique, Groupe de Francais d’Hematologie Cellulaire, UK Cancer Cytogenetics Group and BIOMED 1 European Community-Concerted Action “Molecular Cytogenetic Diagnosis in Haematological Malignancies”. Blood. 2000; 96:1297–1308.
16. Duan Y, Nie J, Zhang Z, Zhou L, Zhu F, Zhang H, Zhu H, Shang W. A rare case with typical acute promyelocytic leukemia morphology associated with isolated isochromosome 17q without RARalpha rearrangement. Hematol Oncol Stem Cell Ther. 2013; 6:42–45.
17. Versteeg R. Cancer: Tumours outside the mutation box. Nature. 2014; 506:438–439.
18. McCarthy N. Tumour heterogeneity: the cancer kaleidoscope. Nat Rev Cancer. 2014; 14:151–152.
19. Tobal K, Saunders MJ, Grey MR, Yin JA. Persistence of RAR alpha-PML fusion mRNA detected by reverse transcriptase polymerase chain reaction in patients in long-term remission of acute promyelocytic leukaemia. Br J Haematol. 1995; 90:615–618.
20. McConnell MJ, Lindberg MR, Brennand KJ, Piper JC, Voet T, Cowing-Zitron C, Shumilina S, Lasken RS, Vermeesch JR, Hall IM, Gage FH. Mosaic copy number variation in human neurons. Science. 2013; 342:632–637.
21. Waddington CH. (1957). The strategy of the genes: a discussion of some aspects of theoretical biology: Allen & Unwin.
22. Kauffman SA. (1993). The Origins of Order: Self-organization and Selection in Evolution: Oxford University Press.
23. Ciliberti S, Martin OC, Wagner A. Innovation and robustness in complex regulatory gene networks. Proc Natl Acad Sci U S A. 2007; 104:13591–13596.
24. Huang S. Non-genetic heterogeneity of cells in development: more than just noise. Development. 2009; 136:3853–3862.
25. Wang G, Zhu X, Gu J and Ao P. Quantitative implementation of the endogenous molecular-cellular network hypothesis in hepatocellular carcinoma. Interface focus. 2014; 4:20130064.
26. Brenner H, Rothenbacher D, Arndt V. Epidemiology of stomach cancer. Methods Mol Biol. 2009; 472:467–477.
27. Hartgrink HH, Jansen EP, van Grieken NC, van de Velde CJ. Gastric cancer. Lancet. 2009; 374:477–490.
28. Ohuchi N, Hand PH, Merlo G, Fujita J, Mariani-Costantini R, Thor A, Nose M, Callahan R, Schlom J. Enhanced expression of c-Ha-ras p21 in human stomach adenocarcinomas defined by immunoassays using monoclonal antibodies and in situ hybridization. Cancer Res. 1987; 47:1413–1420.
29. Correa P. Human gastric carcinogenesis: a multistep and multifactorial process—First American Cancer Society Award Lecture on Cancer Epidemiology and Prevention. Cancer Res. 1992; 52:6735–6740.
30. Furihata C, Tatematsu M, Miki K, Katsuyama T, Sudo K, Miyagi N, Kubota T, Jin SS, Kodama K, Ito N, et al. Gastric- and intestinal-type properties of human gastric cancers transplanted into nude mice. Cancer Res. 1984; 44:727–733.
31. Fiocca R, Villani L, Tenti P, Solcia E, Cornaggia M, Frigerio B, Capella C. Characterization of four main cell types in gastric cancer: foveolar, mucopeptic, intestinal columnar and goblet cells. An histopathologic, histochemical and ultrastructural study of “early” and “advanced” tumours. Pathol Res Pract. 1987; 182:308–325.
32. Tatematsu M, Ichinose M, Miki K, Hasegawa R, Kato T, Ito N. Gastric and intestinal phenotypic expression of human stomach cancers as revealed by pepsinogen immunohistochemistry and mucin histochemistry. Acta Pathol Jpn. 1990; 40:494–504.
33. Tatematsu M, Tsukamoto T, Inada K. Stem cells and gastric cancer: role of gastric and intestinal mixed intestinal metaplasia. Cancer Sci. 2003; 94:135–141.
34. Barros R, Freund JN, David L, Almeida R. Gastric intestinal metaplasia revisited: function and regulation of CDX2. Trends Mol Med. 2012; 18:555–563.
35. Camilo V, Barros R, Sousa S, Magalhaes AM, Lopes T, Mario Santos A, Pereira T, Figueiredo C, David L, Almeida R. Helicobacter pylori and the BMP pathway regulate CDX2 and SOX2 expression in gastric cells. Carcinogenesis. 2012; 33:1985–1992.
36. Shiotani A, Kamada T, Yamanaka Y, Manabe N, Kusunoki H, Hata J, Haruma K. Sonic hedgehog and CDX2 expression in the stomach. J Gastroenterol Hepatol. 2008; 23:S161–166.
37. Tsukamoto T, Inada K, Tanaka H, Mizoshita T, Mihara M, Ushijima T, Yamamura Y, Nakamura S, Tatematsu M. Down-regulation of a gastric transcription factor, Sox2, and ectopic expression of intestinal homeobox genes, Cdx1 and Cdx2: inverse correlation during progression from gastric/intestinal-mixed to complete intestinal metaplasia. J Cancer Res Clin Oncol. 2004; 130:135–145.
38. Ao P, Galas D, Hood L, Zhu X. Cancer as robust intrinsic state of endogenous molecular-cellular network shaped by evolution. Medical hypotheses. 2008; 70:678–684.
39. Wang GW, Zhu XM, Hood L, Ao P. From Phage lambda to human cancer: endogenous molecular-cellular network hypothesis. Quantitative Biology. 2013; 1.
40. Weinberg RA. (2007). The Biology of Cancer: Garland Science.
41. Wu WK, Cho CH, Lee CW, Fan D, Wu K, Yu J, Sung JJ. Dysregulation of cellular signaling in gastric cancer. Cancer Lett. 2010; 295:144–153.
42. Wang T, Fox J and Giraud A. (2009). The Biology of Gastric Cancers: Springer.
43. Ottini L, Falchetti M and Nesi G. (2012). Gene Signatures in Gastric Cancer. In: Russo A, Iacobelli S and Iovanna J, eds. Diagnostic, Prognostic and Therapeutic Value of Gene Signatures: Humana Press, pp. 95–113.
44. Freeman M. Feedback control of intercellular signalling in development. Nature. 2000; 408:313–319.
45. Kitano H. Biological robustness. Nature reviews Genetics. 2004; 5:826–837.
46. Lee L, Yin L, Zhu X, Ao P. Generic enzymatic rate equation under living conditions. J Biol Syst. 2007; 15:495–514.
47. Zhang Y, Fujita N, Tsuruo T. Caspase-mediated cleavage of p21Waf1/Cip1 converts cancer cells from growth arrest to undergoing apoptosis. Oncogene. 1999; 18:1131–1138.
48. Ao P, Galas D, Hood L, Yin L, Zhu XM. Towards predictive stochastic dynamical modeling of cancer genesis and progression. Interdiscip Sci. 2010; 2:140–144.
49. Shea MA, Ackers GK. The OR control system of bacteriophage lambda. A physical-chemical model for gene regulation. J Mol Biol. 1985; 181:211–230.
50. Krumsiek J, Polsterl S, Wittmann DM, Theis FJ. Odefy—from discrete to continuous models. BMC bioinformatics. 2010; 11:233.
51. Ferrell JE, Jr., Ha SH. Ultrasensitivity part I: Michaelian responses and zero-order ultrasensitivity. Trends Biochem Sci. 2014; 39:496–503.
52. Hill AV. The possible effects of the aggregation of the molecules of hæmoglobin on its dissociation curves. The Journal of Physiology. 1910; 40:i–vii.
53. Nash P, Tang X, Orlicky S, Chen Q, Gertler FB, Mendenhall MD, Sicheri F, Pawson T, Tyers M. Multisite phosphorylation of a CDK inhibitor sets a threshold for the onset of DNA replication. Nature. 2001; 414:514–521.
54. Yasuda R, Harvey CD, Zhong H, Sobczyk A, van Aelst L, Svoboda K. Supersensitive Ras activation in dendrites and spines revealed by two-photon fluorescence lifetime imaging. Nat Neurosci. 2006; 9:283–291.
55. Sprinzak D, Lakhanpal A, Lebon L, Santat LA, Fontes ME, Anderson GA, Garcia-Ojalvo J, Elowitz MB. Cis-interactions between Notch and Delta generate mutually exclusive signalling states. Nature. 2010; 465:86–90.
56. Barkai N, Leibler S. Robustness in simple biochemical networks. Nature. 1997; 387:913–917.
57. Yi TM, Huang Y, Simon MI, Doyle J. Robust perfect adaptation in bacterial chemotaxis through integral feedback control. Proc Natl Acad Sci U S A. 2000; 97:4649–4653.
58. Alon U, Surette MG, Barkai N, Leibler S. Robustness in bacterial chemotaxis. Nature. 1999; 397:168–171.
59. Eldar A, Dorfman R, Weiss D, Ashe H, Shilo BZ, Barkai N. Robustness of the BMP morphogen gradient in Drosophila embryonic patterning. Nature. 2002; 419:304–308.
60. Pe’er D, Hacohen N. Principles and strategies for developing network models in cancer. Cell. 2011; 144:864–873.
61. Ruland J. Return to homeostasis: downregulation of NF-kappaB responses. Nat Immunol. 2011; 12:709–714.
62. Loven J, Orlando DA, Sigova AA, Lin CY, Rahl PB, Burge CB, Levens DL, Lee TI, Young RA. Revisiting global gene expression analysis. Cell. 2012; 151:476–482.
63. Angeli D, Ferrell JE Jr., Sontag ED. Detection of multistability, bifurcations, and hysteresis in a large class of biological positive-feedback systems. Proc Natl Acad Sci U S A. 2004; 101:1822–1827.
64. Ingolia NT, Murray AW. Positive-feedback loops as a flexible biological module. Curr Biol. 2007; 17:668–677.
65. Lemmon MA, Schlessinger J. Cell signaling by receptor tyrosine kinases. Cell. 2010; 141:1117–1134.
66. Avraham R, Yarden Y. Feedback regulation of EGFR signalling: decision making by early and delayed loops. Nat Rev Mol Cell Biol. 2011; 12:104–117.
67. Korkaya H, Liu S, Wicha MS. Regulation of cancer stem cells by cytokine networks: attacking cancer’s inflammatory roots. Clin Cancer Res. 2011; 17:6125–6129.
68. Oeckinghaus A, Hayden MS, Ghosh S. Crosstalk in NF-kappaB signaling pathways. Nat Immunol. 2011; 12:695–708.
69. Helin K. Regulation of cell proliferation by the E2F transcription factors. Curr Opin Genet Dev. 1998; 8:28–35.
70. Bertoli C, Skotheim JM, de Bruin RA. Control of cell cycle transcription during G1 and S phases. Nat Rev Mol Cell Biol. 2013; 14:518–528.
71. Sarkar A, Hochedlinger K. The sox family of transcription factors: versatile regulators of stem and progenitor cell fate. Cell Stem Cell. 2013; 12:15–30.
72. Watson SA, Grabowska AM, El-Zaatari M, Takhar A. Gastrin - active participant or bystander in gastric carcinogenesis? Nat Rev Cancer. 2006; 6:936–946.
73. Raghoebir L, Bakker ER, Mills JC, Swagemakers S, Kempen MB, Munck AB, Driegen S, Meijer D, Grosveld F, Tibboel D, Smits R, Rottier RJ. SOX2 redirects the developmental fate of the intestinal epithelium toward a premature gastric phenotype. J Mol Cell Biol. 2012; 4:377–385.
74. Tani Y, Akiyama Y, Fukamachi H, Yanagihara K, Yuasa Y. Transcription factor SOX2 up-regulates stomach-specific pepsinogen A gene expression. J Cancer Res Clin Oncol. 2007; 133:263–269.
75. Park ET, Gum JR, Kakar S, Kwon SW, Deng G, Kim YS. Aberrant expression of SOX2 upregulates MUC5AC gastric foveolar mucin in mucinous cancers of the colorectum and related lesions. Int J Cancer. 2008; 122:1253–1260.
76. Stepan V, Ramamoorthy S, Nitsche H, Zavros Y, Merchant JL, Todisco A. Regulation and function of the sonic hedgehog signal transduction pathway in isolated gastric parietal cells. J Biol Chem. 2005; 280:15700–15708.
77. Silberg DG, Swain GP, Suh ER, Traber PG. Cdx1 and cdx2 expression during intestinal development. Gastroenterology. 2000; 119:961–971.
78. van der Flier LG, Clevers H. Stem cells, self-renewal, and differentiation in the intestinal epithelium. Annu Rev Physiol. 2009; 71:241–260.
79. Bai YQ, Yamamoto H, Akiyama Y, Tanaka H, Takizawa T, Koike M, Kenji Yagi O, Saitoh K, Takeshita K, Iwai T, Yuasa Y. Ectopic expression of homeodomain protein CDX2 in intestinal metaplasia and carcinomas of the stomach. Cancer Lett. 2002; 176:47–55.
80. Ogasawara N, Tsukamoto T, Mizoshita T, Inada K, Cao X, Takenaka Y, Joh T, Tatematsu M. Mutations and nuclear accumulation of beta-catenin correlate with intestinal phenotypic expression in human gastric cancer. Histopathology. 2006; 49:612–621.
81. Yoo NJ, Kim HS, Kim SY, Park WS, Kim SH, Lee JY, Lee SH. Stomach cancer highly expresses both initiator and effector caspases; an immunohistochemical study. APMIS: acta pathologica, microbiologica, et immunologica Scandinavica. 2002; 110:825–832.
82. Radulescu S, Ridgway RA, Cordero J, Athineos D, Salgueiro P, Poulsom R, Neumann J, Jung A, Patel S, Woodgett J, Barker N, Pritchard DM, Oien K, Sansom OJ. Acute WNT signalling activation perturbs differentiation within the adult stomach and rapidly leads to tumour formation. Oncogene. 2013; 32:2048–2057.
83. Trotta L, Bullinger E, Sepulchre R. Global analysis of dynamical decision-making models through local computation around the hidden saddle. PLoS One. 2012; 7:e33110.
84. Stock M, Otto F. Gene deregulation in gastric cancer. Gene. 2005; 360:1–19.
85. Carneiro F, Seixas M, Sobrinho-Simoes M. New elements for an updated classification of the carcinomas of the stomach. Pathol Res Pract. 1995; 191:571–584.
86. Coskun M, Troelsen JT, Nielsen OH. The role of CDX2 in intestinal homeostasis and inflammation. Biochim Biophys Acta. 2011; 1812:283–289.
87. Ramalho-Santos M, Melton DA, McMahon AP. Hedgehog signals regulate multiple aspects of gastrointestinal development. Development. 2000; 127:2763–2772.
88. Murata-Kamiya N, Kurashima Y, Teishikata Y, Yamahashi Y, Saito Y, Higashi H, Aburatani H, Akiyama T, Peek RM Jr., Azuma T, Hatakeyama M. Helicobacter pylori CagA interacts with E-cadherin and deregulates the beta-catenin signal that promotes intestinal transdifferentiation in gastric epithelial cells. Oncogene. 2007; 26:4617–4626.
89. Park WS, Oh RR, Park JY, Lee SH, Shin MS, Kim YS, Kim SY, Lee HK, Kim PJ, Oh ST, Yoo NJ, Lee JY. Frequent somatic mutations of the beta-catenin gene in intestinal-type gastric cancer. Cancer Res. 1999; 59:4257–4260.
90. Ebert MP, Fei G, Kahmann S, Muller O, Yu J, Sung JJ, Malfertheiner P. Increased beta-catenin mRNA levels and mutational alterations of the APC and beta-catenin gene are present in intestinal-type gastric cancer. Carcinogenesis. 2002; 23:87–91.
91. Osaki M, Kase S, Adachi K, Takeda A, Hashimoto K, Ito H. Inhibition of the PI3K-Akt signaling pathway enhances the sensitivity of Fas-mediated apoptosis in human gastric carcinoma cell line, MKN-45. J Cancer Res Clin Oncol. 2004; 130:8–14.
92. Chao X, Zao J, Xiao-Yi G, Li-Jun M, Tao S. Blocking of PI3K/AKT induces apoptosis by its effect on NF-kappaB activity in gastric carcinoma cell line SGC7901. Biomedicine & pharmacotherapy = Biomedecine & pharmacotherapie. 2010; 64:600–604.
93. Yu HG, Ai YW, Yu LL, Zhou XD, Liu J, Li JH, Xu XM, Liu S, Chen J, Liu F, Qi YL, Deng Q, Cao J, Liu SQ, Luo HS, Yu JP. Phosphoinositide 3-kinase/Akt pathway plays an important role in chemoresistance of gastric cancer cells against etoposide and doxorubicin induced cell death. Int J Cancer. 2008; 122:433–443.
94. Wang WQ, Zhang H, Wang HB, Sun YG, Peng ZH, Zhou G, Yang SM, Wang RQ, Fang DC. Programmed cell death 4 (PDCD4) enhances the sensitivity of gastric cancer cells to TRAIL-induced apoptosis by inhibiting the PI3K/Akt signaling pathway. Molecular diagnosis & therapy. 2010; 14:155–161.
95. Kang JM, Lee BH, Kim N, Lee HS, Lee HE, Park JH, Kim JS, Jung HC, Song IS. CDX1 and CDX2 expression in intestinal metaplasia, dysplasia and gastric cancer. Journal of Korean medical science. 2011; 26:647–653.
96. Tsukamoto T, Mizoshita T, Mihara M, Tanaka H, Takenaka Y, Yamamura Y, Nakamura S, Ushijima T, Tatematsu M. Sox2 expression in human stomach adenocarcinomas with gastric and gastric-and-intestinal-mixed phenotypes. Histopathology. 2005; 46:649–658.
97. Cheng XX, Sun Y, Chen XY, Zhang KL, Kong QY, Liu J, Li H. Frequent translocalization of beta-catenin in gastric cancers and its relevance to tumor progression. Oncol Rep. 2004; 11:1201–1207.
98. Ao P. Global view of bionetwork dynamics: adaptive landscape. J Genet Genomics. 2009; 36:63–73.
99. Zhu XM, Yin L, Hood L, Ao P. Calculating biological behaviors of epigenetic states in the phage lambda life cycle. Funct Integr Genomics. 2004; 4:188–195.
100. Gupta PB, Fillmore CM, Jiang G, Shapira SD, Tao K, Kuperwasser C, Lander ES. Stochastic state transitions give rise to phenotypic equilibrium in populations of cancer cells. Cell. 2011; 146:633–644.
101. Blache P, van de Wetering M, Duluc I, Domon C, Berta P, Freund JN, Clevers H, Jay P. SOX9 is an intestine crypt transcription factor, is regulated by the Wnt pathway, and represses the CDX2 and MUC2 genes. J Cell Biol. 2004; 166:37–47.
102. Ao P. Potential in stochastic differential equations: novel construction. Journal of physics A: mathematical and general. 2004; 37:L25.
103. Ao P, Kwon C, Qian H. On the existence of potential landscape in the evolution of complex systems. Complexity. 2007; 12:19–27.
104. Wang J, Zhang K, Xu L, Wang E. Quantifying the Waddington landscape and biological paths for development and differentiation. Proc Natl Acad Sci U S A. 2011; 108:8257–8262.
105. Kreso A, Dick JE. Evolution of the cancer stem cell model. Cell Stem Cell. 2014; 14:275–291.
106. Dawson MA, Kouzarides T. Cancer epigenetics: from mechanism to therapy. Cell. 2012; 150:12–27.
107. Sasai M, Kawabata Y, Makishi K, Itoh K, Terada TP. Time scales in epigenetic dynamics and phenotypic heterogeneity of embryonic stem cells. PLoS computational biology. 2013; 9:e1003380.
108. Huang S. On the intrinsic inevitability of cancer: from foetal to fatal attraction. Semin Cancer Biol. 2011; 21:183–199.
109. Choi M, Shi J, Jung SH, Chen X, Cho KH. Attractor landscape analysis reveals feedback loops in the p53 network that control the cellular response to DNA damage. Sci Signal. 2012; 5:ra83.
110. Grieco L, Calzone L, Bernard-Pierrot I, Radvanyi F, Kahn-Perles B, Thieffry D. Integrative modelling of the influence of MAPK network on cancer cell fate decision. PLoS Comput Biol. 2013; 9:e1003286.
111. Calzone L, Tournier L, Fourquet S, Thieffry D, Zhivotovsky B, Barillot E, Zinovyev A. Mathematical modelling of cell-fate decision in response to death receptor engagement. PLoS computational biology. 2010; 6:e1000702.
112. Edelman LB, Eddy JA, Price ND. In silico models of cancer. Wiley interdisciplinary reviews Systems biology and medicine. 2010; 2:438–459.
113. Cui Q, Ma Y, Jaramillo M, Bari H, Awan A, Yang S, Zhang S, Liu L, Lu M, O’Connor-McCourt M, Purisima EO, Wang E. A map of human cancer signaling. Molecular systems biology. 2007; 3:152.
114. Wu G, Feng X, Stein L. A human functional protein interaction network and its application to cancer data analysis. Genome Biol. 2010; 11:R53.
115. Wang E, Zaman N, McGee S, Milanese J, Masoudi-Nejad A, O’Connor-McCourt M. Predictive genomics: A cancer hallmark network framework for predicting tumor clinical phenotypes using genome sequencing data. Semin Cancer Biol. 2015; 30C:4–12.