
INTRODUCTION
Urinary bladder urothelial carcinoma (UBUC) is a common malignant disease with preferences for developed countries [1]. Environmental and genetic factors impact in its development [2–4]. Clinicopathological features including histological grade, stage, size and multiplicity are associated with its progression [5]. Despite improvements in surgical techniques and multimodal therapy, 5-year survival rates for patients with muscle-invasive UBUC remain suboptimal. Almost 50% of patients eventually progress and develop systemic disease [6]. Clinical and genetic heterogeneity observed in UBUC patients further complicates the use of general therapies [7]. One current and future strategy to improve existing treatment outcomes is to identify involving biological molecules for targeted therapies. Cell cycle dysregulation resulting in uncontrolled cell proliferation has been associated with UBUC development [8, 9]. Thus targeting a critical transcription factor to restore its function is a rational approach for UBUC treatments [10].
Genistein is believed to be a potent anticancer agent and has been shown to prevent carcinogenesis in animal models for tumor development at different organ sites [11]. Our previous study using suppression subtractive hybridization approach identified that genistein induced epithelial membrane protein 2 (EMP2) mRNA in UBUC-derived RT4 cells. High EMP2 immunointensity was recognized as a prognostic indicator for patients with upper tract urothelial carcinoma (UTUC), possibly via suppression of cell proliferation [12]. Relative to primary UBUC, UTUC is uncommon [13], with notable differences at the genetic, molecular and clinical levels [14–16]. Due to the functions of EMP2 on UBUC and the underlying regulatory mechanisms remained elucidative, we performed data mining targeting the Gene Ontology (GO) with biological process of cell proliferation (GO:0008283) in the Gene Expression Omnibus (GEO, NCBI) database. Of 14 candidate transcripts, only downregulation of EMP2 significantly predicts inferior overall survival (Supplementary Table S1, Figure S1), suggesting that EMP2 plays a potential tumor suppressor role in UBUC.
Human EMP2 mapped to chromosome 16, is highly conserved across vertebrates [17, 18]. The expression pattern of EMP2 partially overlaps to that of the peripheral myelin protein 22 transcript (PMP22, also known as arrest-specific-3, GAS3). By containing the claudin domain and sharing approximately 40 amino acid identity with PMP22/GAS3 [19], EMP2 protein was detected as a novel member of this tetraspan transmembrane superfamily [20]. In humans, EMP2 protein has a discrete cell type and tissue distribution, with high levels observed in the lung and moderate levels in the eye, heart, thyroid and intestine [21, 22]. Results from our previous study [12], data mining and the fact that membrane proteins belong to the largest class of drug targets [23], prompted us to systematically analyze the relevance of EMP2 immunointensity and clinicopathological features in UBUC patients. Biological functions and a potential transcription factor of EMP2 were also studied using three UBUC-derived cell lines, RT4, TSGH8301 and J82.
RESULTS
Data mining identified that EMP2 transcript is frequently downregulated in high pT status patients with UBUC
To identify potential candidates related to the development of UBUC, we performed data mining. From the transcriptomic profiles of 93 UBUCs deposited in GEO dataset, 714 probes covering 317 transcripts which associated with the biological process of cell proliferation (GO:0008283) were found. The log2 ratios of 14 transcripts met the selection criteria of log2 ratio < −1.0-fold (p < 0.001; Supplementary Table S1, Figure S1). Of these, the downregulation of EMP2 transcript significantly predicts inferior overall survival (p = 0.0385). Therefore, EMP2 might play a tumor suppressor role in UBUC.
Alternations of EMP2 levels affected cell cycle distribution, cell viability, cell proliferation and colony formation via regulation of G2/M checkpoints in UBUC-derived cells
The EMP2 mRNA and protein levels are notably higher expressed in HUC and RT4 than those in TSGH8301 and J82 cells (Supplementary Figure S2). Therefore, J82 and RT4 cells, respectively, were used for overexpression and knockdown of the EMP2 gene for functional studies in vitro. Immunoblotting, flow cytometric, MTT, BrdU and soft agar colony formation (anchorage-independent cell growth) assays demonstrated that exogenous expression of EMP2 in J82 cells stably expressed EMP2-GFP fusion protein, induced G2/M cell cycle arrest (p < 0.05), suppressed cell viability (p < 0.01), cell proliferation (p < 0.01) and colony formation/anchorage-independent cell growth (p < 0.05; see also Supplementary Figure S3A) via upregulation of WEE1 G2 checkpoint kinase (WEE1), cyclin-dependent kinase 1 (CDK1), CDK1(phospho-Y15) [pCDK1(Y15)] and downregulation of cell division cycle 25C(phospho-S216) [pCDC25C(S216)] (Figure 1A–1H). Conversely, as shown in Figure 1I–1N, stable knockdown of EMP2 gene in RT4 cells inhibited EMP2 mRNA (p < 0.001) and protein (p < 0.01) levels, induced cell cycle progression to G0/G1 (p < 0.05) and S (p < 0.01) phases, increased cell viability (p < 0.01), cell proliferation (p < 0.001) and colony formation/anchorage-independent cell growth (p < 0.01; see also Supplementary Figure S3B). These results suggested that EMP2 suppresses cell proliferation and cell cycle progression through regulation of G2/M checkpoints in distinct UBUC-derived cells.
Genistein upregulates cAMP responsive element binding protein 1 and subsequently transactivates EMP2 in vitro
To further identify any transcription factor that might regulate EMP2 expression, phylogenetic footprinting was performed. Two putative cAMP responsive elements (CREs) in the EMP2 proximal promoter region were identified, denoted as CRE1 and CRE2 (Figure 2A). Exogenous expression of cAMP responsive element binding protein 1 (CREB1) in J82 cells notably upregulated CREB1, pCREB1(S133), EMP2 protein and EMP2 mRNA (p < 0.001) levels (Figure 2B, 2C). Stable overexpression of CREB1 gene (p < 0.001) or genistein treatments (10 μg/mL) for 24 h (p < 0.001) and 48 h (p < 0.001) in J82 cells, significantly induced G2/M cell cycle arrest (Figure 2D, 2E). In contrast, stable knockdown of CREB1 gene in RT4 cells downregulated CREB1 (p < 0.001) and EMP2 (p < 0.001) mRNA (Figure 2F); CREB1, pCREB1(S133) and EMP2 protein (Figure 2G) levels. Further, genistein treatments for 24 and 48 h notably induced CREB1, pCREB1(S133) and EMP2 protein abundance in J82 cells (Figure 2H). ChIP assay confirmed that pCREB1(S133) protein interacts with both CRE1 and CRE2 in the EMP2 proximal promoter region, while IgG did not (Figure 2I). Single, double mutations at CRE1 and/or CRE2 were next created (Figure 2J), and a dual luciferase assay additionally demonstrated that the EMP2 promoter activity decreased when either single mutation (pGL3-C/mCRE1 or pGL3-C/mCRE2) was introduced (p < 0.001), compared to those with pGL3-C plasmid (wild type). The promoter activity of EMP2 gene was further diminished when double mutations (pGL3-C/dmCREs) were incorporated, compared to either single mutant (p < 0.05) (Figure 2K). Exogenous expression of the CREB1 gene in both TSGH8301 and J82 cell lines, with low endogenous EMP2 levels, elevated pGL3-C activity (Figure 2L). Genistein increased pGL3-C activity (p < 0.05); however, it did not stimulate the promoter activity when double mutations were introduced (pGL3-C/dmCREs) in J82 cells (Figure 2M). Therefore, genistein induced EMP2 transcription via upregulation of CREB1 mRNA, CREB1 and pCREB1(S133) protein levels, as well as enhancement of the interaction between pCREB1(S133) and CREs on the EMP2 proximal promoter region.
Downregulation of EMP2 confers worse outcomes in UBUC patients
As shown in Figure 3A, EMP2 mRNA was higher expressed in low-stage (Ta-T1) than high-stage (T2–4) UBUC patients (p = 0.002). Higher EMP2, CREB1 and pCREB1(S133) immunointensities were also identified in well-differentiated tumors, compared to those of poorly-differentiated ones (Figure 3B). Correlations between EMP2, CREB1 or pCREB1(S133) immunointensity and various clinicopathological factors are listed in Table 1. Univariate log-rank analysis identified that pT, nodal status, histological grade, vascular invasion, perineurial invasion, mitotic activity and EMP2 immunointensity were significantly correlated with disease-specific survival (DSS) and metastasis-free survival (MFS) in UBUC patients (Table 2). Kaplan-Meier plots revealed that low EMP2 immunointensity predicted worse DSS (p < 0.000) and MFS (p = 0.006) (Figure 3C, 3D). Multivariate analysis additionally demonstrated that pT and EMP2 immunointensity significantly correlate to DSS; pT, mitotic activity, and nodal status considerably correlated with MFS (Table 3).
Genistein inhibited tumor growth in vivo
To elucidate whether genistein inhibits tumor growth in vivo, the mouse xenograft model was used. Approximately 30 day after cell injection, tumors grew into ~100 mm3. Treatment with genistein twice a week directly in tumors notably suppressed tumor growth (p < 0.001), compared to the PBS control group (Figure 4A, 4B), suggesting that genistein inhibited cell growth in vivo. Immunohistochemistry further showed that genistein noticeably induced CREB1, pCREB1(S133) and EMP2 protein levels in xenografts (Figure 4C).
Knockdown of EMP2 and/or CREB1 enhanced tumor growth in vivo
The mouse xenograft model was also used to evaluate whether knockdown of EMP2 and double knockdown of CREB1 and EMP2 affected tumor growth in vivo. In RT4 cells, both stable knockdown of EMP2 gene (shEMP2#1), and double knockdown of CREB1 and EMP2 genes (shCREB1#3 & shEMP2#1) inhibited EMP2 mRNA (p < 0.05; p < 0.01) and protein levels, compared to the control group (Figure 5A). In NOD/SCID mice, xenografts with EMP2 stable knocked down RT4 cells showed larger tumors, compared to the control group (*, p < 0.05). Double knockdown of CREB1 and EMP2 genes exhibited larger tumors, compared to the EMP2 knockdown group (#, p < 0.05; Figure 5B, 5C). Immunohistochemistry further demonstrated that stable knockdown of EMP2 gene suppressed EMP2 protein levels, compared to the controls (shLuc). Double knockdown of CREB1 and EMP2 genes downregulated CREB1 and EMP2 immunointensities, compared to knockdown of EMP2 gene alone (Figure 5D).
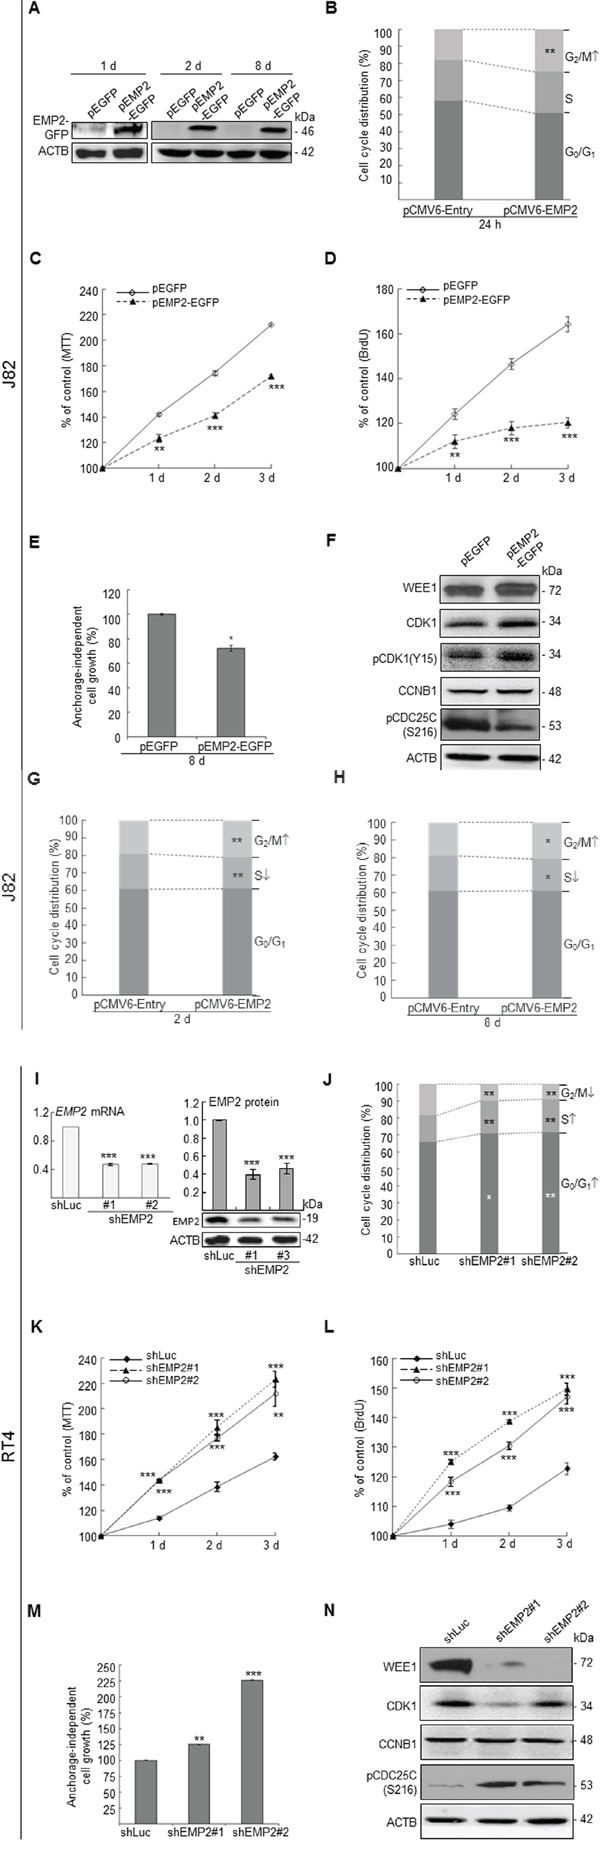
Figure 1: In vitro assay demonstrated that the EMP2 gene playa a tumor suppressor role in UBUC-derived cells. Immunoblotting, quantitative RT-PCR, flow cytometric, 3-(4,5-dimethylthiazol-2-yl)-2,5-diphenyltetrazolium bromide (MTT), 5-bromo-2′-deoxyuridine (BrdU) and soft agar assays along with transfection of pEMP2-EGFP in J82 cells exhibited that stably exogenous EMP2 expression induced (A) EMP2-GFP protein levels, (B) G2/M cell cycle arrest; however, suppressed (C) cell viability, (D) cell proliferation, and (E) anchorage-independent cell growth via upregulation of WEE1, CDK1, pCDK1(Y15) and downregulation of pCDC25C(S216) protein levels (F). Stable overexpression of the EMP2 gene for 2 d (G) and 8 d (H) induced G2/M cell cycle arrest as well. On the other hand, stable knockdown of the EMP2 gene in RT4 cells (I) suppressed EMP2 mRNA and EMP2 protein levels, induced (J) cell cycle progression to G0/G1 and S phases, (K) cell viability, (L) cell proliferation, (M) anchorage-independent cell growth via downregulation of WEE1, CDK1 and upregulation of pCDC25C(S216) protein levels (N). All experiments were triplicated and results are expressed as mean ± SEM. For immunoblotting analysis, one representative image is shown (A, F, I & N). Statistical significance: *, p < 0.05; **, p < 0.01 and ***, p < 0.001.
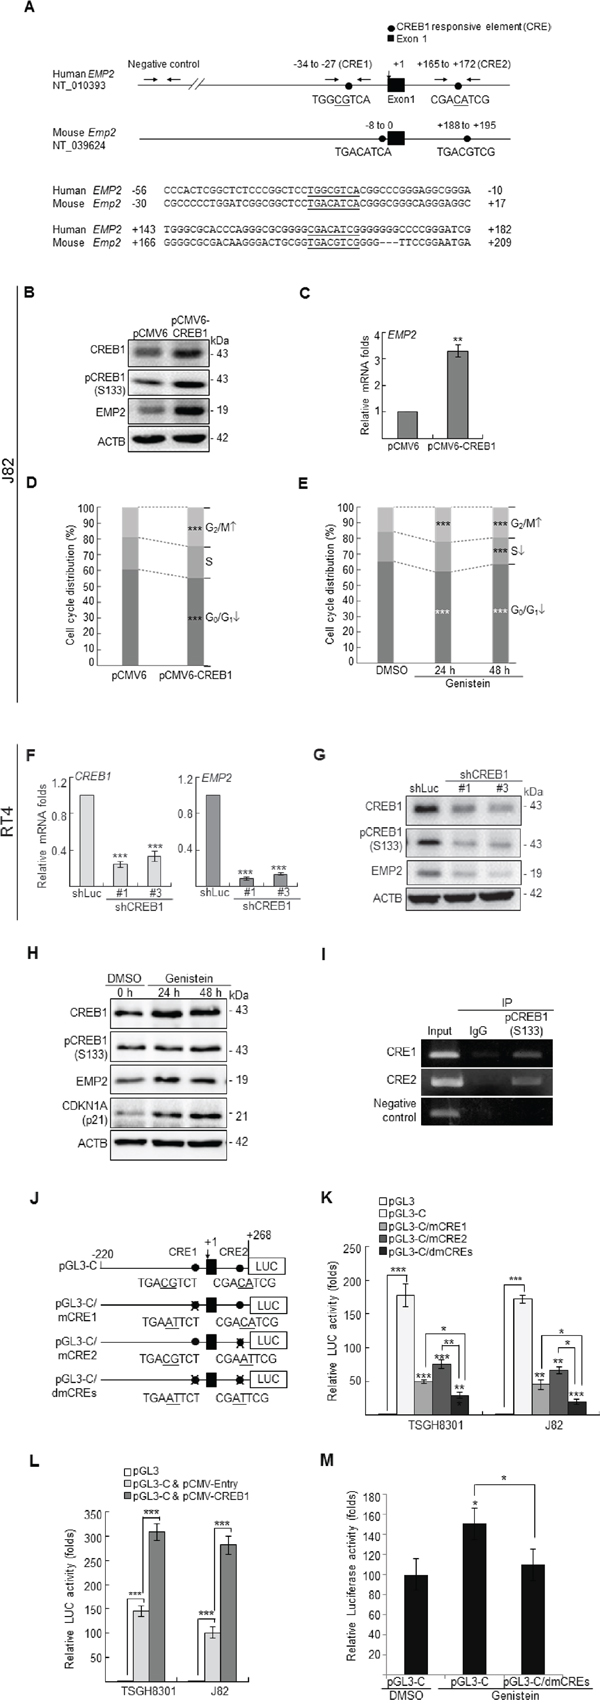
Figure 2: Genistein upregulated CREB1 and pCREB1(S133) protein levels, and pCREB1(Ser133) transactivates EMP2 gene in UBUC-derived cells. (A) Phylogenetic footprinting identified two conserved CREB1-responsive elements (CRE1 & CRE2) in the proximal promoter region of human EMP2 and mouse Emp2 orthologs, the first nucleotide of exon 1 was defined as +1. In J82 cells, transfection of the pCMV-CREB1 plasmid notably induced (B) CREB1, pCREB1(S133) and EMP2 protein, and (C) EMP2 mRNA levels. (D, E) Both stably transfection pCMV-CREB1 plasmid and genistein treatments induced G2/M cell cycle arrest in J82 cells. (F, G) Conversely, stable transfection of shRNAi plasmids targeting CREB1 gene suppressed CREB1 and EMP2 mRNA, and CREB1, pCREB1(S133) and EMP2 protein levels in RT4 cells. (H) In J82 cells, genistein treatments (10 μg/mL in DMSO) for 24 and 48 h notably induced CREB1, pCREB1(S133) and EMP2 protein levels. CDKN1A is a well-known target for genistein, was applied as a positive control. (I) Chromatin immunoprecipitation (IP) assay further confirmed that pCREB1(S133) protein interacts with both potential CREs; IgG was served as a negative control. (J) One DNA fragment (–220 to +268) containing two CREs of the EMP2 proximal promoter region was cloned into pGL3 reporter vector, designated as pGL3-C. Site-directed mutagenesis (underlined) at CRE1 (pGL3-C/mCRE1), CRE2 (pGL3-C/mCRE2) and double mutagenesis at both CREs (pGL3-C/dmCREs) were also cloned into the pCL3 reporter vector. (K) In TGSH8301 and J82 cell lines with lower endogenous EMP2 levels, dual luciferase assays demonstrated that transfection of pGL3-C increased promoter activities, compared to those transfections with the pGL3 control. However, the promoter activities were decreased after transfection of pGL3-C/mCRE1, pGL3-C/mCRE2 or pGL3-C/dmCREs plasmid for 24 h, compared to those transfections with the pGL3-C control. The promoter activity was further diminished after transfection of the pGL3-C/dmCREs plasmid, compared to those of transfection with either plasmid with single mutation, pGL3-C/mCRE1 or pGL3-C/mCRE2. (L) Transfection of pCMV-CREB1 for 24 h increased the pGL3-C promoter activity, compared to those of transfection with pCMV-Entry plasmid in both TSGH8301 and J82 cell lines. (M) In J82 cells, treatment with genistein (10 μg/mL in DMSO) increased the activity of pGL3-C, compared to the control (pGL3). However, genistein did not alter the promoter activity with double mutations in CREs (pGL3-C/dmCREs). All experiments were triplicated and results are expressed as mean ± SEM. For immunoblotting analysis, one representative image is shown (B, G, H). Statistical significance: *, p < 0.05; **, p < 0.01 and ***, p < 0.001.
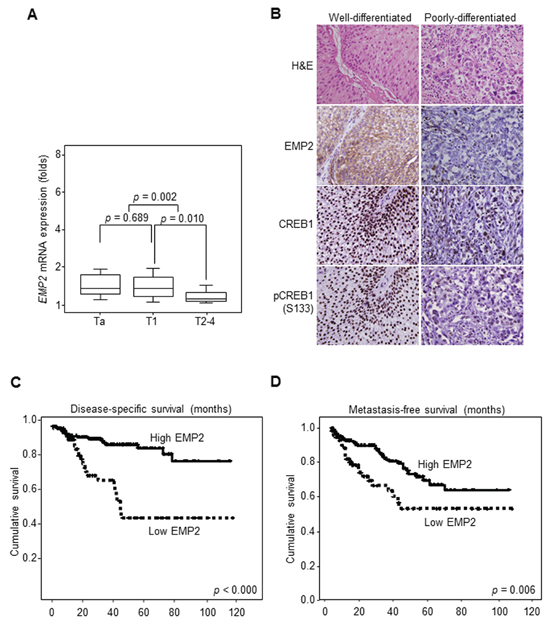
Figure 3: Downregulation of EMP2 immunointensity confers poor disease-specific survival (DSS) and metastasis-free survival (MFS) in UBUC patients. (A) Quantitative RT-PCR demonstrated that EMP2 mRNA levels were lower expressed in UBUC patients with high primary tumor stage (pT2-T4) than those with low stages (Ta-T1). (B) High EMP2 immunointensity in the representative poorly-differentiated, compared to that of well-differentiated UBUC specimen. Similarly, loss of CREB1 and pCREB1(S133) immunointensities were identified in poorly-differentiated tumors. (C, D) Kaplan-Meier curves plotted that high EMP2 protein level predicted superior DDS and MFS.
Table 1: Correlation between EMP2, CREB1 and pCREB1(S133) expression level (labeling index: LI) and various clinicopathological factors
Parameters |
Case |
EMP2 LI |
p value |
CREB1 LI |
p value |
pCREB1(S133) LI |
p value |
Gender |
0.551 |
0.889 |
0.722 |
||||
Male |
177 |
53.00 ± 4.24 |
95.31 ± 1.14 |
74.38 ± 2.72 |
|||
Female |
65 |
55.20 ± 2.63 |
95.01 ± 0.68 |
70.45 ± 2.03 |
|||
Age (years) |
0.607 |
0.325 |
0.459 |
||||
< 60 |
70 |
53.43 ± 4.15 |
95.79 ± 0.62 |
70.36 ± 3.02 |
|||
≥ 60 |
172 |
55.09 ± 2.65 |
94.80 ± 0.78 |
71.98 ± 2.00 |
|||
Primary tumor (pT) |
< 0.001* |
0.392 |
< 0.001* |
||||
Ta |
73 |
75.07 ± 3.19 |
96.64 ± 0.44 |
78.97 ± 2.35 |
|||
T1 |
73 |
56.58 ± 3.94 |
95.89 ± 0.80 |
78.29 ± 2.48 |
|||
T2-T4 |
96 |
37.55 ± 3.25 |
93.28 ± 1.29 |
60.68 ± 2.96 |
|||
Nodal status (N) |
0.012* |
0.101 |
0.031* |
||||
N0 |
220 |
56.41 ± 2.32 |
95.38 ± 0.56 |
72.75 ± 1.68 |
|||
N1-N2 |
22 |
38.59 ± 7.05 |
92.27 ± 3.12 |
59.09 ± 6.49 |
|||
Histological grade |
< 0.001* |
0.152 |
0.045* |
||||
Low |
45 |
74.00 ± 3.90 |
97.22 ± 0.47 |
80.67 ± 2.18 |
|||
High |
197 |
50.18 ± 2.49 |
94.59 ± 0.71 |
69.42 ± 1.94 |
|||
Vascular invasion |
< 0.001* |
0.027* |
< 0.001* |
||||
Absent |
202 |
58.51 ± 2.38 |
95.82 ± 0.53 |
74.98 ± 1.68 |
|||
Present |
40 |
34.88 ± 5.13 |
91.38 ± 2.23 |
54.00 ± 4.63 |
|||
Perineurial invasion |
0.083 |
0.059 |
0.141 |
||||
Absent |
225 |
55.47 ± 2.31 |
95.33 ± 0.59 |
70.09 ± 1.71 |
|||
Present |
17 |
43.23 ± 8.35 |
91.76 ± 3.00 |
63.82 ± 6.48 |
|||
Mitotic activity (10 high power fields) |
242 |
r = −0.343 |
< 0.001* |
r = −0.008 |
0.888 |
r = −0.128 |
0.047* |
Tumor necrosis |
0.074 |
0.916 |
0.532 |
||||
Absent |
153 |
57.55 ± 2.77 |
95.03 ± 0.72 |
70.03 ± 2.19 |
|||
Present |
89 |
49.55 ± 3.71 |
95.17 ± 1.01 |
74.04 ± 2.47 |
|||
EMP2 (LI) |
242 |
r = 0.253 |
< 0.001* |
r = 0.487 |
< 0.001* |
||
pCREB1(S133) (LI) |
242 |
r = 0.538 |
< 0.001* |
*statistically significant
Table 2: Univariate log-rank analyses
Parameters |
Disease-specific survival |
Metastasis-free survival |
|||
Case |
Event |
p value |
Event |
p value |
|
Gender |
0.9560 |
0.4970 |
|||
Male |
177 |
30 |
47 |
||
Female |
65 |
10 |
13 |
||
Age (years) |
0.2493 |
0.9305 |
|||
< 60 |
70 |
9 |
18 |
||
≥ 60 |
172 |
31 |
42 |
||
Primary tumor (T) |
< 0.0001* |
< 0.0001* |
|||
Ta |
73 |
1 |
4 |
||
T1 |
73 |
8 |
18 |
||
T2–4 |
96 |
31 |
38 |
||
Nodal status (N) |
0.0042* |
< 0.0001* |
|||
N0 |
220 |
33 |
49 |
||
N1–2 |
20 |
7 |
11 |
||
Histological grade |
0.0061* |
0.0019* |
|||
Low |
45 |
2 |
4 |
||
High |
197 |
38 |
56 |
||
Vascular invasion |
0.0170* |
0.0012* |
|||
Absent |
202 |
29 |
43 |
||
Present |
40 |
11 |
17 |
||
Perineurial invasion |
0.0219* |
0.0041* |
|||
Absent |
225 |
35 |
58 |
||
Present |
17 |
5 |
2 |
||
Mitotic activity (10 high power fields) |
0.0002* |
0.0003* |
|||
Low (< 10) |
113 |
10 |
19 |
||
High (≥ 10) |
129 |
30 |
41 |
||
Tumor necrosis |
0.6036 |
0.9119 |
|||
Absent |
153 |
25 |
39 |
||
Present |
89 |
15 |
21 |
||
EMP2 Labeling index (LI) |
< 0.0001* |
0.0059* |
|||
Intact (2+–4+) |
171 |
17 |
36 |
||
Loss (0–1+) |
71 |
23 |
24 |
||
CREB LI |
0.3198 |
0.0963 |
|||
High (4+) |
106 |
15 |
21 |
||
Low (0–3+) |
136 |
25 |
39 |
||
pCREB1(S133) LI |
0.0523 |
0.7274 |
|||
High (4+) |
106 |
27 |
27 |
||
Low (0–3+) |
136 |
13 |
33 |
||
*Statistically significant
Table 3: Multivariate analysis for disease-specific and metastasis-free survivals
Parameter |
Disease-specific survival |
Metastasis-free survival |
||||
Hazard ratio |
95% CI1 |
P value |
Hazard ratio |
95% CI1 |
P value |
|
Primary tumor (pT) |
||||||
Ta |
1 |
- |
0.0054* |
1 |
- |
0.0123* |
T1 |
7.246 |
0.724–72.533 |
4.258 |
1.148–15.790 |
||
T2–4 |
19.622 |
2.072–182.055 |
5.632 |
1.534–20.679 |
||
EMP2 labeling index |
- |
|||||
High expression (> 20) |
1 |
- |
0.0492* |
1 |
- |
0.5982 |
Low expression (≤ 20) |
1.970 |
1.002–3.870 |
1.190 |
0.684–2.071 |
||
Mitotic activity |
||||||
Low (< 10 per 10 high power fields) |
1 |
- |
0.0528 |
1 |
- |
0.0344* |
High (≥ 10 per 10 high power fields) |
2.197 |
0.990–4.872 |
1.754 |
0.965–3.188 |
||
Vascular invasion |
||||||
Absent |
1 |
- |
0.3009 |
1 |
- |
0.9845 |
Present |
1.552 |
0.675–3.567 |
1.116 |
0.552–2.258 |
||
Perineurial invasion |
||||||
Absent |
1 |
- |
0.3552 |
1 |
- |
0.3483 |
Present |
1.648 |
0.571–4.753 |
1.493 |
0.648–3.441 |
||
Nodal status (N) |
||||||
N0 |
1 |
- |
0.3661 |
1 |
- |
0.0339* |
N1–2 |
1.493 |
0.626–3.558 |
2.282 |
1.109–4.695 |
||
Histological grade |
||||||
Low |
1 |
- |
0.7667 |
1 |
- |
0.5668 |
High |
1.289 |
0.241–6.913 |
0.966 |
0.269–3.464 |
||
1CI, confidence interval
*statistically significant
DISCUSSION
In this study, we found that a high EMP2 protein level could be an independent prognostic factor for DSS in UBUC patients, suggesting that loss of EMP2 expression plays a crucial role in the mortality of UBUC, similar to its role in nasopharyngeal carcinoma [24] and UTUC [12] observed in our earlier studies. Based on our unpublished cohort containing 60 UBUCs analyzed by Affymetrix® Human SNP Assay 6.0, the EMP2 locus is infrequently altered, suggesting the possibilities of epigenetic and/or transcriptional regulation of EMP2 gene (Supplementary Figure S4). Loss of EMP2 expression is common and has prognostic significance for DSS and local recurrence-free survival in an NPC cohort of 124 patients. The EMP2 protein was expressed more highly in the cytoplasm and/or membrane of squamous metaplasia and non-keratinizing NPCs than in undifferentiated cells [24]. Membranous expression of EMP2 in urothelial cells of the ureter and EMP2 downregulation results in inferior cancer-related survivals (n = 171) [12]. Except for epithelial cells, suppression subtractive hybridization has isolated the mouse ortholog Emp2, which suppresses B cell lymphoma tumorigenicity via a functional tumor suppressor phenotype [25]. Conversely, EMP2 was identified as an early predictor of endometrial cancers with unfavorable outcome by activation of protein tyrosine kinase 2 (PTK2 or FAK) and v-src avian sarcoma viral oncogene homolog (SRC) [26, 27]. The above ambiguities strongly suggested that EMP2 might have distinct characteristics depending on cellular context. Because EMP2 is a transmembrane protein, its downregulation might decrease the interactions with other proteins, including the membranous and nonmembranous in epithelial cells, and subsequently result in tumor progression in UBUC.
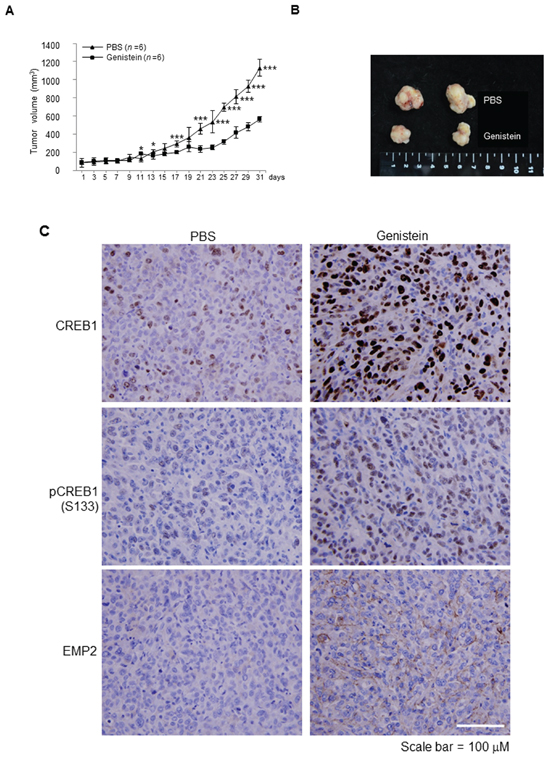
Figure 4: Genistein inhibited tumor growth in a NOD/SCID xenograft model. J82 cells (1 × 10⁷) were mixed with Matrigel and injected into flank sites of mice (n = 12). After the cells grew for 30 days, tumors (~ 100 mm3) were directly injected with genistein (0.2 mg; n = 6) or PBS (control; n = 6) twice per week for 31 days. (A) Treatment with genistein for 19 days notably inhibited tumor growth, compared to the control (PBS). (B) After sacrifice, tumors were dissected from animals and two representative tumors from each group are shown. (C) Immunohistochemistry showed that genistein treatments noticeably upregulated CREB1, pCREB1(S133) and EMP2 protein levels in vivo. Statistical significance: *, p < 0.05 and ***, p < 0.001.
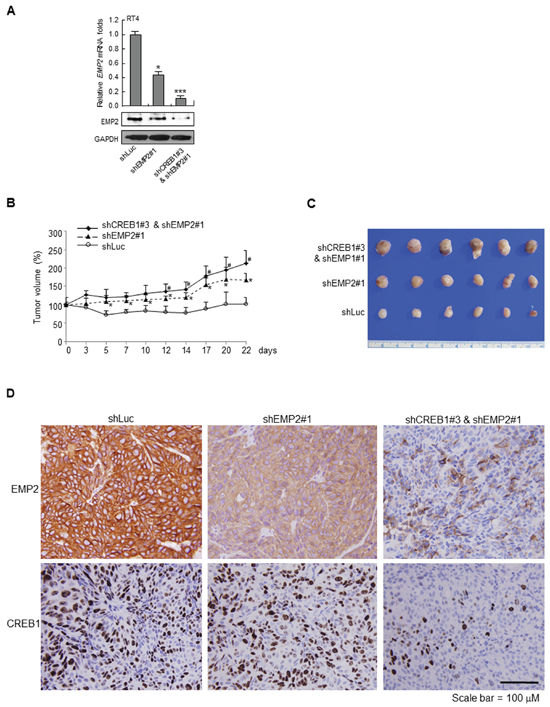
Figure 5: Stable knockdown of EMP2 gene and double knockdown of CREB1 and EMP2 genes enhanced tumor growth in NOD/SCID xenograft models. (A) The EMP2 mRNA and protein levels were downregulated after stable transfection of shEMP#1 and cotransfection of shCREB1#3 and shEMP2# plasmids into RT4 cells. Knockdown cells (5 × 10⁶) were mixed with Matrigel and injected into flank sites of mice (n = 6 for each group). (B) Stable knockdown of EMP2 gene (shEMP2#1) increased tumor growth, compared to the control group, shLuc (*, p < 0.05). Double knockdown of CREB1 and EMP2 genes (shCREB1#3 & shEMP2#1) further enhanced tumor growth, compared to the shEMP2#1 group (#, p < 0.05). (C) After sacrifice, tumors were dissected from animals and tumors from each group are shown. (D) Immunohistochemistry on xenograft tissues displayed that knockdown of EMP2 gene notably downregulated EMP2 protein level, however, double knockdown of CREB1 and EMP2 genes markedly downregulated both CREB1 and EMP2 protein levels.
In vitro studies, immunohistochemistry in tumor specimens, and correlation analyses in tissue specimens confirmed that genistein increased CREB1, pCREB1(S133) and EMP2 protein levels, and that the EMP2 was transactivated by pCREB1(S133). CREB1 is a kinase-inducible transcription factor. The activation of CREB1-dependent gene expression is depicted by two-state model, i.e., CREB1 is thought to bind constitutively to CREs. Upon stimulation of S133 phosphorylation, CREB binding protein (CREBBP) is recruited. The activity of CREBBP histone-acetyl transferase next relaxes the local chromatin, allowing the latent affinity of the Q2 domain of CREB1 for TAF4 RNA polymerase II, TATA box binding protein-associated factor, 135 kDa (TAF4) to stimulate the deposition of the RNA polymerase II initiation complex and start transcription [28]. A number of kinase signaling cascades converge on the phosphorylation of S133 in CREB1 [29] and differences in kinase kinetic can result in unique patterns of gene expression [30]. It is known that activation of CREB1 turns on the transcription of more than 5000 target genes, including proto-oncogenes, FBJ murine osteosarcoma viral oncogene homolog (FOS) [31], cell cycle regulatory genes, cyclin A1 [32] and cyclin D2 [33], and other genes related to growth and survival [28, 34]. On the other hand, pCREB1(S133), phosphorylated by protein kinase, AMP-activated, alpha 1 catalytic subunit (PRKAA1), has the ability to bind the canonical CRE in the promoter region subsequently transactivate tumor protein p53 (TP53) in response to glucose deprivation [35]. Moreover, it has been found that an histone deacetylase (HDAC) inhibitor, valproic acid, caused an increase in transcription of a DNA damage recognition gene, the xeroderma pigmentosum, complementation group C (XPC) via increasing binding of both CREB1 and SP1 transcription factors in both HTB4 and HTB9 UBUC-derived cell lines [36]. An early study also reported that genistein upregulated CREB1 and pCREB1(S133) protein levels in MCF7 cells [37]. All these suggested that target genes of the CREB1 transcription factor might be broader than what we currently appreciate. Importantly, results from in vitro analyses were generally reflective of observations from data mining, clinical associations and xenograft mice. There was no significant correlation between CREB1 or pCREB1(S133) protein level and DSS or MFS was found, signifying that EMP2 abundance rather than CREB1 or pCREB1(S133), plays a predominant role in the inhibition of UBUC progression.
We also identified that overexpression of EMP2 induced G2/M cell cycle arrest, decreased cell viability, proliferation and colony formation/anchorage-independent cell growth by distinct upregulation of WEE1, CDK1 and pCDK1(Y15), and downregulation of pCDC25C(S216) in J82 cells, and knowndown of EMP2 gene in RT4 exhibited the opposite results. EMP2 induced G2/M cell cycle arrest from day 1 to day 8, suggesting its strong effects on cell cycle regulation. Indeed, orderly progression of cells through the cell cycle is orchestrated by the sequential interaction and activation of CDKs existing in complexes with their cyclin substrates [38]. Conserved from yeast to mammals, mitosis is controlled by maturation-promoting factor (the CDK1/CCNB1 complex) [39], which is present in low level during interphase and peaks during mitotic progression [40]. In addition to the activation by cyclins, CDK1 activity can be negatively regulated by phosphorylation of two inhibitory residues, Y14 and Y15. The tyrosine kinase, WEE1, phosphorylates CDK1 at Y15 [41]. Alternatively, membrane-associated tyrosine/threonine 1 protein (PKMYT1) is a dual-specificity kinase that can phosphorylate both sites [42, 43], with a propensity toward Y14 [44]. These inhibitory phosphorylations are removed by CDC25 phosphatases [45]. Humans possess three CDC25 isoforms (CDC25A, B and C), that are overlapping and have unique roles [46]. During interphase growth and under DNA damage or stress, CDC25C is prevented from entering the nucleus (inactive) owing to S216 phosphorylation and interaction with tyrosine 3-monooxygenase/tryptophan 5-monooxygenase activation protein, theta (YWHAQ or 14–3-3) [40, 47, 48]. These findings reinforce our observations.
Altogether, we demonstrate low EMP2 protein levels in a subset of UBUCs with aggressive behaviors. In distinct UBUC-derived cell lines, EMP2 expression induces G2/M cell cycle arrest via regulation of G2/M checkpoints, WEE1, pCDK(Y15) and pCDC25C(S216), and subsequently decreases cell viability, proliferation and colony formation/anchorage-independent cell growth. Clinical associations, in vitro indications and xenograft mice serve as strong evidence that genistein inhibited tumor growth by upregulating CREB1 and pCREB1(S133) protein levels. The EMP2 gene is thereafter transactivated by pCREB(S133). Accordingly, downregulation of the EMP2 protein can be used as an adverse prognostic factor for inferior outcomes in UBUC patients.
MATERIALS AND METHODS
Data mining on the GEO database to identify downregulated transcripts in UBUCs
Data mining on the GEO database identified one dataset GSE31684, analysis on 93 UBUCs using GeneChip® Human Genome U133 Plus 2.0 Array [49]. To computerize the expression level, raw CEL files were imported into the Nexus Expression 3 software (BioDicovery) as described earlier [50], except for functional profiles were performed by focusing on transcripts with biological process of cell proliferation (GO:0008283). Those transcripts with p < 0.001 and log2-transformed fold change of expression > ± 1.0 were selected as candidates. To further identify the most critical transcript(s) related to UBUC progression, all probes targeting candidates were analyzed for their impacts on overall survival.
Cell culture and genistein treatment
Human normal urothelial cells (HUC; #4320, ScienCell Research) were obtained and cultured with recommended medium (#4321, ScienCell Research Laboratories) in the poly-L-lysine coated flask (2 μg/cm2). Human UBUC-derived cell lines, RT4, TSGH8301 (Food Industry Research and Development Institute, Hsinchu, Taiwan) and J82 (ATCC) were respectively maintained in McCoy’s 5A modified, RPMI-1640 and DMEM, with 10% (v/v) fetal bovine serum (Biological Industries), appropriate nutrients and antibiotics in a humidified incubator with 5% CO2 at 37°C. All media were obtained from CORNING. RT4, TSGH8301 and J82 cells were characterized as stage Ta [51], Ta [52] and T3 [53], respectively. Genistein (10 μg/mL, Sigma-Aldrich) was prepared in DMSO.
Quantitative RT-PCR
Quantitative RT-PCR assay was applied to quantify the expression levels of EMP2 and cAMP responsive element binding protein 1 (CREB1) transcripts using predesigned TaqMan® assay reagents [EMP2: Hs00171315_m1, 88 bp; CREB1: Hs00231713_m1, 75 bp; polymerase (RNA) II (DNA directed) polypeptide A (POLR2A): Hs00172187_m1, 61 bp, internal control), StepOnePlus™ Real-Time PCR System (Life Technologies) and ΔΔCT calculation. Briefly, total RNAs were extracted with TRIzol® reagent (Life Technologies) from cells and reverse-transcribed using the High Capacity cDNA Reverse Transcription kit (Life Technologies). The relative expression folds of EMP2 and CREB1 transcripts were given by 2-ΔΔCT, where ΔΔCT = ΔCT (RT4, TSGH8301 or J82, tumor specimen or transfected cell lines) – ΔCT (HUC, nontumor or control); ΔCT represented the CT of EMP2 or CREB1 subtracted from the CT of POLR2A for cell lines and/or tissue specimens. Only samples with CT value < 28 for POLR2A were considered to meet acceptable RNA quality standards and included in the analyses.
Immunoblotting analysis
Cell lysates were prepared with RadioImmuno Precipitation Assay buffer (Upstate). Lysates containing equal amounts of protein were separated by SDS-PAGE and electroblotted onto Immobilon™-P Transfer Membrane (Millipore). The filters were individually probed with specific primary antibody. Protein bands were detected by the Western Lightning Chemiluminescence Reagent Plus Kit (Perkin-Elmer Life Sciences) with horseradish peroxide labeled secondary antibody as suggested by the manufacturer and visualized on a VersaDoc Image System (Bio-Rad). The intensity of bands was quantified by densitometry and normalized to ACTB in each lane. Anti-human EMP2 (1:100, HPA014711, Sigma-Aldrich), anti-cyclin dependent kinase 1 (CDK1; 1:200, sc-54, Santa Cruz), anti-pCDK1(Y15) (1:250, BD Transduction Laboratories™), anti-WEE1 (1:1000, #4936, Cell Signaling), anti-CCNB1 (1:500, sc-245, Santa Cruz), anti-pCDC25C(S216) (1:1000, #4901, Cell Signaling) and anti-pCREB1(S133) (1:200, sc-7978, Santa Cruz) were used as primary antibodies for immunoblotting analysis and anti-ACTB (1:3000, Chemicon) was served as a loading control.
Expression plasmids and stable transfection
Primer sets, 5′-CTGGAATTCATGTTGGTCCTTCT TGCTTTC-3′ and 5′-TCAAGCTTCTTTGCGCTTCCTC AGTATCAG-3′, embracing Eco RI and Hind III sites (underlined), were used to amplify the EMP2 complete DNAs (NM_001424, NCBI). The PCR products were sequencing verified, gel purified, and subcloned into the pEGFP-N3 plasmid (#6080–1, Clontech) to generate the pEMP2-EGFP plasmid. The pCMV6-Entry (PS10001), pCMV6-EMP2 (RC201995) and pCMV6-CREB1 (RC210577) plasmids were obtained from OriGene Technologies. Cells (1 × 10⁶) were transfected with 2 μg of pEGFP-N3 (control), pEMP2-EGFP, pCMV or pCMV-CREB1 plasmid by mixing with 8 μL PolyJet™ reagent (SignaGen® Laboratories). Transfectants were selected with media containing 800 μg/mL of G418 (AMRESCO) for 7 d, and maintained in media with 400 μg/mL of G418 for subsequent experiments.
Lentivirus production and stable knockdown of the EMP2 and CREB1 genes
Small hairpin RNA interference (shRNAi) plasmids were inserted into the pLK0.1 vector downstream of the U6 promoter. Clones were obtained from the National RNAi Core Facility, Institute of Molecular Biology, Academia Sinica, Taipei, Taiwan. A total of 5 and 4 plasmids targeting EMP2 and CREB1 genes were preliminarily screened. The EMP2 and CREB1 mRNA levels could be effectively downregulated by only 2 and 2 clones, respectively. Plasmids shEMP2#1 (TRCN0000072386: 5′-CAACACGAATTGCACAGTCAT-3′), shEMP2#2 (TRCN0000072387: 5′-GTTTGTCCTAACCTCCAT CAT-3′), shCREB1#1 (TRCN0000011085: 5′-CAG TGGATAGTGTAACTGATT-3′) and shCREB1#3 (TRCN0000007309: 5′-GCAAACATTAACCATGACC AA-3) were used for knockdown of EMP2 and CREB1 genes and shLuc (TRCN0000072243:5′-CTTCGAAATGTCCGTTCGGTT-3)’ was used as a negative control clone. For stable shRNAi, lentiviral particles were produced. Briefly, Phoenix-AMPHO cells (ATCC) were seeded in 6-cm tissue culture plate at a density of 3 × 10⁶ in 5 mL medium with 10% FBS, 100 IU/mL penicillin and 100 μg/mL streptomycin (Corning®) overnight. PolyJet™ (15 μL, #SL100688, SignaGen® Laboratories) was used to transfect the plasmid mixture [psPAX2 (2.25 μg, Addgene), PMD2.G (0.25 μg, Addgene) and 2.5 μg of shLuc (control), shEMP2#1, shEMP2#2, shCREB1#1 and/or shCREB1#3 plasmids], and the medium was changed after a 16 h incubation. Medium was collected and filtered (0.22 μm) at 40 h and 64 h post-transfection, aliquots of 1 mL were stored at –80°C. RT4 cells (1 × 10⁶) were next infected with media containing lentiviral particles containing polybrene (8 μg/mL) and incubated for another 24 h at 37°C. Afterward, media containing 4 μg/mL puromycin (Sigma-Aldrich) were used to select positive cells for 7 d and subsequently maintained in media containing 2 μg/mL puromycin for further experiments.
Cell-cycle, cell viability, proliferation and soft agar assays
Flow cytometric, 3-(4, 5-Dimethylthiazol-2-yl)-2, 5-diphenyltetrazolium bromide (MTT), bromodeoxyuridine (BrdU) and soft agar assays were used to determine alternations of cell cycle distribution, cell viability, cell proliferation and colony formation/anchorage-independent cell growth after exogenous expression or knockdown of EMP2 and/or CREB1 genes in vitro. For cell cycle analysis, 1 × 10⁶ cells were collected, washed with ice-cold PBS, fixed with 70% ethanol and stored at –20°C after stable transfection of pCMV6-Entry, pCMV6-EMP2 or pCMV6-CREB1 plasmid, or infection with shEMP2#1, shEMP2#1, shCREB1#1, shCREB#3, shCREB1#3 and shEMP1#1, or shLuc lentiviral particles. Before analysis, fixed cells were washed with ice-cold PBS for three times and treatments with 200 μg/mL RNase A (#R6513, Sigma-Aldrich) and 20 μg/mL propidium iodide (#P4170, Sigma-Aldrich). A total of 10, 000 events were analyzed; cell cycle distribution was analyzed by a Beckman Coulter Epics XL Flow Cytometer and the Modfit LT™ software (BD Biosciences) [54].
To determine cell viability and proliferation upon alternation of EMP2 expression levels, 2 × 10³ and 3 × 10³ cells were seeded on 96-well microplates for MTT and BrdU assays, respectively. After removing the medium, 20 μL of MTT (5 mg/mL; Sigma-Aldrich) were added to each well and cells were incubated for another 4 h. At the end of incubation, the MTT solution was replaced by 100 μL of DMSO. On the other hand, BrdU Cell Proliferation Assay Kit (QIA58, Calbiochem) was used to perform cell proliferation test. BrdU label (1:2000 dilution) was incubated for 24 h. Plates were then washed, stained with anti-BrdU antibody, and peroxidase-conjugated goat anti-mouse IgG. 3, 3′, 5, 5′-tetramethylbenzidine substrate (0.1 mL in ethanol) was next added into the immunocomplex and the reaction was terminated via adding 100 μL of sulfuric acid (2.5 N). Absorbances were afterward measured at wavelengths of 570 and 490 nm for MTT and BrdU assays, correspondingly, using a Beckman Coulter PARADIGM™ Detection Platform. Percentages of viable cells (%) and proliferation rate (%) were calculated as 100 × [(ODindicated time after transfection – OD7d after transfection)/OD7d after transfection]. All experiments were triplicated and results are expressed as mean ± SEM.
CytoSelect™ 96-well in vitro tumor sensitivity assay (soft agar colony formation, CBA-150–5, CELL BIOLABS, INC) was used to analyze whether stable expression and knockdown of EMP2 affected anchorage-independent cell growth. Briefly, 50 μL/well (in a 96-well sterile flat-bottom microplate) of the Base Agar Matrix Layer was prepared by mixing 1.25 mL of 2X DMEM/20% FBS medium, 1 mL of sterile water, 0.25 mL of melted 10X CytoSelect™ Agar Matrix Solution. Cell Suspension/Agar Matrix Layer under sterile conditions (75 μL/well) was made by mixing 1.75 mL of 2X DMEM/20% FBS medium, 1.375 mL of CytoSelect™ Matrix Diluent, 0.375 mL of melted 10X CytoSelect™ Agar Matrix Solution and 0.25 mL of Cell Suspension (5 × 10³ cells), according to the manufactures’ instructions. The incubation periods were 8 days for both EMP2-overexpressed J82 and EMP2-knocked down RT4 cells. MTT assay was used to quantitate the anchorage-independent growth.
Chromatin immunoprecipitation
Cells were grown overnight in 100-mm dishes to ~60–70% confluency (5 × 10⁶), cross-linked with formaldehyde, harvested, and subsequently sonicated (SONICATOR® 3000, LLC) to obtain soluble chromatin (~500 bp). After dilution, the chromatin solutions were incubated with 5 μg of anti-pCREB1(S133) antibody or rabbit IgG (5 μg, non-specific control, #N101, Calbiochem), and satiated on a rotating platform at 4ºC overnight. Immunocomplexes were recovered with preblocked protein A-Sepharose beads (Life technologies) at 65ºC for 4 h. Samples were next digested with proteinase K (Sigma-Aldrich) for 1 h at 45ºC and the DNA from samples was obtained by phenol/chloroform extraction and ethanol precipitation. Primers spanning –34 to –27 (CRE1: 5′-CAAAGCTGGCCACAGAGC-3′; 5′-CTCCCTCCACCCTCTAGGC-3′) and +165 to +172 (CRE2: 5′-AGCCCAGAGCTTCAAAACAG-3′; 5′-CTGCTCCCGGTCCAGTAAGT-3′), residing on the EMP2 proximal promoter region and one negative control (5′-CTGCAGTGAGTCTGGGTTCA-3′; 5′-TGCT GAGGGCTTAGTGTGTG-3′) on ~33 Kb upstream of the EMP2 gene were used for ChIP PCR assay with an annealing temperature of 60ºC. Resultant amplicons were separated on 2%, 0.5X Tris/borate/EDTA agarose gels, stained with EtB”Out” nucleic acids staining solution (#FYD007, Yeastern), visualized and photographed with UV light.
Generation of reporter constructs and site-directed mutagenesis
Constructs with single- and double-mutant of CREs residing on the EMP2 proximal promoter region were performed using the QuickChange® Lightning Site-Directed Mutagenesis Kit (#210518, Agilent). All constructs were verified by sequencing. A plasmid (pGL3-C) containing 488 bp (–220 to +268) fragment of the EMP2 proximal promoter linked to the luciferase reporter gene was initially cloned into pGL3 vector (Promega) using primers 5′-CCGCTCGAGAGCCTCCCTTTCTCCCTTTTC-3′ and 5′-CCCAAGCTTCCCGTTACTGTCACCAATT-3′, with Xho I and Hind III sites (underlined). The plasmid was next used as a template for site-directed mutagenesis (shading) on CRE1 (primers: 5′-GCTCTCCCGGCTCCTGGATTCACGGCCCG GGAG GC-3′; 5′-GCCTCCCGGGCCGTGAATCCAGGA GC CGGGAGAGC-3′), and CRE2 (primers: 5′-CCCAG GGC GCGGGGCGACATCGGGGGGGCCCCG-3′; 5′-CGGGGCCCCCCCGATGTCGCCCCGC GCCCTGG G-3′) to construct pGL3-C/mCRE1 and pGL3-C/mCRE2 plasmids, respectively. Next, pGL3-C/mCRE1 was used as the template to generate the plasmid comprising CRE1/CRE2 double-mutant (pGL3-C/dmCREs; primers: 5′ -CAGGGCGCGGGGCGAATTCGGGGGG-3′; 5′ -CCCC CCGAATTCGCCCCGCGCCCTG-3′).
Patients and tumor materials
The institutional review board of Chi-Mei Medical Center approved retrospective retrieval of 242 primary UBUC with available tissue blocks (IRB10207–001), which underwent surgical treatment with curative intent between Jan. 1998 and May 2004. For immunohistochemical study and survival analysis, 242 consecutive patients with primary urinary bladder urothelial carcinoma were retrieved. These patients had received surgical resection with curative intent between 1998 and 2004; those who underwent palliative resection were excluded. Patients with confirmed or suspicion of lymph node metastasis received regional lymph node dissection. Cisplatin-based post-operative adjuvant chemotherapy was performed in those with pT3 or pT4 status or nodal involvement. The histological diagnosis of UBUC was confirmed in all cases based on the latest World Health Organization classification. Grading of histological was assigned based on Edmonson and Steiner’s criteria, while tumor staging was determined according to the 7th Edition of the American Joint Committee on Cancer system (AJCC). Medical charts were reviewed for each patient to ascertain the accuracy of other pertinent clinicopathological data. Follow-up information was available in all cases with a median period of 42 months (range 3–176 months).
Immunohistochemistry
Immunohistochemical staining was performed on representative tissue sections cut from formalin-fixed, paraffin-embedded tissues at 3-μm thickness as our previous study [24] with a few modifications. Slides were deparaffinized with xylene, rehydrated with ethanol, heated by microwave for retrieval of antigen epitopes in a 10 mM citrate buffer (pH 6) for 7 min. Endogenous peroxidase was quenched by 3% H2O2. Slides were washed with Tris buffered saline for 15 min and then incubated with a primary monoclonal antibody against EMP2 (1:20; HPA014711, Sigma-Aldrich), CREB1 (1:40, sc-186, Santa Cruz) and pCREB1(S133) (1:50, sc-7978, Santa Cruz), for 1 h, followed by antibody detection using a ChemMate EnVision™ kit (K5001; DAKO, Glostrup). Two pathologists (CF Li and HY Huang) blinded to clinicopathological information and patient outcomes, independently interpreted the immunostainings. The immunointensity was scored based on the extent of moderately to strongly-stained tumor cells exhibiting combined membranous and cytosolic (EMP2) or nuclear [CREB and pCREB(S133)] staining, and labeled as 0+, < 5%; 1+, ≥ 5%, but < 25%; 2+, ≥ 25%, but < 50%; 3+, ≥ 50%, but < 75%; and 4+, ≥ 75%, respectively. A specimen showing EMP2 staining less than 1+ was regarded as loss of EMP2 expression. For CREB1 and pCREB1(S133), 4+ staining were regarded as high expression.
Tumor xenograft and genistein treatment in vivo
Cells were implanted into 12 NOD/SCID mice by subcutaneous injection: 1 × 10⁷ J82 cells were resuspended in 100 μL PBS, mixed with 100 μL Matrigel (BD Biosciences) and introduced into the right flank of 7 week old, male mice. The tumor size reached ~100 mm3 about 30 days after implantation. Literally 2 μL of genistein (0.1 mg/μL in DMSO) dissolving in 198 μL of PBS (n = 6) or 2 μL of DMSO in 198 μL of PBS (control, n = 6) were injected into the tumor twice per week for 4.5 weeks. For xenograft with EMP2 knockdown; CREB1 and EMP2 double knockdown experiments, literally 5 × 10⁶ RT4 cells that were stably transfected with shEMP2#1 or shCREB1#3 plus shEMP2#1 were subcutaneously injected for 22 days before sacrifice. Tumor diameters were measured with a digital caliper every other day and the tumor volume in mm3 was calculated as volume = π/6(width)2 × length.
Statistics
All calculations were performed by SPSS 14.0 software. To determine the prognostic impact of selected transcripts identified in GSE31684, the deposited cases were subdivided into two clusters based on the expression level of each transcript, detected by a specific probe and computerized by k-means clustering (k = 2). The survival difference of the two clusters was next calculated by log-rank analysis and plotted by Kaplan-Meier method for overall survival. The association and comparison between various clinicopathological factors and EMP2, CREB1, pCREB1(S133) immunointensities were assessed by the Chi-square test. The endpoint analyzed for survival analysis was DSS and MFS. Student’s t-test was used to examine the significance of difference in fold changes of mRNA and protein levels; percentages of cell cycle distribution, cell viability, proliferation and anchorage-independent cell growth. For all analyses, two-sided tests of significance were used and a p value of < 0.05 was considered to be statistically significant.
ACKNOWLEDGMENTS
This work was supported by Ministry of Science and Technology, Taiwan (103–2314-B-110-001 to YL Shiue) and Ministry of Health and Welfare, Taiwan (MOHW104-TDU-B-212–124-003 to CF Li and WJ Wu). The authors acknowledge the High-throughput Genome Analysis Core Facility of National Core Facility Program for Biotechnology, Taiwan (102–2319-B-010–001) for DNA sequencing.
REFERENCES
1. Eble JN, Sauter G, Epstein JI, Sesterhenn IA. (2004). World Health Organization Classification fo Tumour. Pathology and Genetics of Tumours of the Urinary System and Male Genital Organs. Lyon: Interantional Agency for Research on Cancer (IARC) press 2004; pp. 93–109.
2. Reulen RC, Kellen E, Buntinx F, Brinkman M, Zeegers MP. A meta-analysis on the association between bladder cancer and occupation. Scandinavian journal of urology and nephrology Supplementum. 2008; 64–78.
3. Aben KK, Witjes JA, Schoenberg MP, Hulsbergen-van de Kaa C, Verbeek AL, Kiemeney LA. Familial aggregation of urothelial cell carcinoma. International journal of cancer Journal international du cancer. 2002; 98:274–278.
4. Lichtenstein P, Holm NV, Verkasalo PK, Iliadou A, Kaprio J, Koskenvuo M, Pukkala E, Skytthe A, Hemminki K. Environmental and heritable factors in the causation of cancer—analyses of cohorts of twins from Sweden, Denmark, and Finland. The New England journal of medicine. 2000; 343:78–85.
5. Hall RR, Parmar MK, Richards AB, Smith PH. Proposal for changes in cystoscopic follow up of patients with bladder cancer and adjuvant intravesical chemotherapy. BMJ (Clinical research ed). 1994; 308:257–260.
6. Shipley WU, Kaufman DS, Tester WJ, Pilepich MV, Sandler HM. Overview of bladder cancer trials in the Radiation Therapy Oncology Group. Cancer. 2003; 97:2115–2119.
7. Urbanowicz RJ, Andrew AS, Karagas MR, Moore JH. Role of genetic heterogeneity and epistasis in bladder cancer susceptibility and outcome: a learning classifier system approach. Journal of the American Medical Informatics Association : JAMIA. 2013; 20:603–612.
8. Mitra AP, Hansel DE, Cote RJ. Prognostic value of cell-cycle regulation biomarkers in bladder cancer. Semin Oncol. 2012; 39:524–533.
9. Volanis D, Papadopoulos G, Doumas K, Gkialas I, Delakas D. Molecular mechanisms in urinary bladder carcinogenesis. Journal of BUON : official journal of the Balkan Union of Oncology. 2011; 16:589–601.
10. Tang L, Zhang Y. Mitochondria are the primary target in isothiocyanate-induced apoptosis in human bladder cancer cells. Molecular cancer therapeutics. 2005; 4:1250–1259.
11. Dixon RA, Ferreira D. Genistein. Phytochemistry. 2002; 60:205–211.
12. Wang YW, Li WM, Wu WJ, Chai CY, Chang TY, Sun Y, Cheng CJ, Shiue YL, Su SJ, Cheng HL, Liu HS, Chow NH. Epithelial membrane protein 2 is a prognostic indictor for patients with urothelial carcinoma of the upper urinary tract. The American journal of pathology. 2013; 183:709–719.
13. Roupret M, Zigeuner R, Palou J, Boehle A, Kaasinen E, Sylvester R, Babjuk M, Oosterlinck W. European guidelines for the diagnosis and management of upper urinary tract urothelial cell carcinomas: update. European urology. 2011; 59:584–594.
14. Wu XR. Urothelial tumorigenesis: a tale of divergent pathways. Nat Rev Cancer. 2005; 5:713–725.
15. Wu XR. Biology of urothelial tumorigenesis: insights from genetically engineered mice. Cancer Metastasis Rev. 2009; 28:281–290.
16. Lughezzani G, Burger M, Margulis V, Matin SF, Novara G, Roupret M, Shariat SF, Wood CG, Zigeuner R. Prognostic factors in upper urinary tract urothelial carcinomas: a comprehensive review of the current literature. European urology. 2012; 62:100–114.
17. Ben-Porath I, Kozak CA, Benvenisty N. Chromosomal mapping of Tmp (Emp1), Xmp (Emp2), and Ymp (Emp3), genes encoding membrane proteins related to Pmp22. Genomics. 1998; 49:443–447.
18. Liehr T, Kuhlenbaumer G, Wulf P, Taylor V, Suter U, Van Broeckhoven C, Lupski JR, Claussen U, Rautenstrauss B. Regional localization of the human epithelial membrane protein genes 1, 2, and 3 (EMP1, EMP2, EMP3) to 12p12.3, 16p13.2, and 19q13.3. Genomics. 1999; 58:106–108.
19. Taylor V, Suter U. Epithelial membrane protein-2 and epithelial membrane protein-3: two novel members of the peripheral myelin protein 22 gene family. Gene. 1996; 175:115–120.
20. Berditchevski F, Odintsova E. Characterization of integrin-tetraspanin adhesion complexes: role of tetraspanins in integrin signaling. J Cell Biol. 1999; 146:477–492.
21. Jetten AM, Suter U. The peripheral myelin protein 22 and epithelial membrane protein family. Prog Nucleic Acid Res Mol Biol. 2000; 64:97–129.
22. Wadehra M, Sulur GG, Braun J, Gordon LK, Goodglick L. Epithelial membrane protein-2 is expressed in discrete anatomical regions of the eye. Exp Mol Pathol. 2003; 74:106–112.
23. Arinaminpathy Y, Khurana E, Engelman DM, Gerstein MB. Computational analysis of membrane proteins: the largest class of drug targets. Drug discovery today. 2009; 14:1130–1135.
24. Chen YL, Uen YH, Li CF, Horng KC, Chen LR, Wu WR, Tseng HY, Huang HY, Wu LC, Shiue YL. The E2F transcription factor 1 transactives stathmin 1 in hepatocellular carcinoma. Annals of surgical oncology. 2013; 20:4041–4054.
25. Wang CX, Wadehra M, Fisk BC, Goodglick L, Braun J. Epithelial membrane protein 2, a 4-transmembrane protein that suppresses B-cell lymphoma tumorigenicity. Blood. 2001; 97:3890–3895.
26. Wadehra M, Natarajan S, Seligson DB, Williams CJ, Hummer AJ, Hedvat C, Braun J, Soslow RA. Expression of epithelial membrane protein-2 is associated with endometrial adenocarcinoma of unfavorable outcome. Cancer. 2006; 107:90–98.
27. Fu M, Rao R, Sudhakar D, Hogue CP, Rutta Z, Morales S, Gordon LK, Braun J, Goodglick L, Wadehra M. Epithelial membrane protein-2 promotes endometrial tumor formation through activation of FAK and Src. PloS one. 2011; 6:e19945.
28. Mayr B, Montminy M. Transcriptional regulation by the phosphorylation-dependent factor CREB. Nature reviews Molecular cell biology. 2001; 2:599–609.
29. Johannessen M, Delghandi MP, Moens U. What turns CREB on? Cellular signalling. 2004; 16:1211–1227.
30. Mayr BM, Canettieri G, Montminy MR. Distinct effects of cAMP and mitogenic signals on CREB-binding protein recruitment impart specificity to target gene activation via CREB. Proceedings of the National Academy of Sciences of the United States of America. 2001; 98:10936–10941.
31. Ahn S, Olive M, Aggarwal S, Krylov D, Ginty DD, Vinson C. A dominant-negative inhibitor of CREB reveals that it is a general mediator of stimulus-dependent transcription of c-fos. Molecular and cellular biology. 1998; 18:967–977.
32. Desdouets C, Matesic G, Molina CA, Foulkes NS, Sassone-Corsi P, Brechot C, Sobczak-Thepot J. Cell cycle regulation of cyclin A gene expression by the cyclic AMP-responsive transcription factors CREB and CREM. Molecular and cellular biology. 1995; 15:3301–3309.
33. White PC, Shore AM, Clement M, McLaren J, Soeiro I, Lam EW, Brennan P. Regulation of cyclin D2 and the cyclin D2 promoter by protein kinase A and CREB in lymphocytes. Oncogene. 2006; 25:2170–2180.
34. Zhang X, Odom DT, Koo SH, Conkright MD, Canettieri G, Best J, Chen H, Jenner R, Herbolsheimer E, Jacobsen E, Kadam S, Ecker JR, Emerson B, Hogenesch JB, Unterman T, Young RA, et al. Genome-wide analysis of cAMP-response element binding protein occupancy, phosphorylation, and target gene activation in human tissues. Proceedings of the National Academy of Sciences of the United States of America. 2005; 102:4459–4464.
35. Okoshi R, Ando K, Suenaga Y, Sang M, Kubo N, Kizaki H, Nakagawara A, Ozaki T. Transcriptional regulation of tumor suppressor p53 by cAMP-responsive element-binding protein/AMP-activated protein kinase complex in response to glucose deprivation. Genes to cells : devoted to molecular & cellular mechanisms. 2009; 14:1429–1440.
36. Xu XS, Wang L, Abrams J, Wang G. Histone deacetylases (HDACs) in XPC gene silencing and bladder cancer. Journal of hematology & oncology. 2011; 4:17.
37. Seo HS, Choi HS, Choi HS, Choi YK, Um JY, Choi I, Shin YC, Ko SG. Phytoestrogens induce apoptosis via extrinsic pathway, inhibiting nuclear factor-kappaB signaling in HER2-overexpressing breast cancer cells. Anticancer research. 2011; 31:3301–3313.
38. Malumbres M, Barbacid M. Cell cycle kinases in cancer. Current opinion in genetics & development. 2007; 17:60–65.
39. Gautier J, Norbury C, Lohka M, Nurse P, Maller J. Purified maturation-promoting factor contains the product of a Xenopus homolog of the fission yeast cell cycle control gene cdc2+. Cell. 1988; 54:433–439.
40. Takizawa CG, Morgan DO. Control of mitosis by changes in the subcellular location of cyclin-B1-Cdk1 and Cdc25C. Curr Opin Cell Biol. 2000; 12:658–665.
41. Parker LL H. Inactivation of the p34cdc2-cyclin B complex by the human WEE1 tyrosine kinase. Science. 1992; 257:1955–1957.
42. Kornbluth S, Sebastian B, Hunter T, Newport J. Membrane localization of the kinase which phosphorylates p34cdc2 on threonine 14. Molecular biology of the cell. 1994; 5:273–282.
43. Mueller PR, Coleman TR, Kumagai A, Dunphy WG. Myt1: a membrane-associated inhibitory kinase that phosphorylates Cdc2 on both threonine-14 and tyrosine-15. Science. 1995; 270:86–90.
44. Liu F, Stanton JJ, Wu Z, Piwnica-Worms H. The human Myt1 kinase preferentially phosphorylates Cdc2 on threonine 14 and localizes to the endoplasmic reticulum and Golgi complex. Molecular and cellular biology. 1997; 17:571–583.
45. Wolfe BA, Gould KL. Inactivating Cdc25, mitotic style. Cell cycle (Georgetown, Tex). 2004; 3:601–603.
46. Donzelli M, Draetta GF. Regulating mammalian checkpoints through Cdc25 inactivation. EMBO reports. 2003; 4:671–677.
47. Peng CY, Graves PR, Ogg S, Thoma RS, Byrnes MJ, 3rd, Wu Z, Stephenson MT, Piwnica-Worms H. C-TAK1 protein kinase phosphorylates human Cdc25C on serine 216 and promotes 14–3-3 protein binding. Cell growth & differentiation : the molecular biology journal of the American Association for Cancer Research. 1998; 9:197–208.
48. Duckworth BC, Weaver JS, Ruderman JV. G2 arrest in Xenopus oocytes depends on phosphorylation of cdc25 by protein kinase A. Proceedings of the National Academy of Sciences of the United States of America. 2002; 99:16794–16799.
49. Riester M, Taylor JM, Feifer A, Koppie T, Rosenberg JE, Downey RJ, Bochner BH, Michor F. Combination of a novel gene expression signature with a clinical nomogram improves the prediction of survival in high-risk bladder cancer. Clin Cancer Res. 2012; 18:1323–1333.
50. Hsu HP, Li CF, Lee SW, Wu WR, Chen TJ, Chang KY, Liang SS, Tsai CJ, Shiue YL. Overexpression of stathmin 1 confers an independent prognostic indicator in nasopharyngeal carcinoma. Tumour biology : the journal of the International Society for Oncodevelopmental Biology and Medicine. 2014; 35:2619–2629.
51. Rigby CC, Franks LM. A human tissue culture cell line from a transitional cell tumour of the urinary bladder: growth, chromosone pattern and ultrastructure. British journal of cancer. 1970; 24:746–754.
52. Yeh MY, Yu DS, Chen SC, Lin MS, Chang SY, Ma CP, Han SH. Establishment and characterization of a human urinary bladder carcinoma cell line (TSGH-8301). Journal of surgical oncology. 1988; 37:177–184.
53. O’Toole C, Price ZH, Ohnuki Y, Unsgaard B. Ultrastructure, karyology and immunology of a cell line originated from a human transitional-cell carcinoma. British journal of cancer. 1978; 38:64–76.
54. Kuo KK, Chen YL, Chen LR, Li CF, Lan YH, Chang FR, Wu YC, Shiue YL. Involvement of phorbol-12-myristate-13-acetate-induced protein 1 in goniothalamin-induced TP53-dependent and -independent apoptosis in hepatocellular carcinoma-derived cells. Toxicology and applied pharmacology. 2011; 256:8–23.